Tag: mutual funds

Winning with Market-cap ETFs

The Parag Parikh stable of funds attract a lot of attention because they are good story-tellers. In their Flexi-cap Fund, they are simultaneously placing concentrated bets on US and Indian equities, hedging, arbitraging, selling cover-calls, making cash allocation calls, and so on. And they talk about it a lot.

All this activity should surely result in superior performance?

We had written a couple of notes around this back in 2015 and 2019. Our concern revolved around return-attribution. When you are doing so many things, how do we know if you are actually good at any one of them?

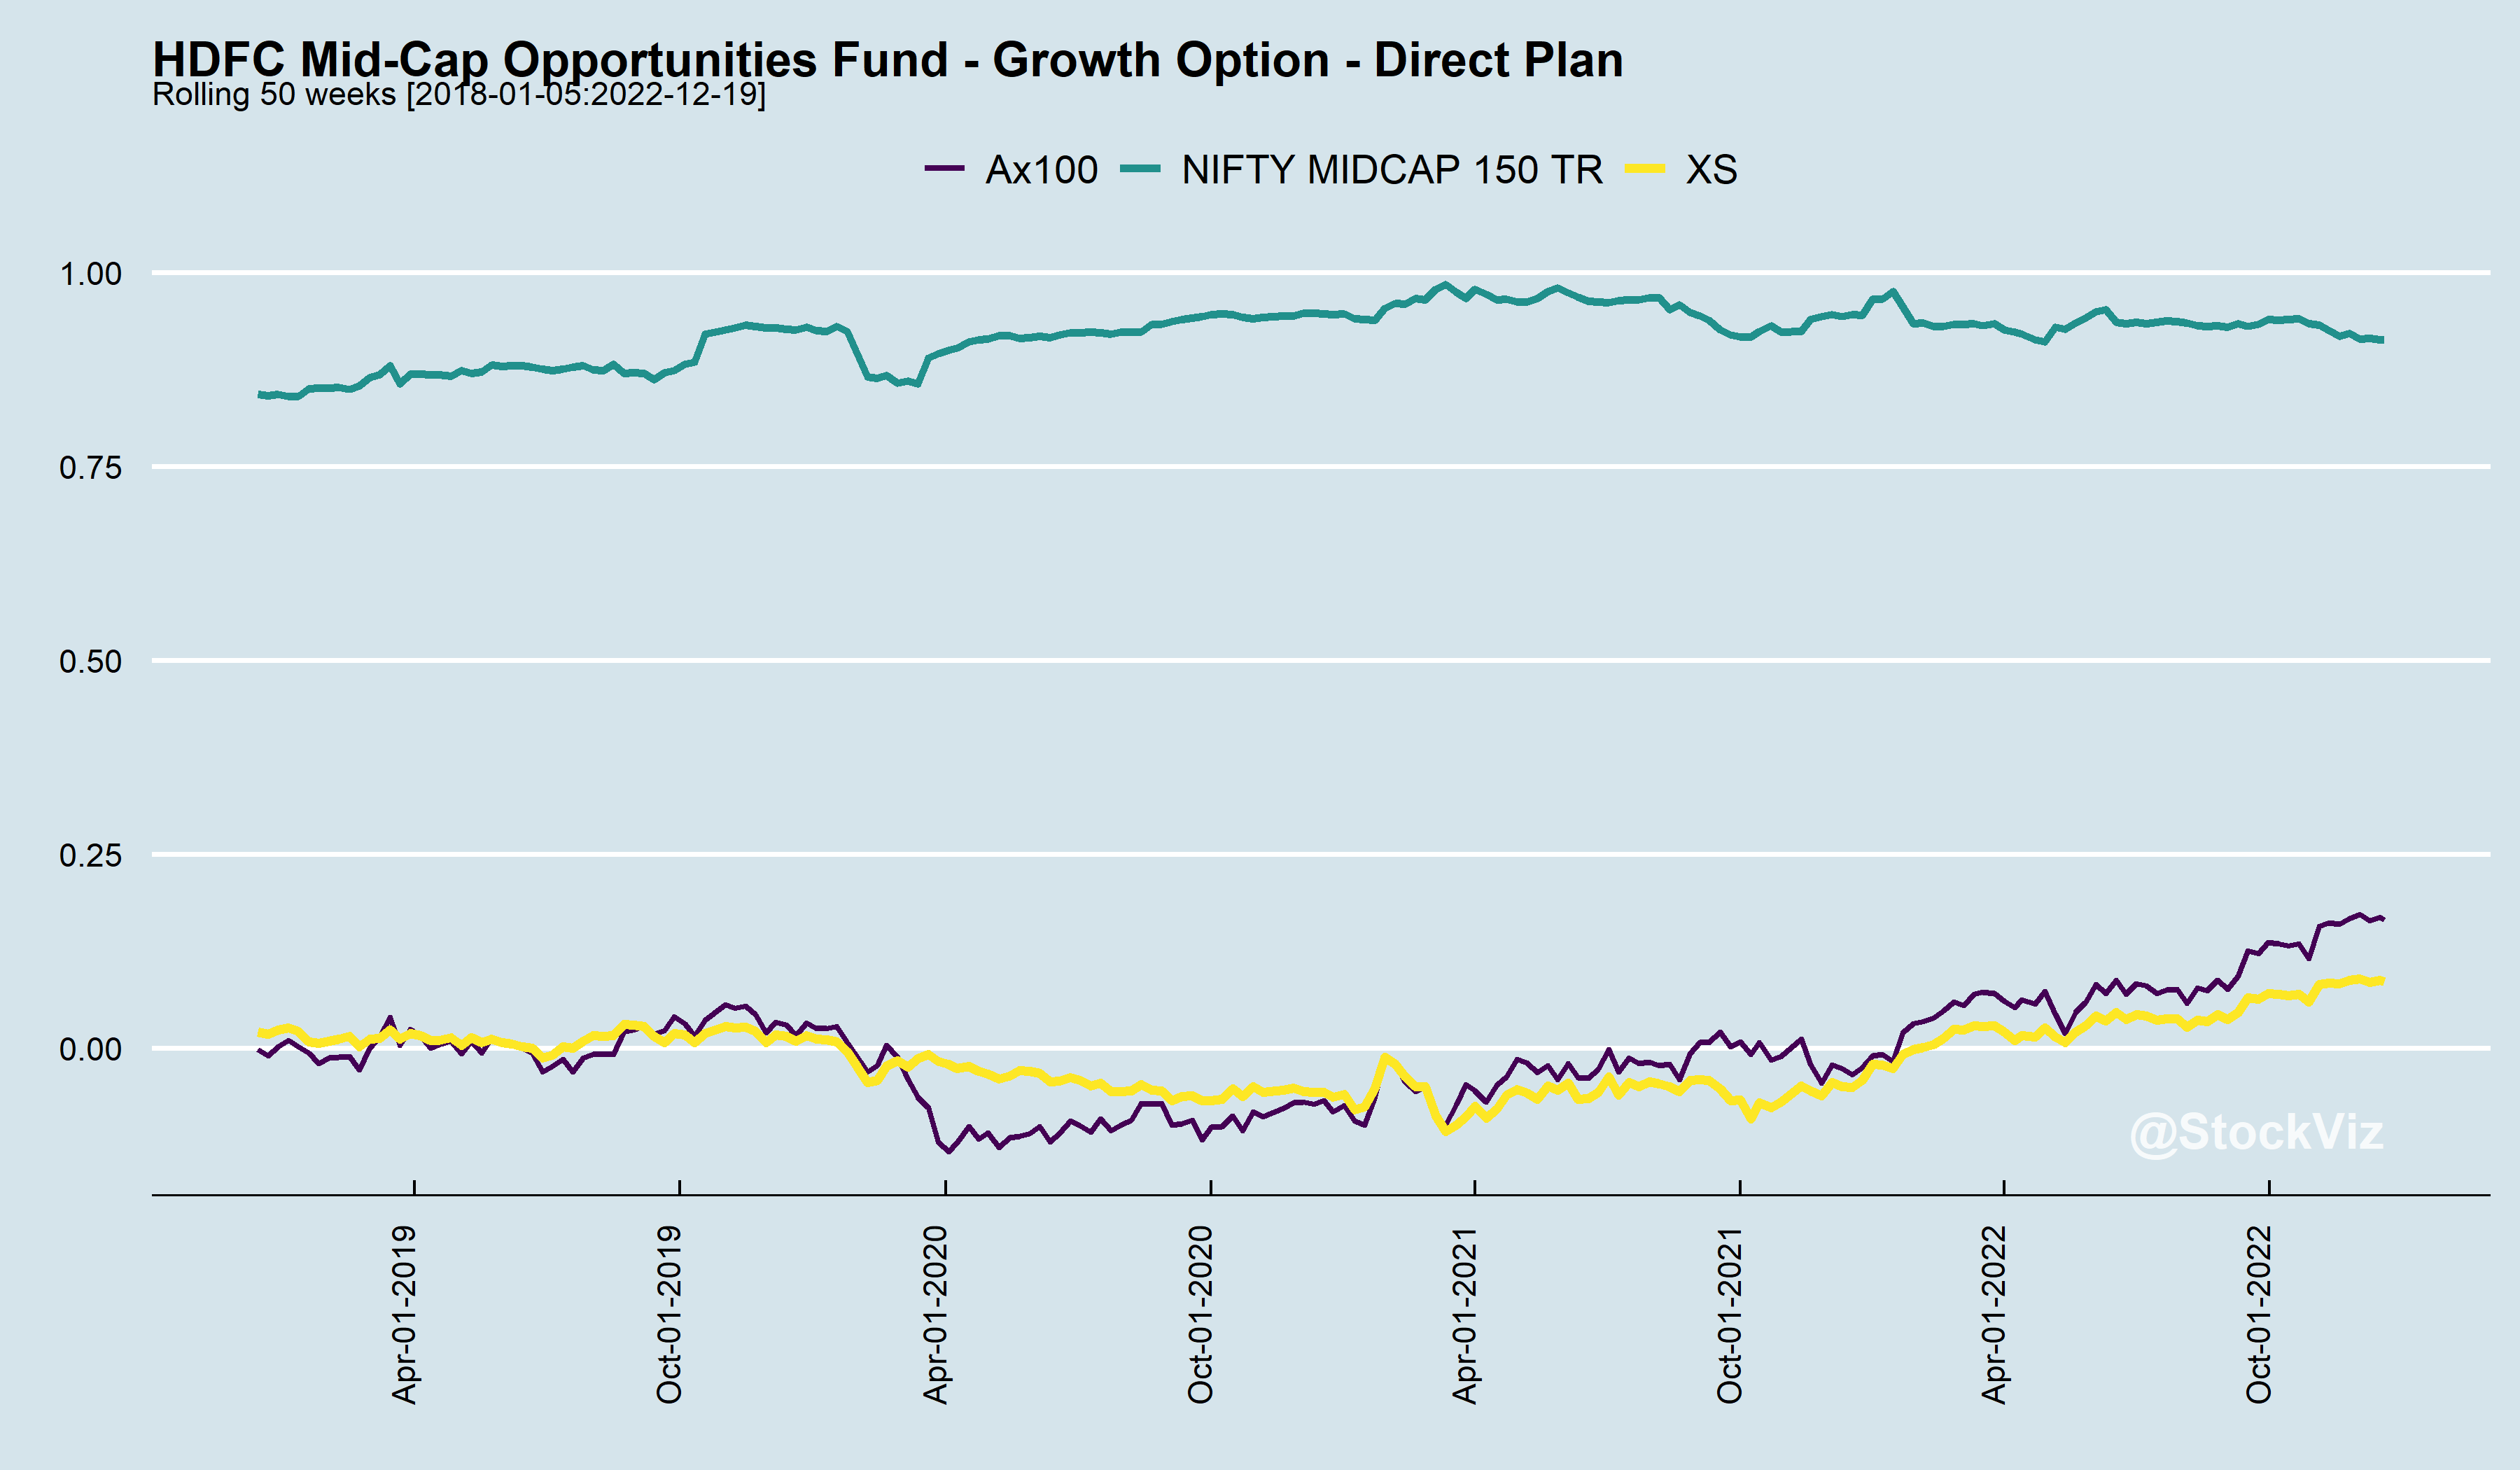
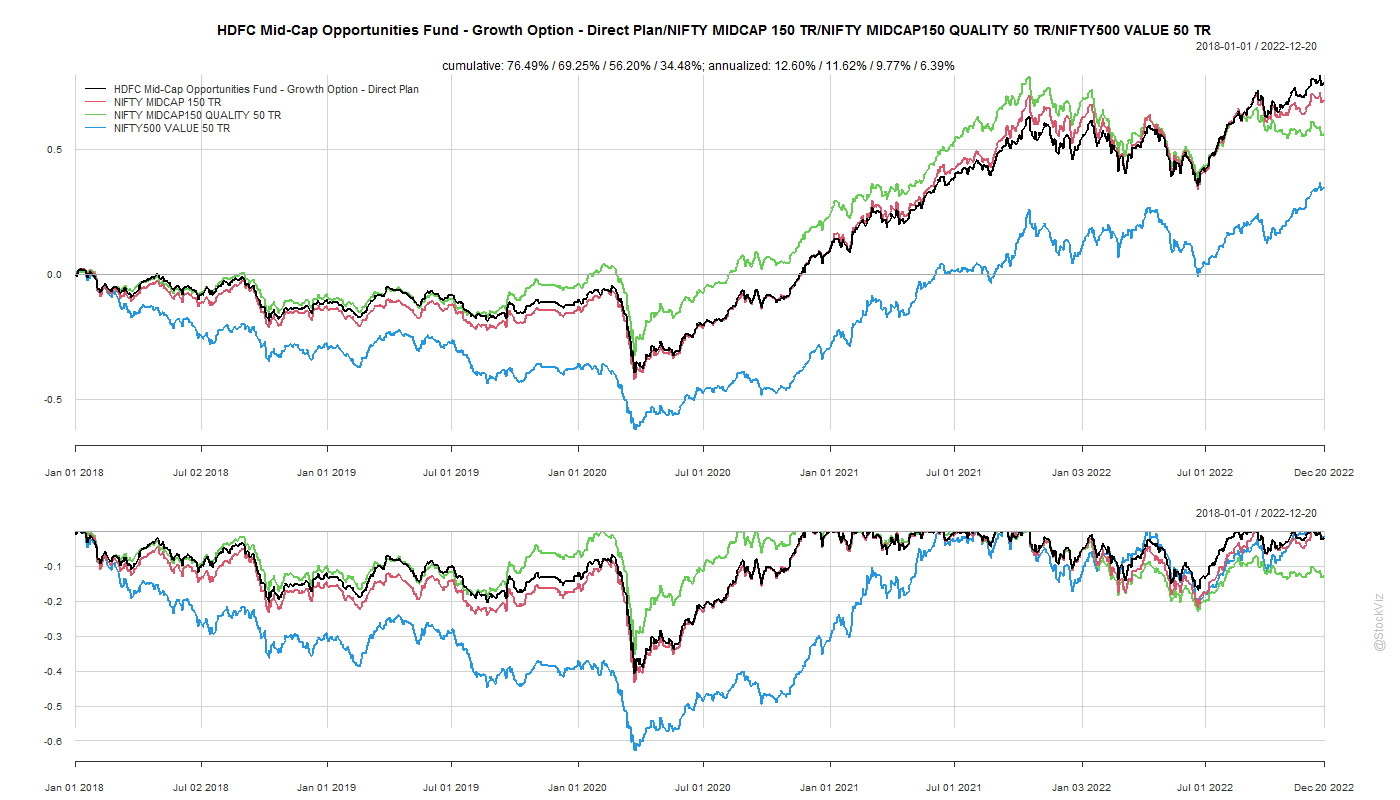
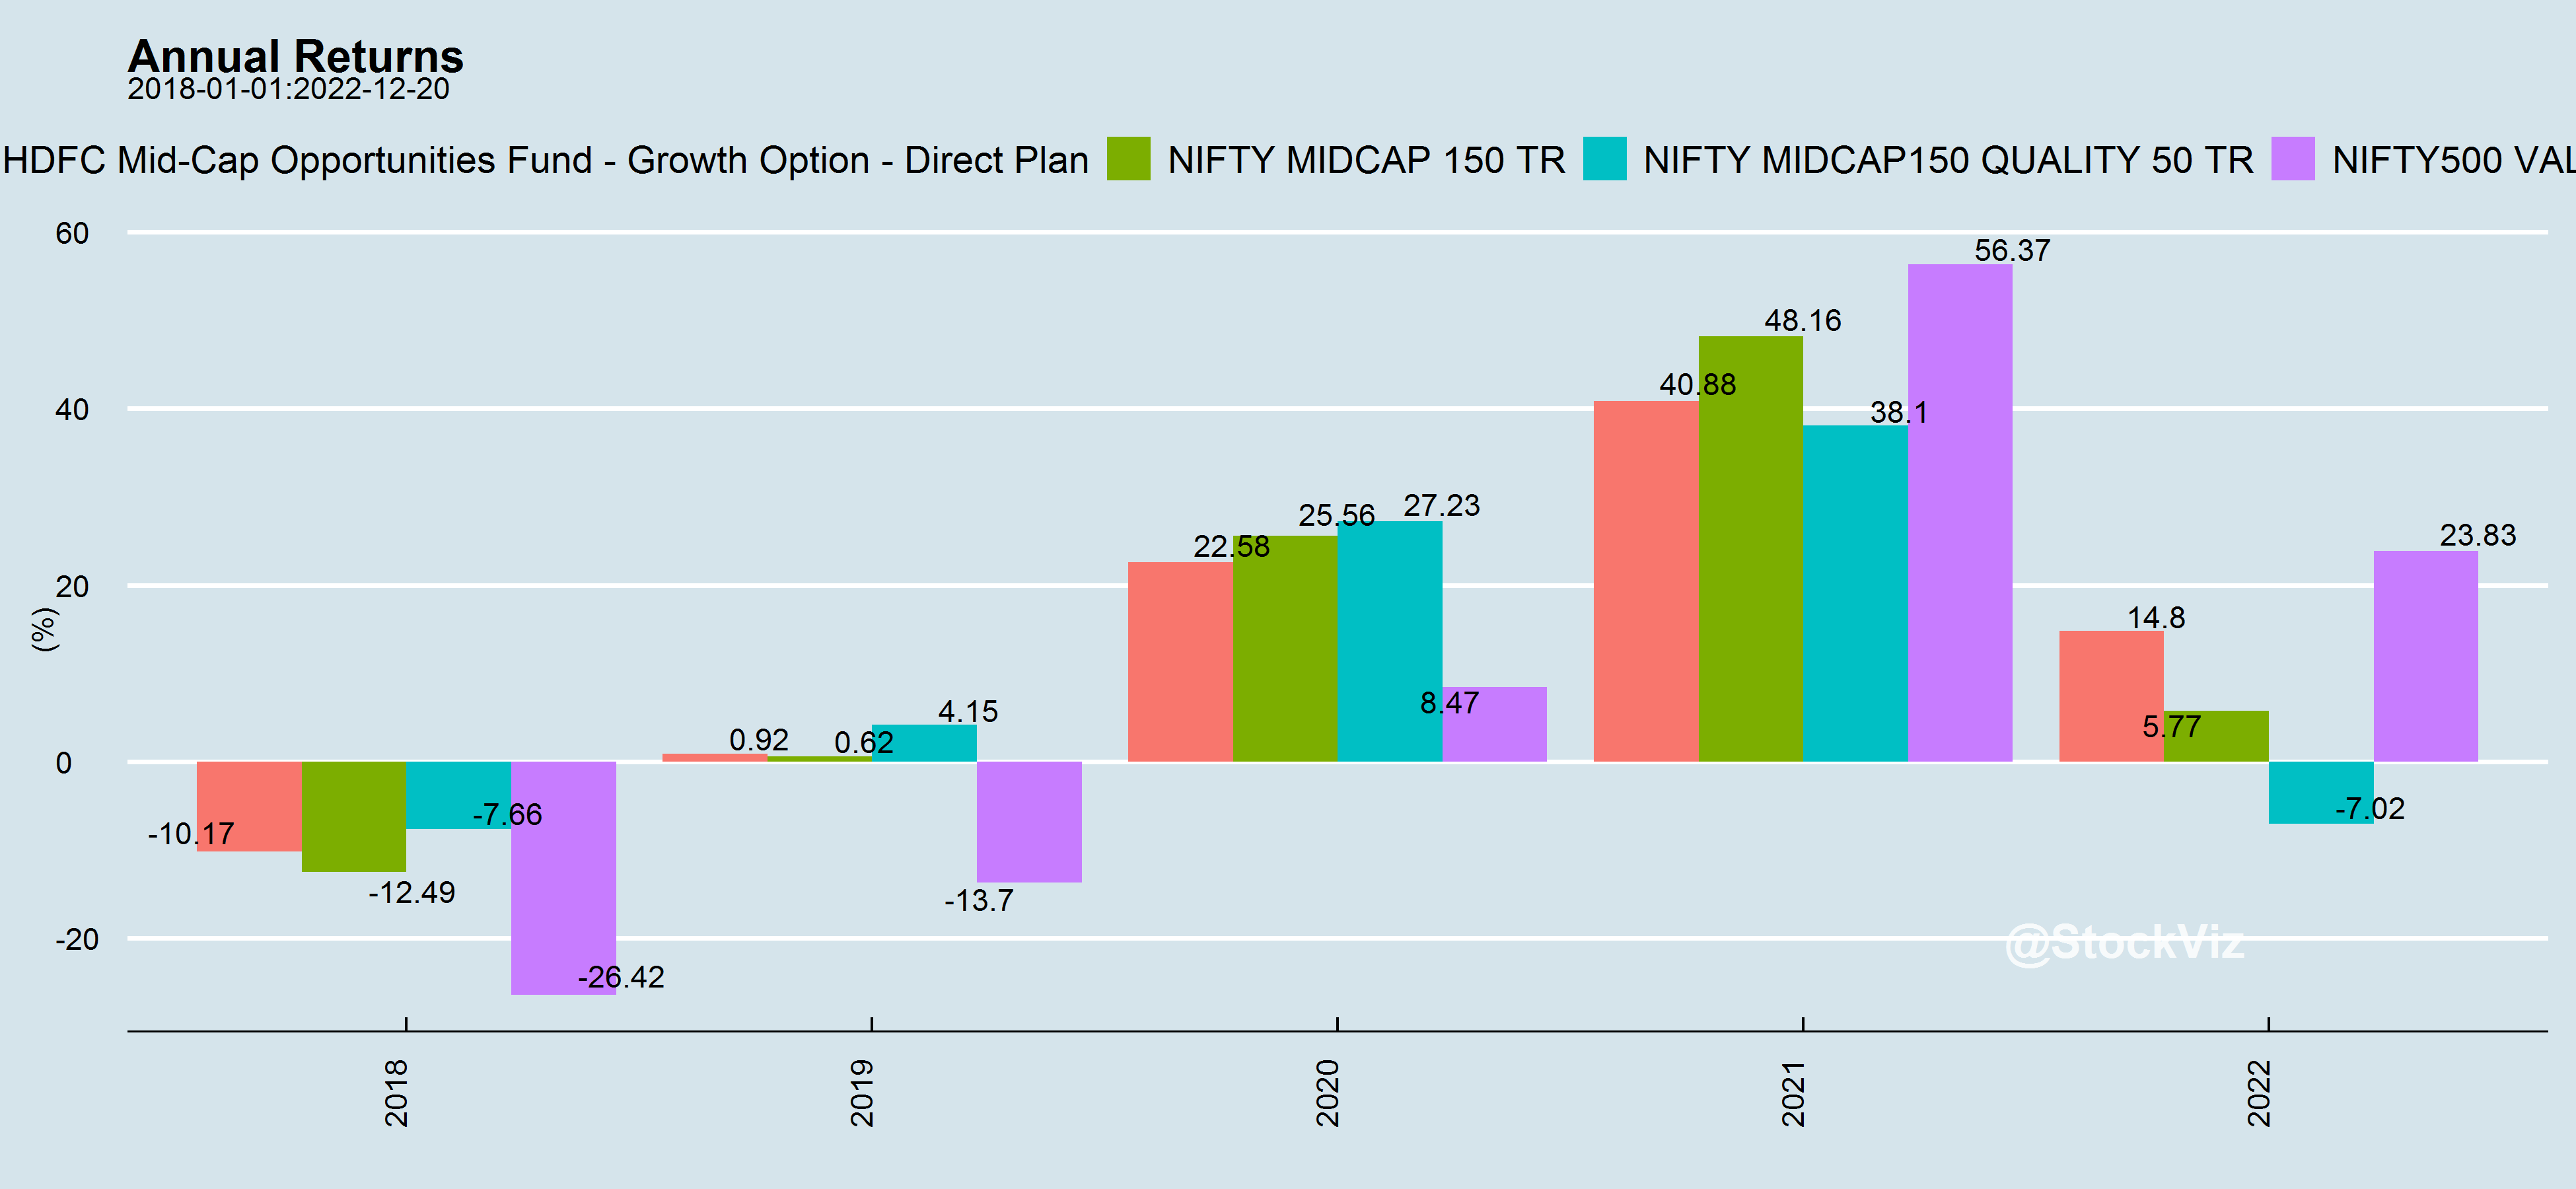
If you look at returns since the first note came out, they under-perform the MIDCAP 150 index.

Not that there weren’t years where they out-performed. However, given all that activity, is this all they could do?

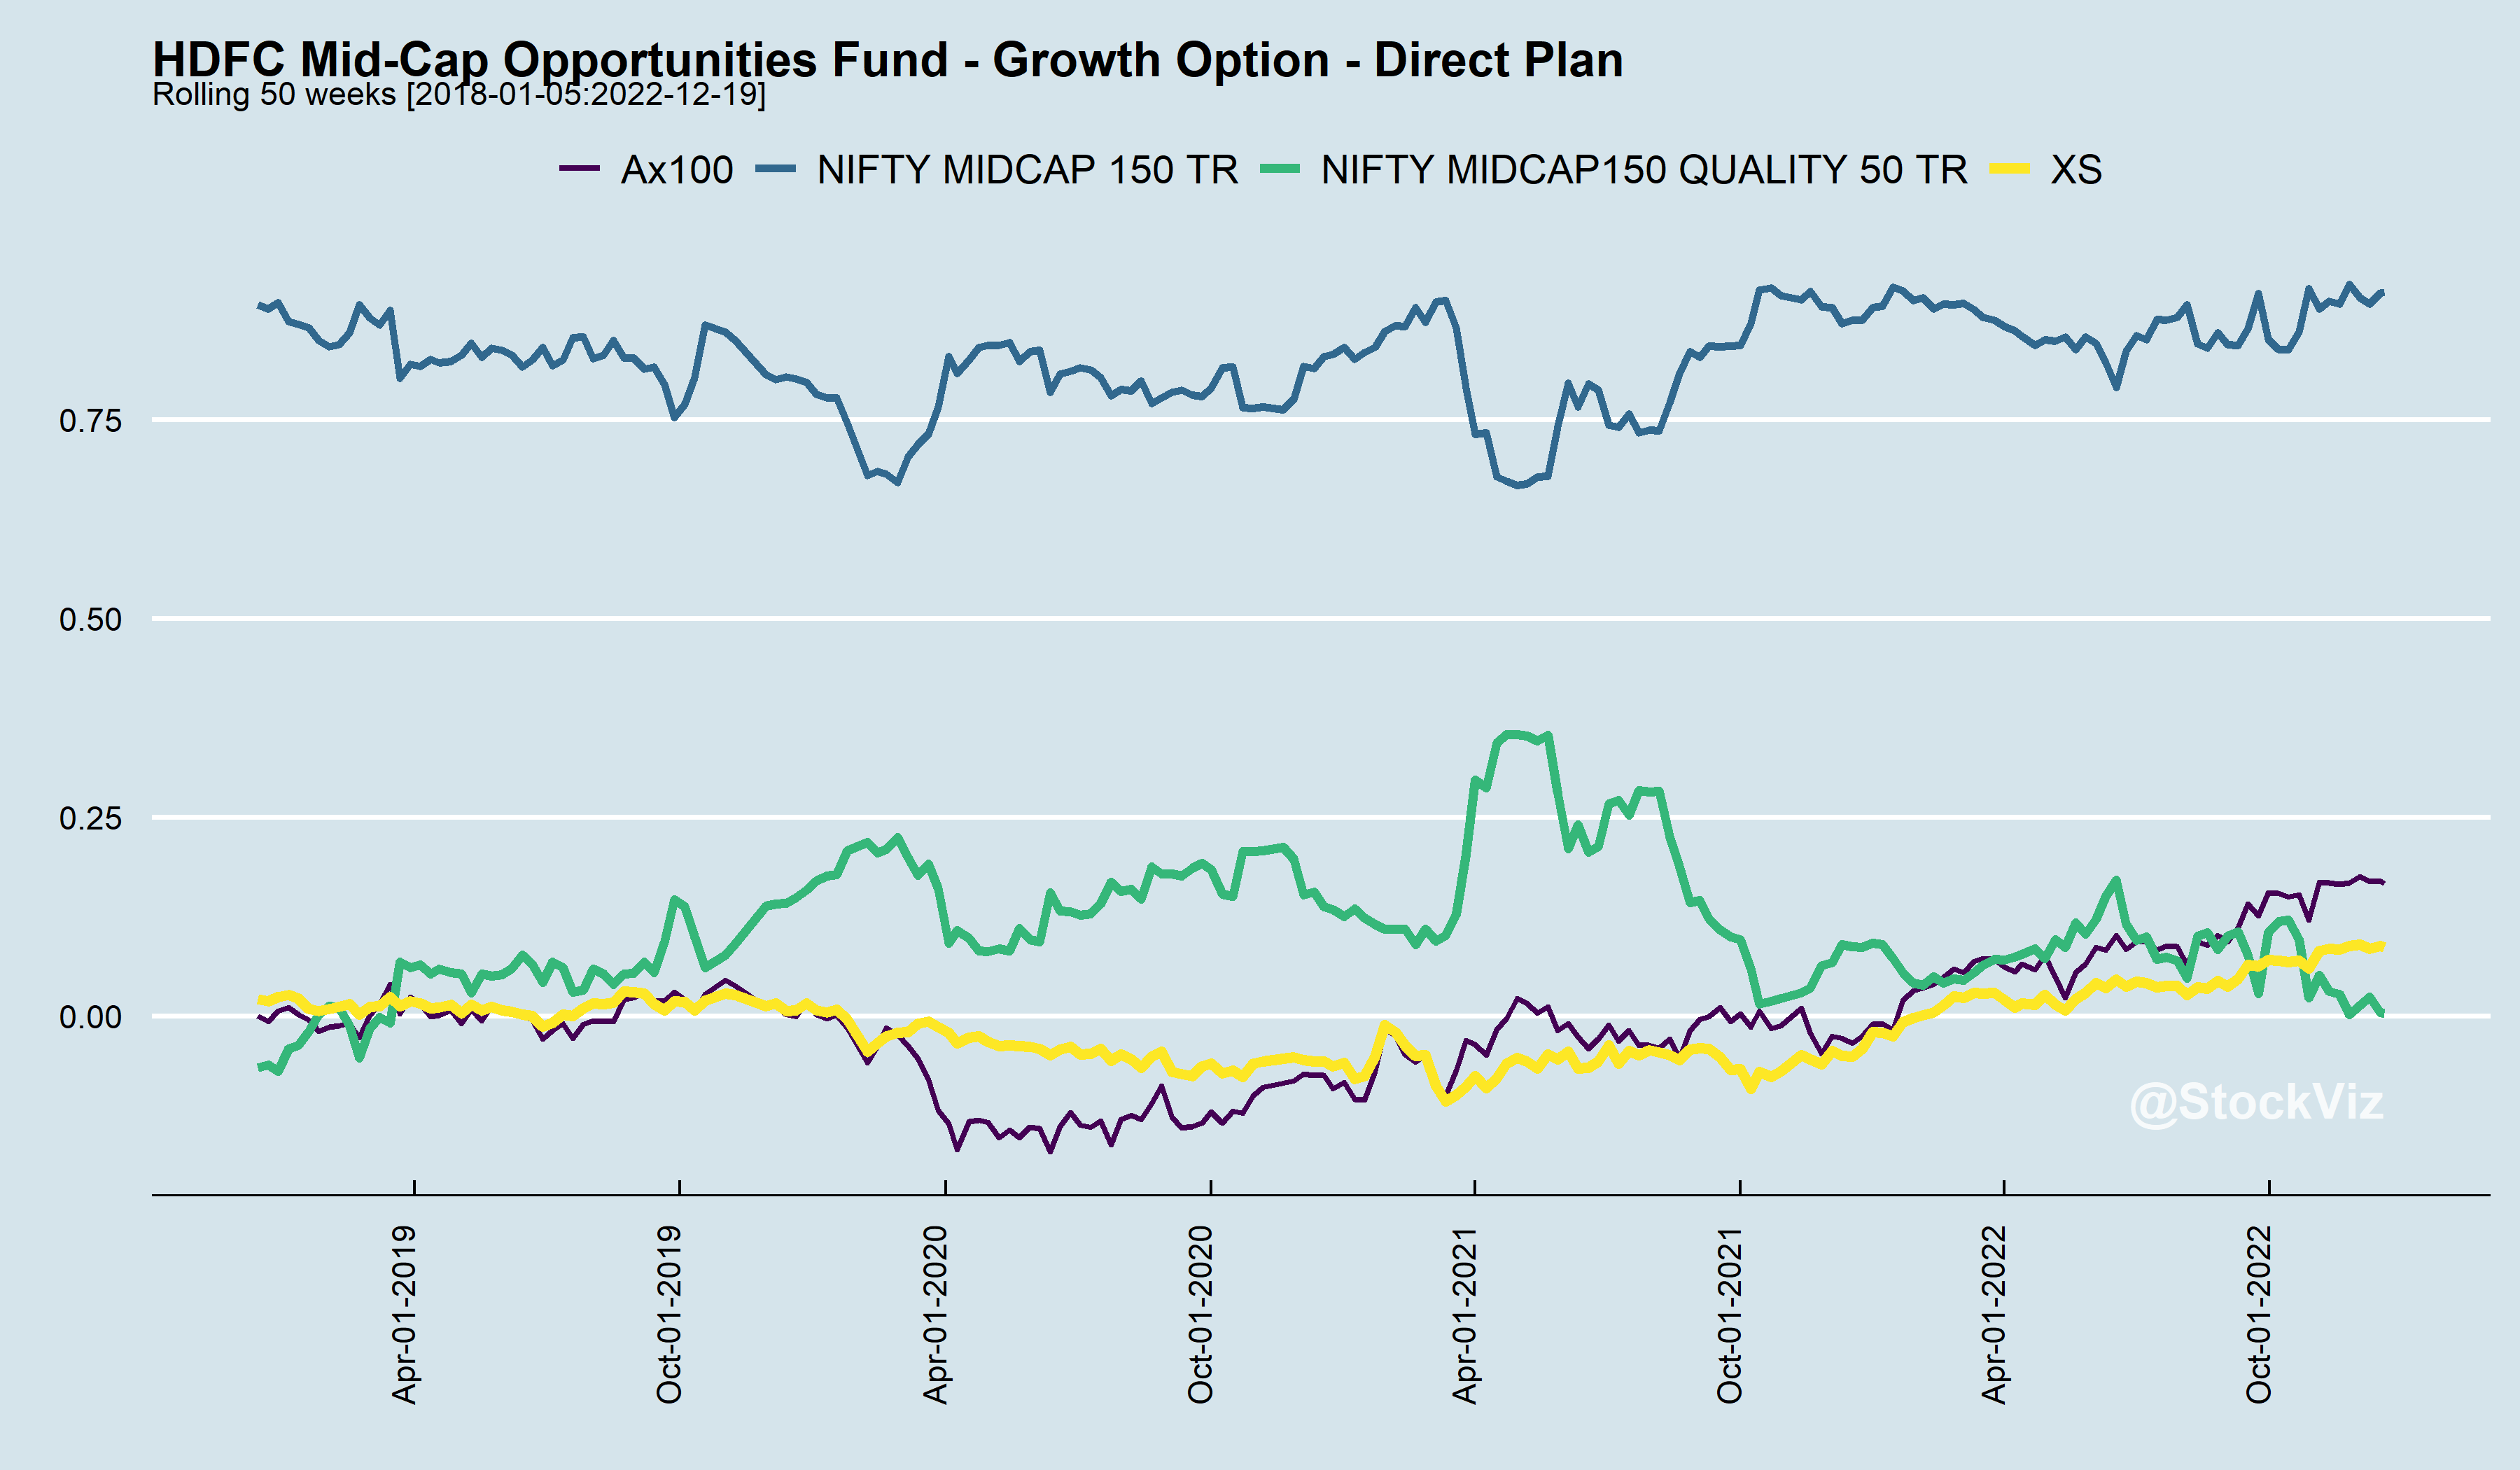
In our second note, we had mentioned that you could, technically, replace the fund with a midcap and S&P 500 index ETF in a 65-35 ratio. So, from that point on, if you were to construct such a portfolio, it would beat the fund as well.

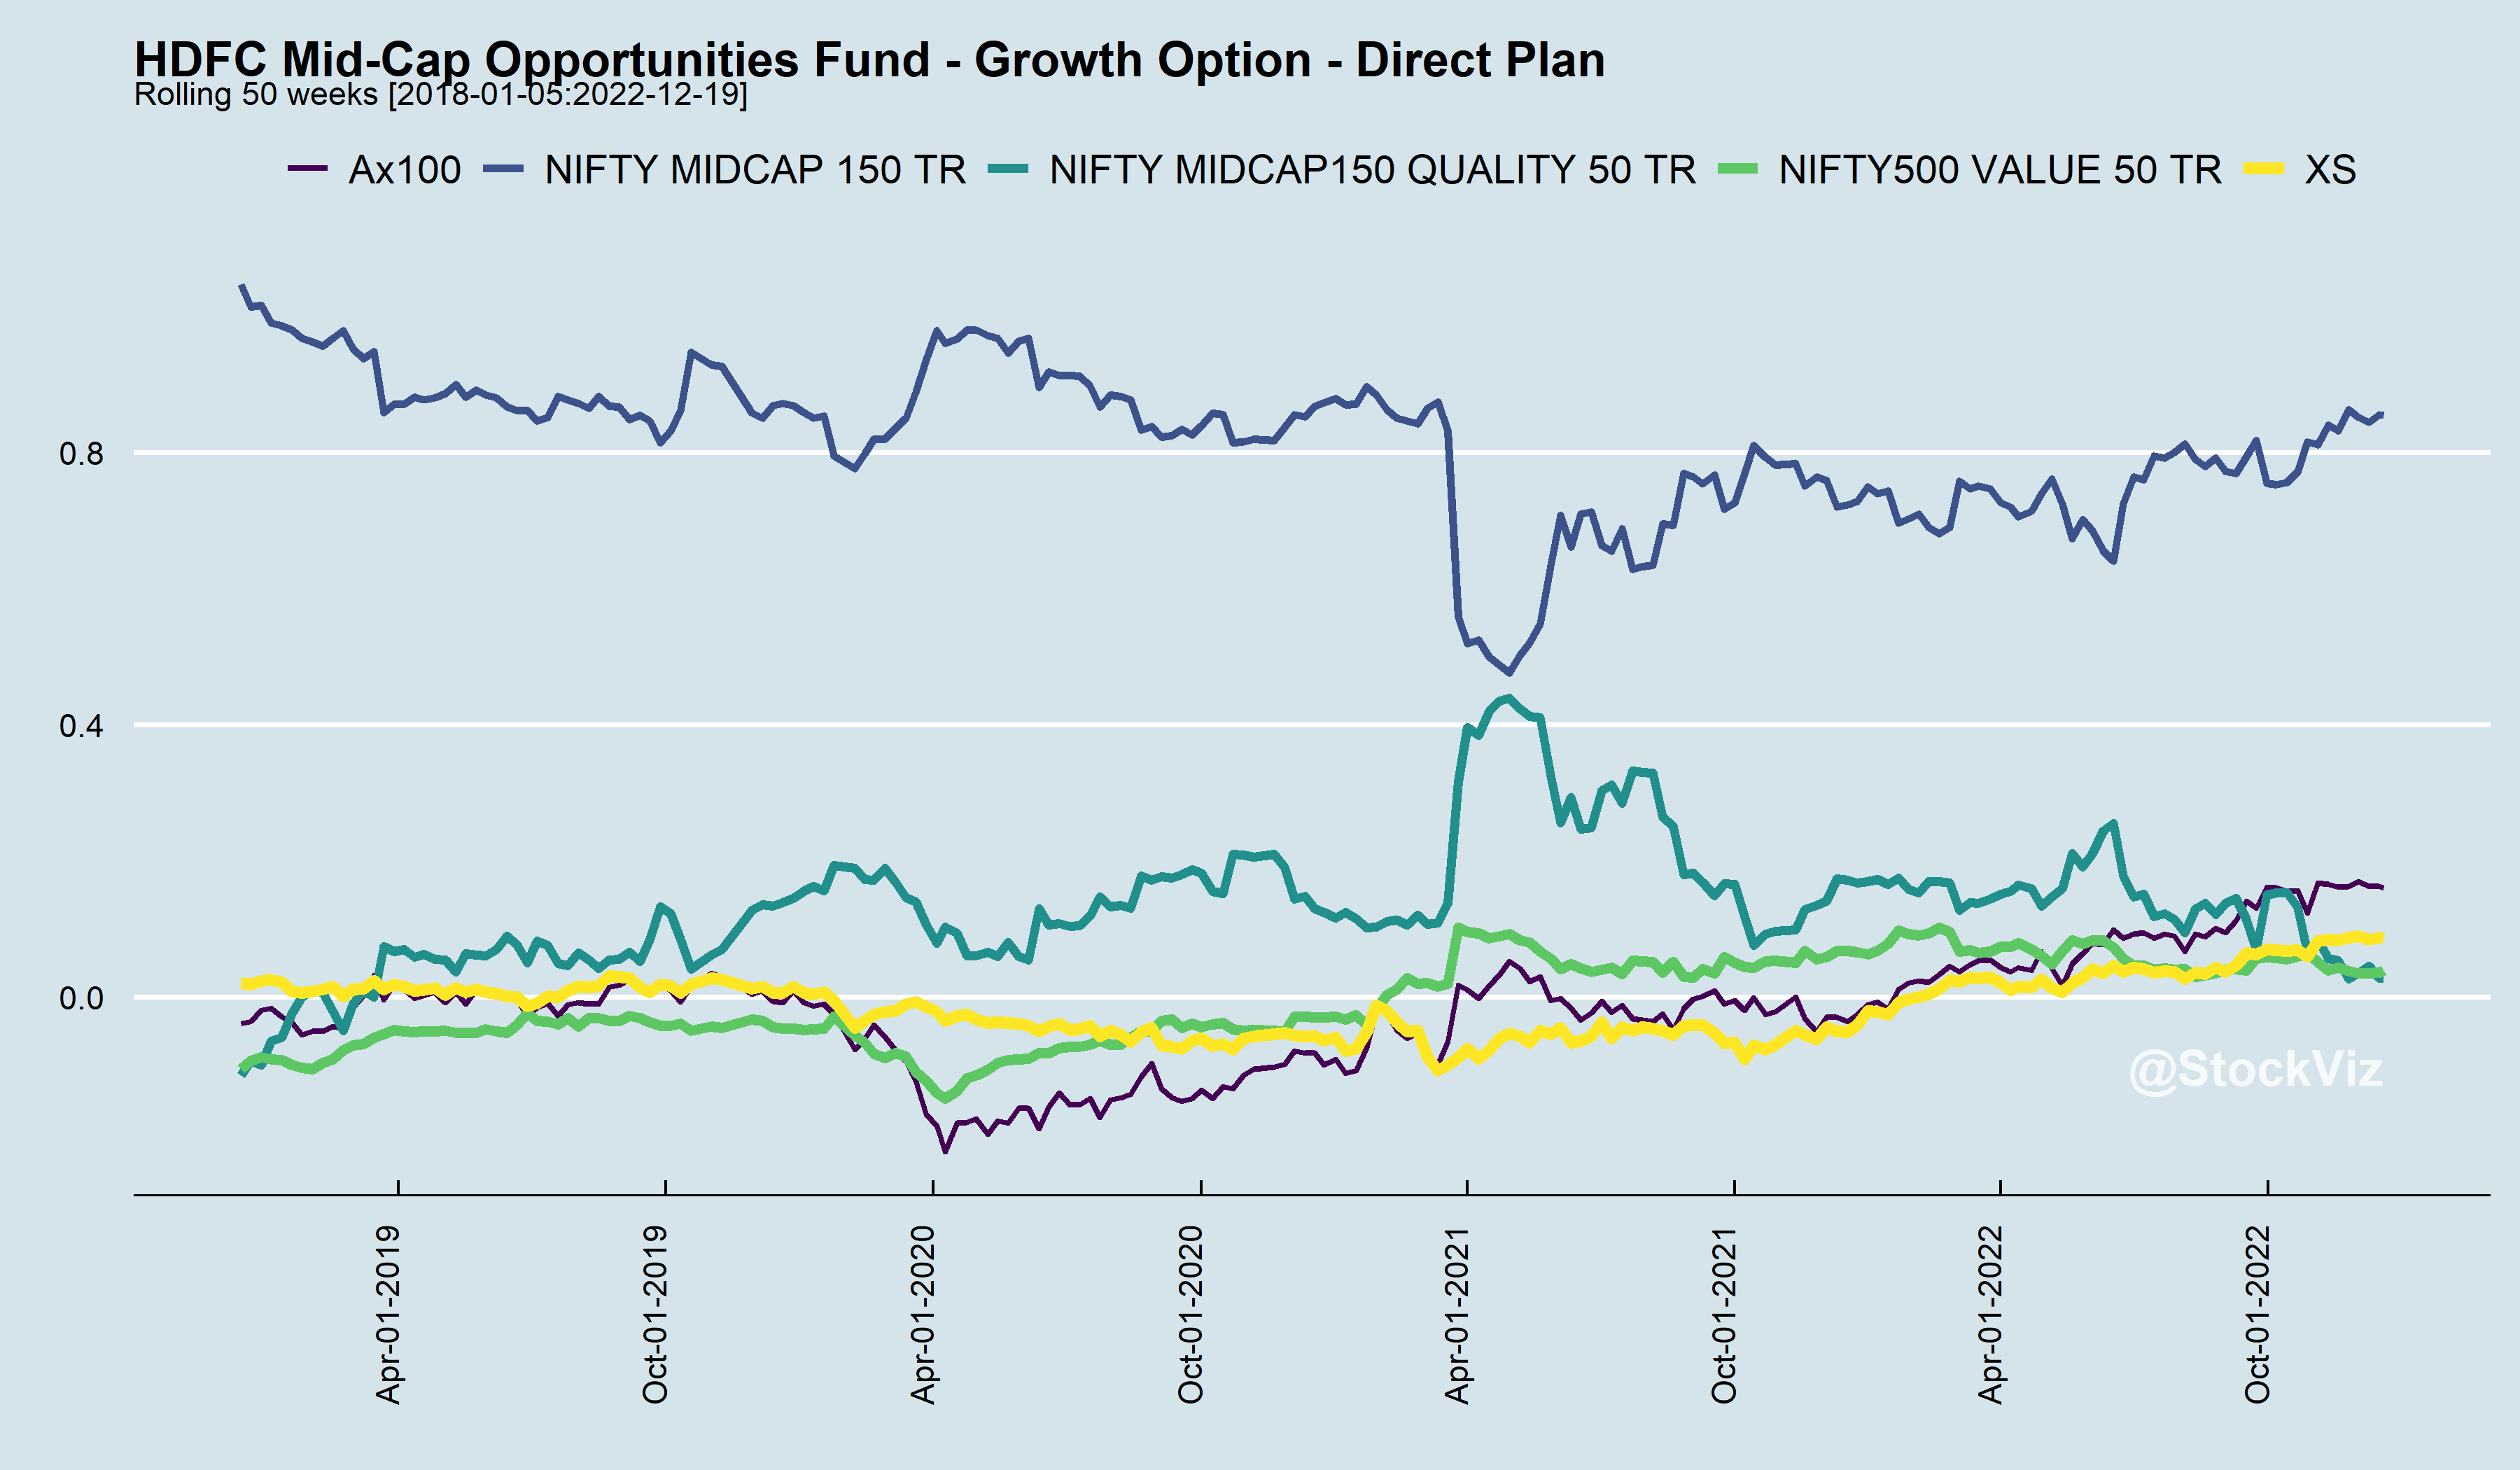
It is not that their stock picks are bad. If you analyze the Indian equity portion of their portfolio over time, their stock picks, on average, has delivered 2% over the midcap index during the holding period.

And while digging through this, we noticed that there is alpha in keeping track of stocks that they have exited.

There is a decent skew in favor of entries but not as much as exits.

It is often said that exiting a position is tougher than entering it. In that sense, the fund managers have displayed good skill.

Tracking the current portfolio may not yield much. For example, if you look at positions held for more than 12 months, excess returns are distributed across the spectrum.

Our suggestion is that you can treat the fund as a research project for your own edification, but when it comes to deploying your own capital, you can stick with market-cap ETFs and index funds.

Code and charts on github.

Performance & Flows

Our previous post examined how index providers and asset managers launch “hot” thematic/sectoral indices and funds to capitalize on stories. Who can blame them? Money always flows in to assets with strong recent performance (this is the very basis of momentum strategies). Take gold, for example.

Fund flows have a near perfect correlation with performance.

Flows into gold funds is nothing compared to what happened in thematic funds.

If investors were rational, flows would be predictable. However, that is not nearly the case.

The problem with lumpy flows in to hot assets is that once the price action cools down, the funds are trapped. Investors tend to feel the emotional pain of a loss about twice as intensely as the joy of an equivalent gain. So, they wait for the next cycle to exit.

If you look the cumulative flows into Sectoral/Thematic funds, there’s a large reservoir of capital that will look for an exit when these funds come back up to par.

Flows follow performance. And if the asset is illiquid enough, performance will then overshoot flows to form a spiral.

Map the terrain. Understand the landscape before making your move.

Code and charts on github.

Index and Funds

Index funds and ETFs proved most naysayers wrong and finally took off post-COVID. Now, we are dealing with a problem of plenty.

The number of indices and index funds have skyrocketed with the vast majority of AUM concentrated in large-cap market-weighted indices.

As everything in investing, it is always better to wait for things to settle down before committing capital. Index post-launch returns tend to disappoint.

And these numbers are worse for index funds.

While investors win by having low-cost access to a wide range of strategies and sectors, they can still lose by rushing in to “hot” launches. Patience pays.

Charts and code on github.

What is Alpha?

In our introduction to factors, we discussed how portfolio returns are mostly explained by market risk (rmrf: market risk premium.) Whatever cannot be explained by the market is α, or the portfolio manager’s skill. If you strip away the financial jargon, this is nothing but linear regression.

Also, what exactly is “market risk?” A few years ago, the only index funds on the market were of the NIFTY 50 and MIDCAP 150 indices. However, the number of index funds keep ticking up and there are now several strategy funds covering quality, value, low-volatility, momentum, etc… in the market. So, if an investor can access these vanilla strategies at a low cost, shouldn’t the definition of the “market” expand to incorporate those?

For example, take the HDFC Mid-cap Opp. Fund. You could regress its returns against the NIFTY MIDCAP 150, the NIFTY MIDCAP150 QUALITY 50 and NIFTY500 VALUE 50 indices to get an idea of how its α over them has evolved over time.

Rolling regressions gives you an idea of portfolio tilts and the fluctuating nature of α (Ax100). Also, its worth noting that α is only tangentially related to excess returns (XS). There are periods here where XS was positive in spite of negative Ax100 and vice versa.

Styles go in-and-out of favor. Sometimes Quality performs better than Value and sometimes a simple cap-weighted index will outperform everything else. An actively managed portfolio’s relative performance to these styles change over time as well.

tl;dr:

  • α is a statistical derivation.
  • Don’t go chasing α – it keeps fluctuating.
  • α is not the same as excess returns.
  • When in doubt, index and forget.
  • You are always in doubt.

We have setup a script that auto-updates every day with these regressions on select large-cap and mid-cap funds. The report is available here.

Probabilistic Sharpe Ratio

There is absolutely zero stability in metrics used to analyze mutual fund performance. Whether it is alpha, beta or information ratio, they all vary over time and across market environments. Using them to pick the next “winning” fund is pointless. They are, at best, a measure of what happened in the past.

Mutual Funds: A quick note on performance metrics

Sharpe Ratio was one of the first attempts at quantifying investment returns. It is simply the average return divided by the standard deviation of returns. However, the approximation that returns are normally distributed makes it unsuitable for comparing across different investments/strategies.

But what if you kept the basic assumption that returns are normally distributed and introduced adjustments for kurtosis and skewness? One such approach is Marcos López de Prado’s Probabilistic Sharpe Ratio (pdf.)

Let’s say the calculated (historical) Sharpe Ratio of the investment is SR^. The benchmark has a Sharpe of SR*. Then, the Probabilistic Sharpe Ratio, PSR(SR*) = Prob[SR <= SR^]

Intuitively, PSR increases as the standard deviation of SR decreases, increases with positively skewed returns and decreases with fatter tails.

So, given investments with similar Sharpe Ratios, invest in the one that has a higher PSR.

We took two large-cap mutual funds that have been around since 2006, the NIFTY 50 TR index and a basic SMA-50 long-only strategy over NIFTY 50 TR to see how the ratios shake out.

Probabilistic Sharpe Ratio

From what we see here, both from a historical Sharpe as well as PSR, given a choice between MF1 and MF2, one would pick MF1.

Our take: PSR is valuable in cases where you have to choose between multiple strategies with equally attractive Sharpe Ratios since it gives a confidence level around that number.