There is absolutely zero stability in metrics used to analyze mutual fund performance. Whether it is alpha, beta or information ratio, they all vary over time and across market environments. Using them to pick the next “winning” fund is pointless. They are, at best, a measure of what happened in the past.
Mutual Funds: A quick note on performance metrics
Sharpe Ratio was one of the first attempts at quantifying investment returns. It is simply the average return divided by the standard deviation of returns. However, the approximation that returns are normally distributed makes it unsuitable for comparing across different investments/strategies.
But what if you kept the basic assumption that returns are normally distributed and introduced adjustments for kurtosis and skewness? One such approach is Marcos López de Prado’s Probabilistic Sharpe Ratio (pdf.)
Let’s say the calculated (historical) Sharpe Ratio of the investment is SR^. The benchmark has a Sharpe of SR*. Then, the Probabilistic Sharpe Ratio, PSR(SR*) = Prob[SR <= SR^]
Intuitively, PSR increases as the standard deviation of SR decreases, increases with positively skewed returns and decreases with fatter tails.
So, given investments with similar Sharpe Ratios, invest in the one that has a higher PSR.
We took two large-cap mutual funds that have been around since 2006, the NIFTY 50 TR index and a basic SMA-50 long-only strategy over NIFTY 50 TR to see how the ratios shake out.
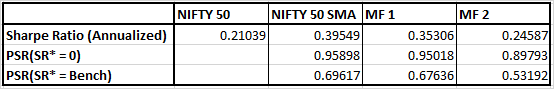
From what we see here, both from a historical Sharpe as well as PSR, given a choice between MF1 and MF2, one would pick MF1.
Our take: PSR is valuable in cases where you have to choose between multiple strategies with equally attractive Sharpe Ratios since it gives a confidence level around that number.