In our introduction to factors, we discussed how portfolio returns are mostly explained by market risk (rm – rf: market risk premium.) Whatever cannot be explained by the market is α, or the portfolio manager’s skill. If you strip away the financial jargon, this is nothing but linear regression.
Also, what exactly is “market risk?” A few years ago, the only index funds on the market were of the NIFTY 50 and MIDCAP 150 indices. However, the number of index funds keep ticking up and there are now several strategy funds covering quality, value, low-volatility, momentum, etc… in the market. So, if an investor can access these vanilla strategies at a low cost, shouldn’t the definition of the “market” expand to incorporate those?
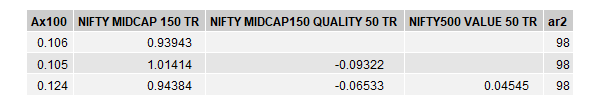
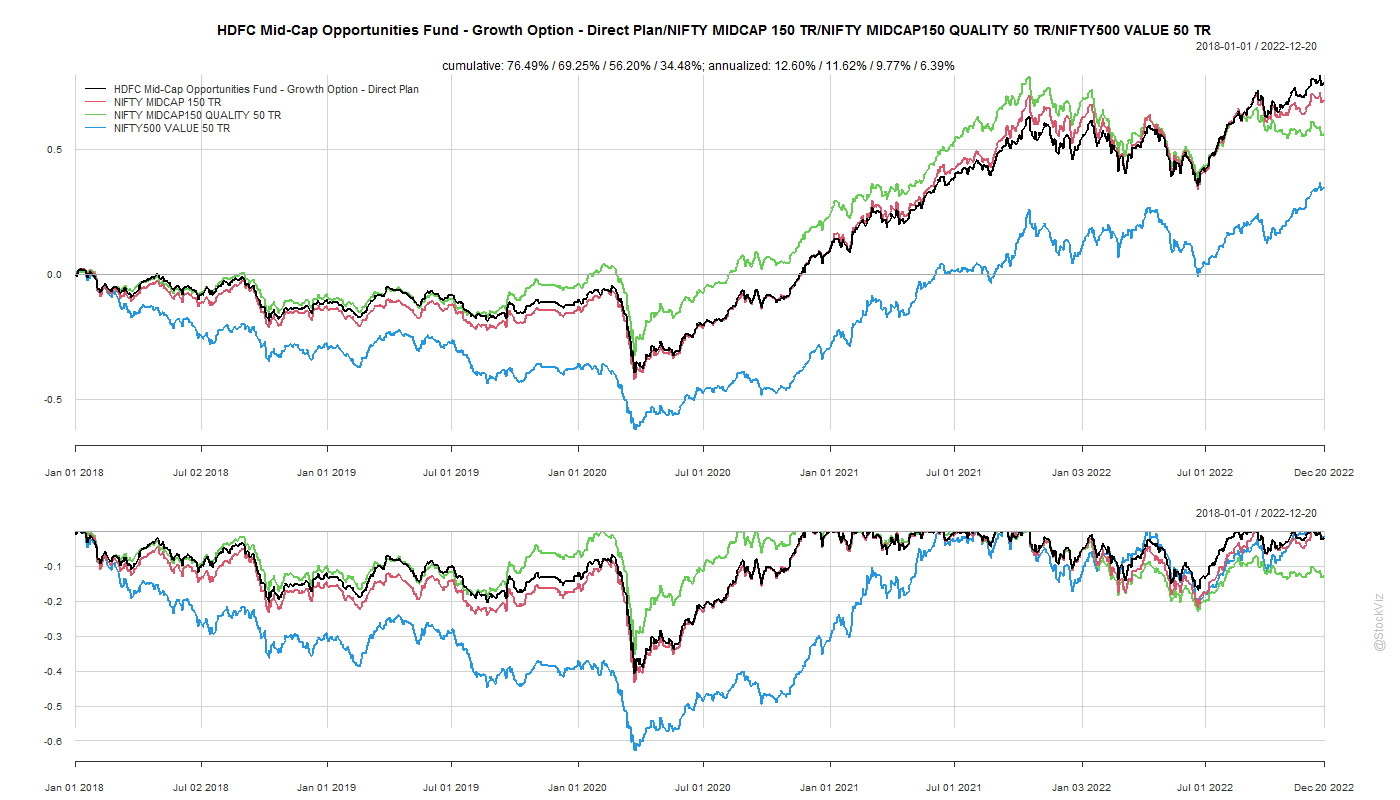
For example, take the HDFC Mid-cap Opp. Fund. You could regress its returns against the NIFTY MIDCAP 150, the NIFTY MIDCAP150 QUALITY 50 and NIFTY500 VALUE 50 indices to get an idea of how its α over them has evolved over time.
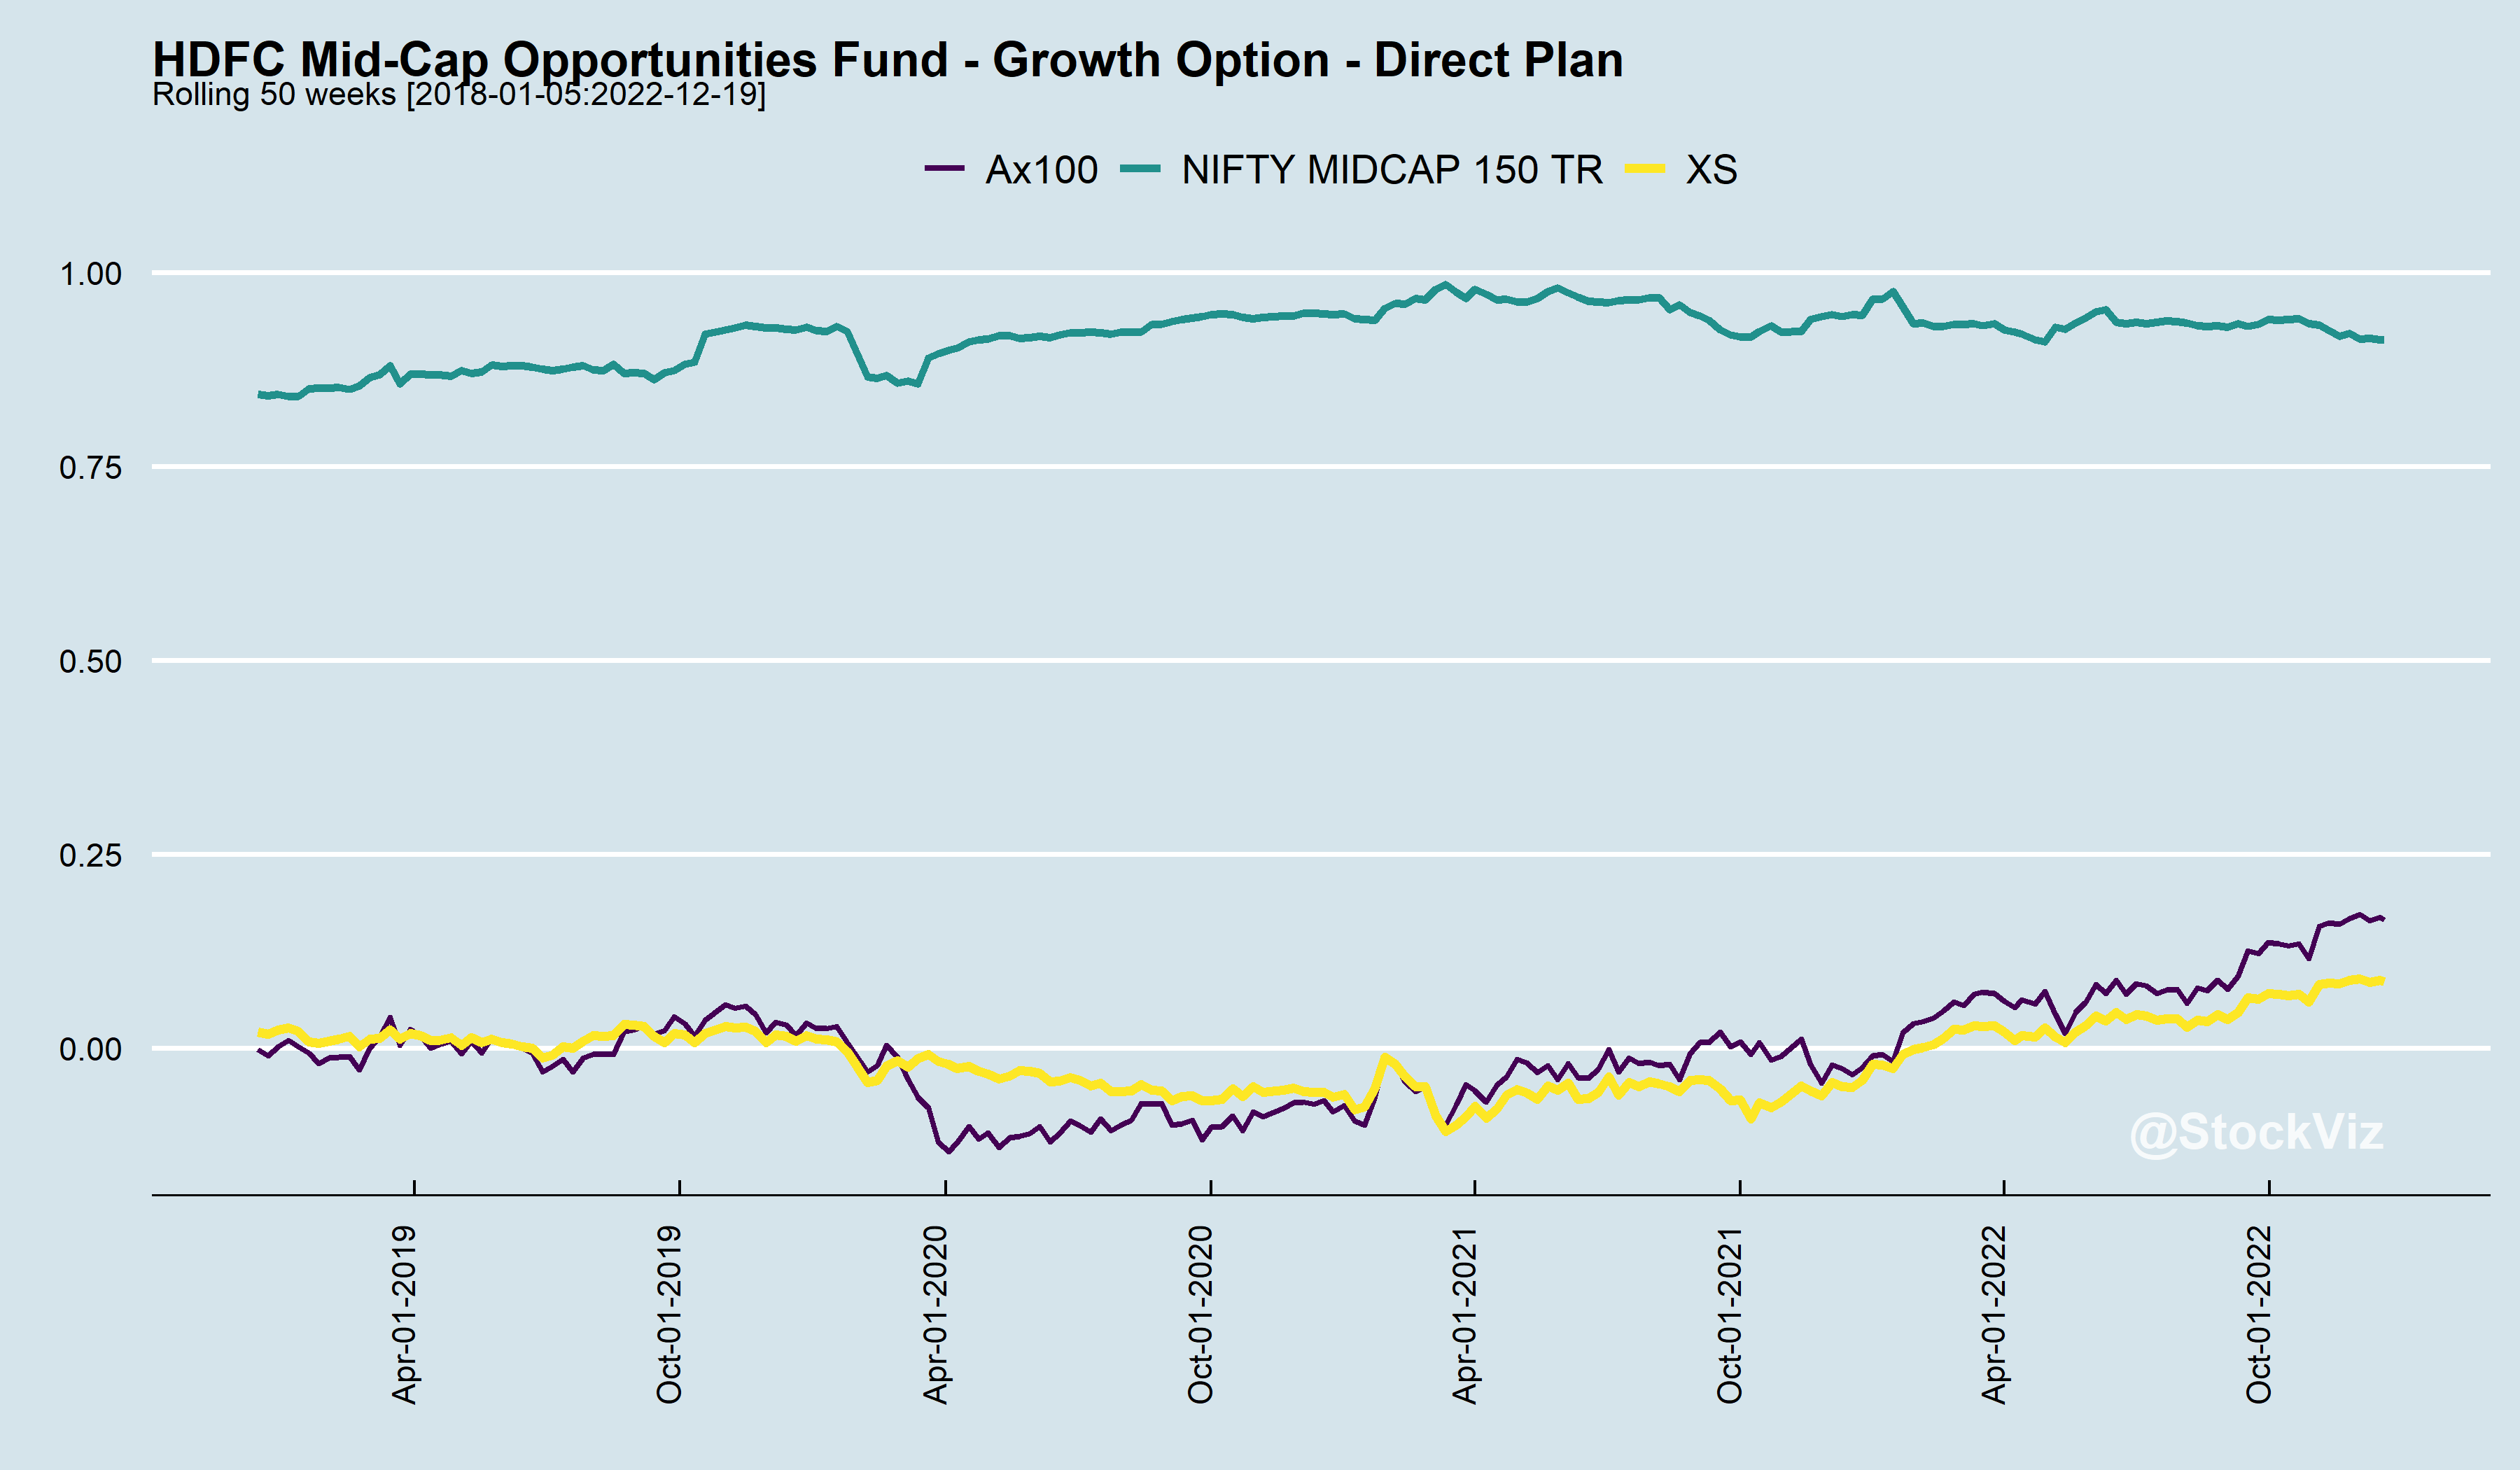
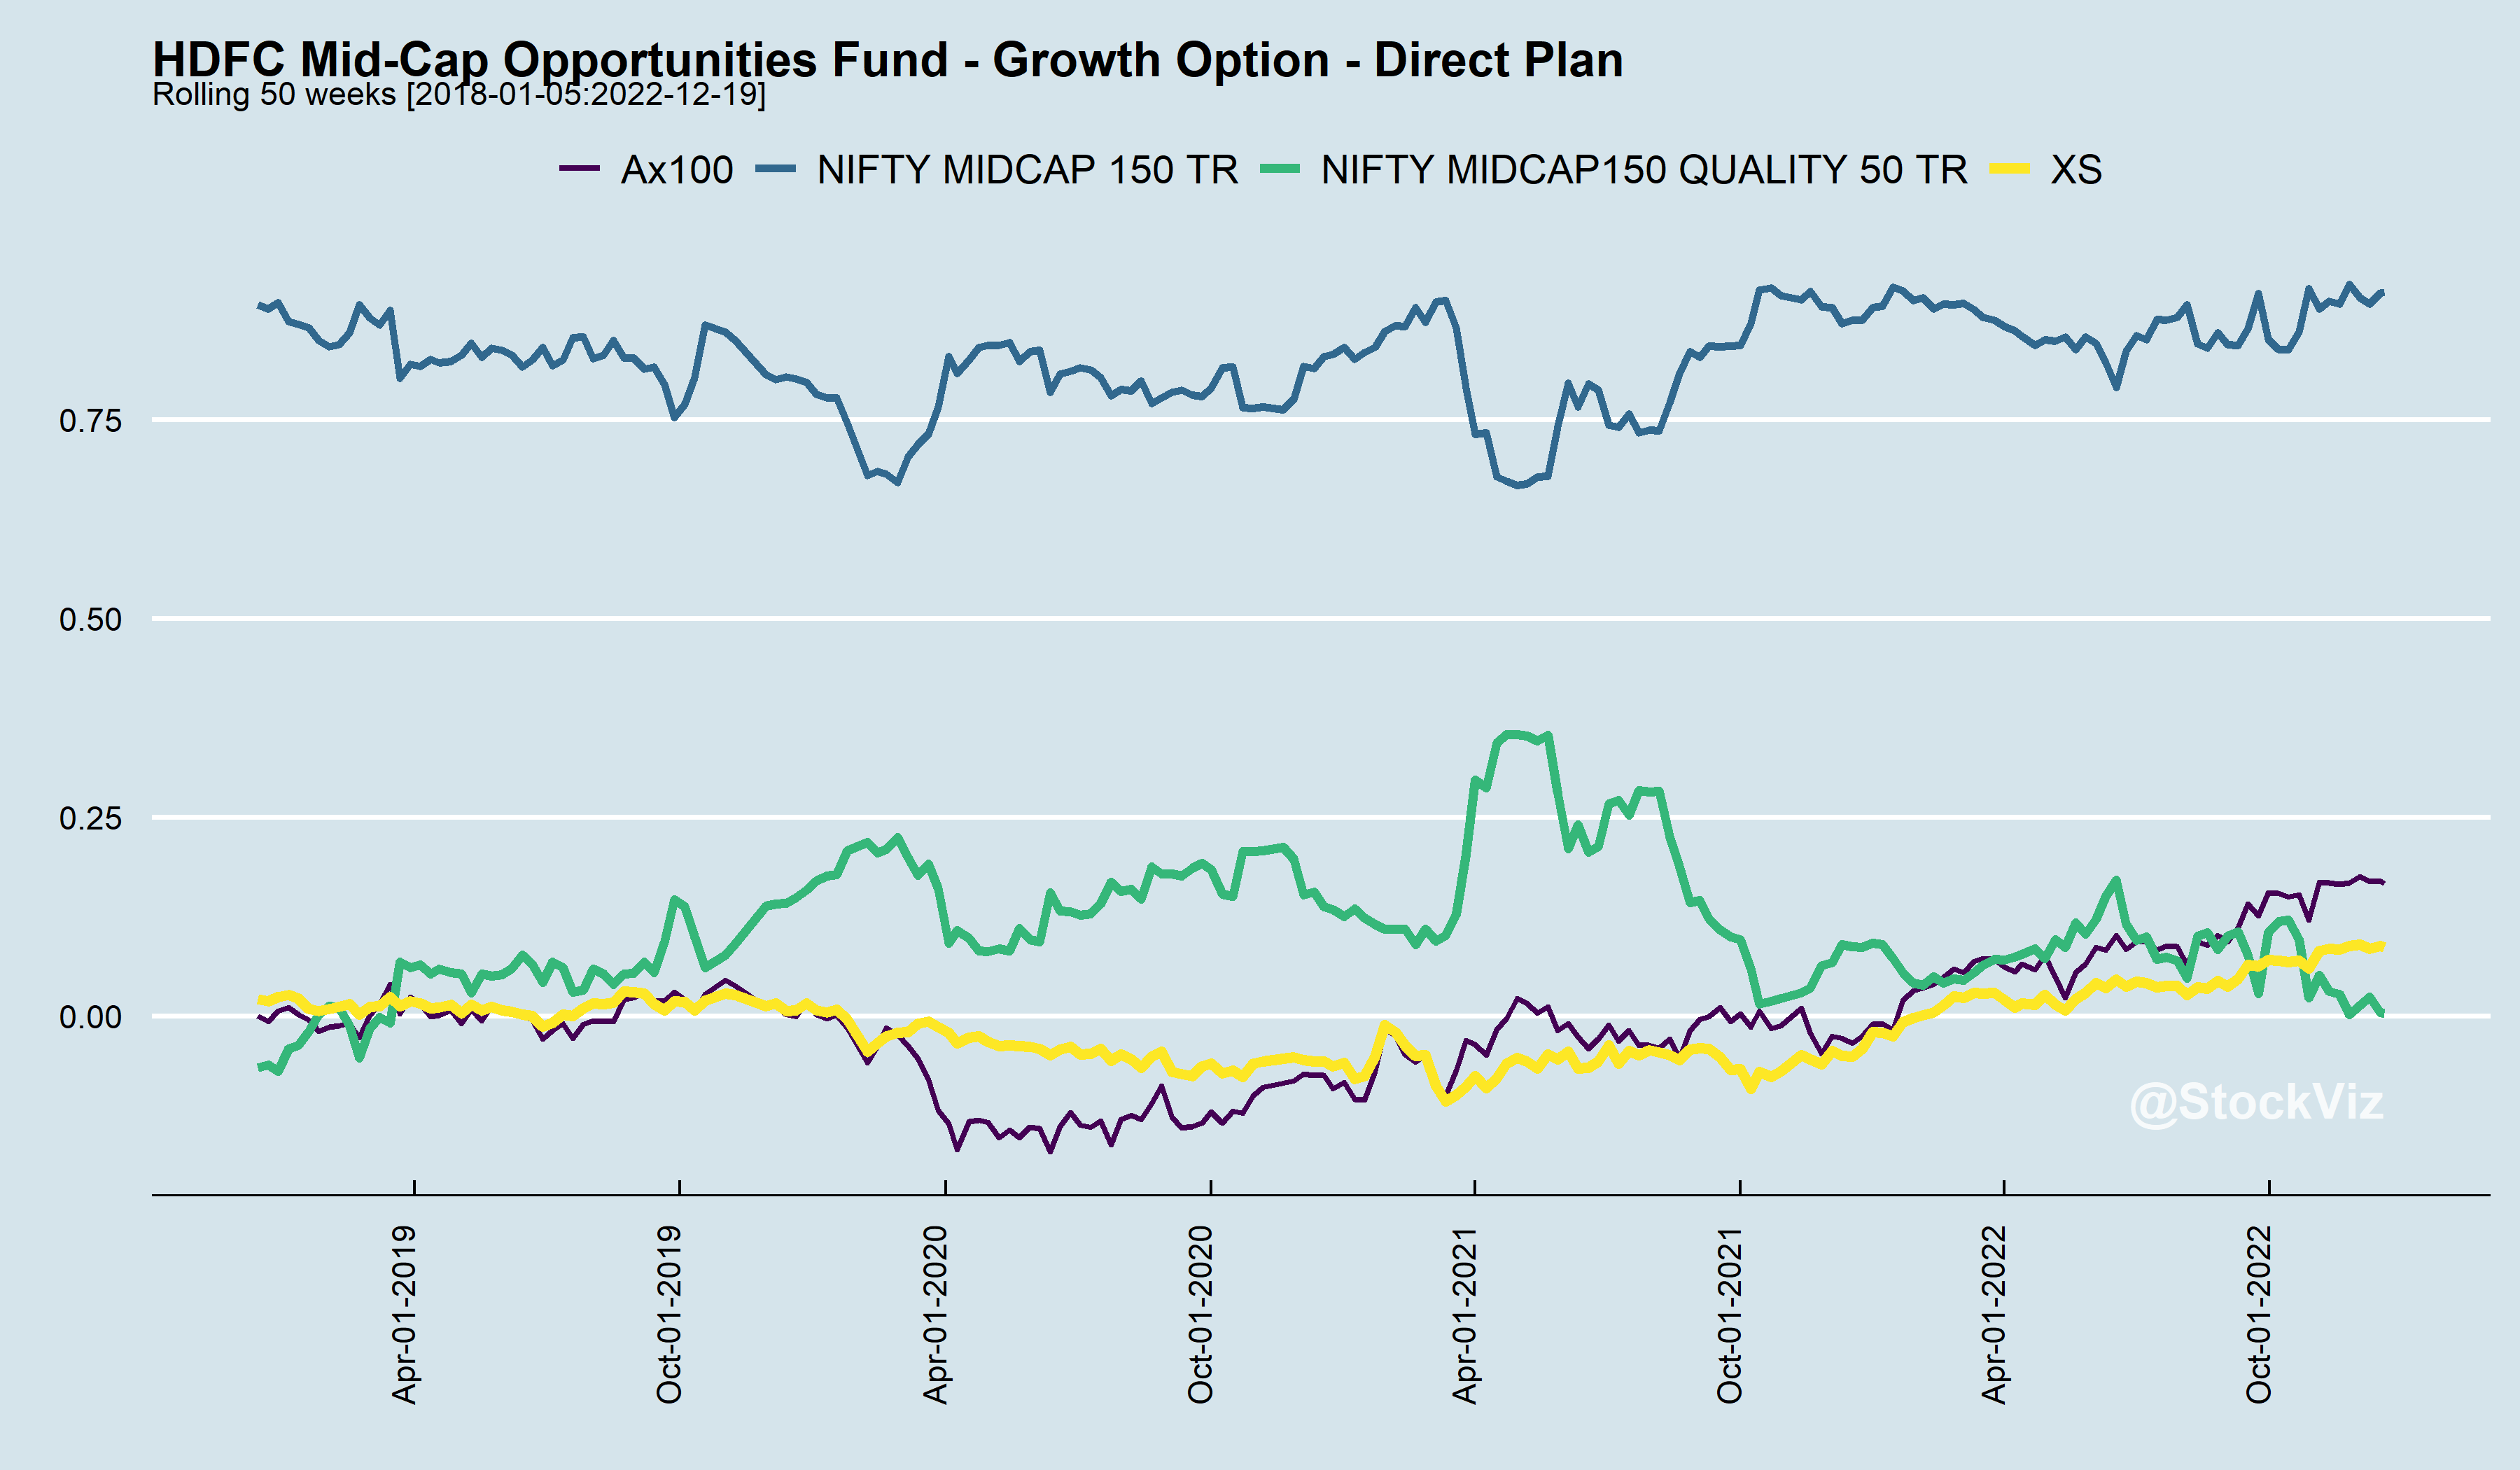
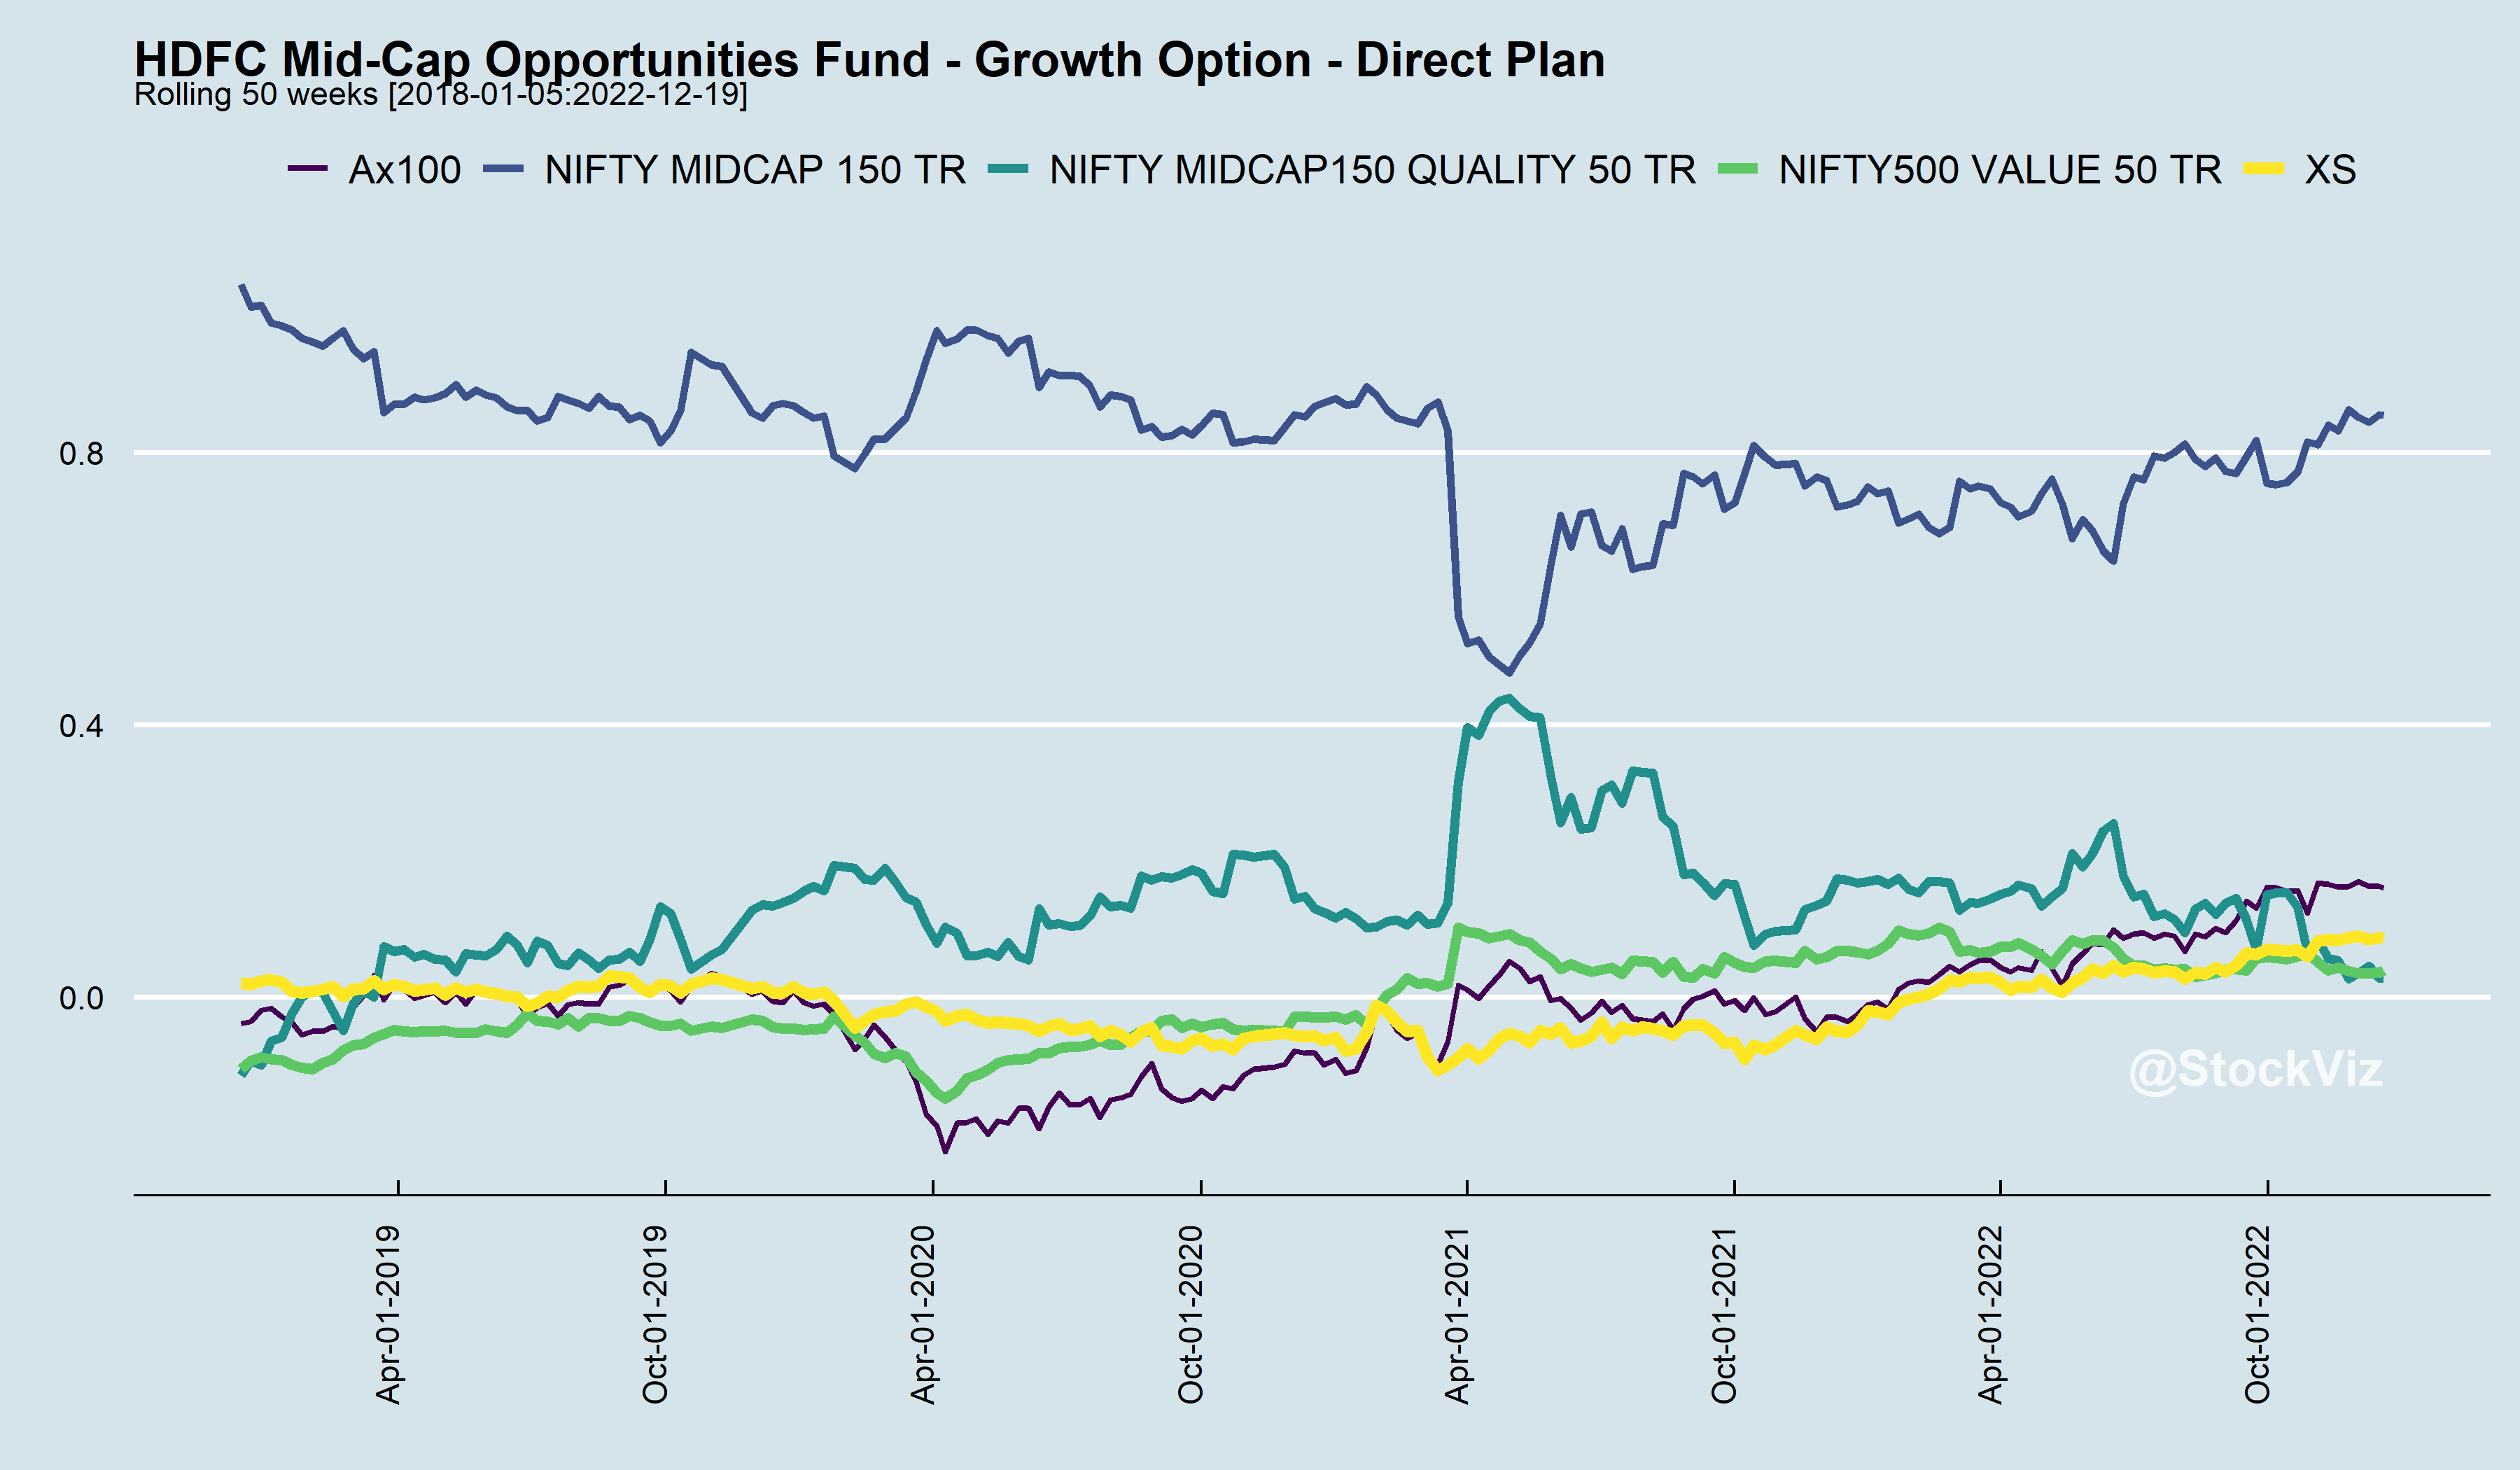
Rolling regressions gives you an idea of portfolio tilts and the fluctuating nature of α (Ax100). Also, its worth noting that α is only tangentially related to excess returns (XS). There are periods here where XS was positive in spite of negative Ax100 and vice versa.
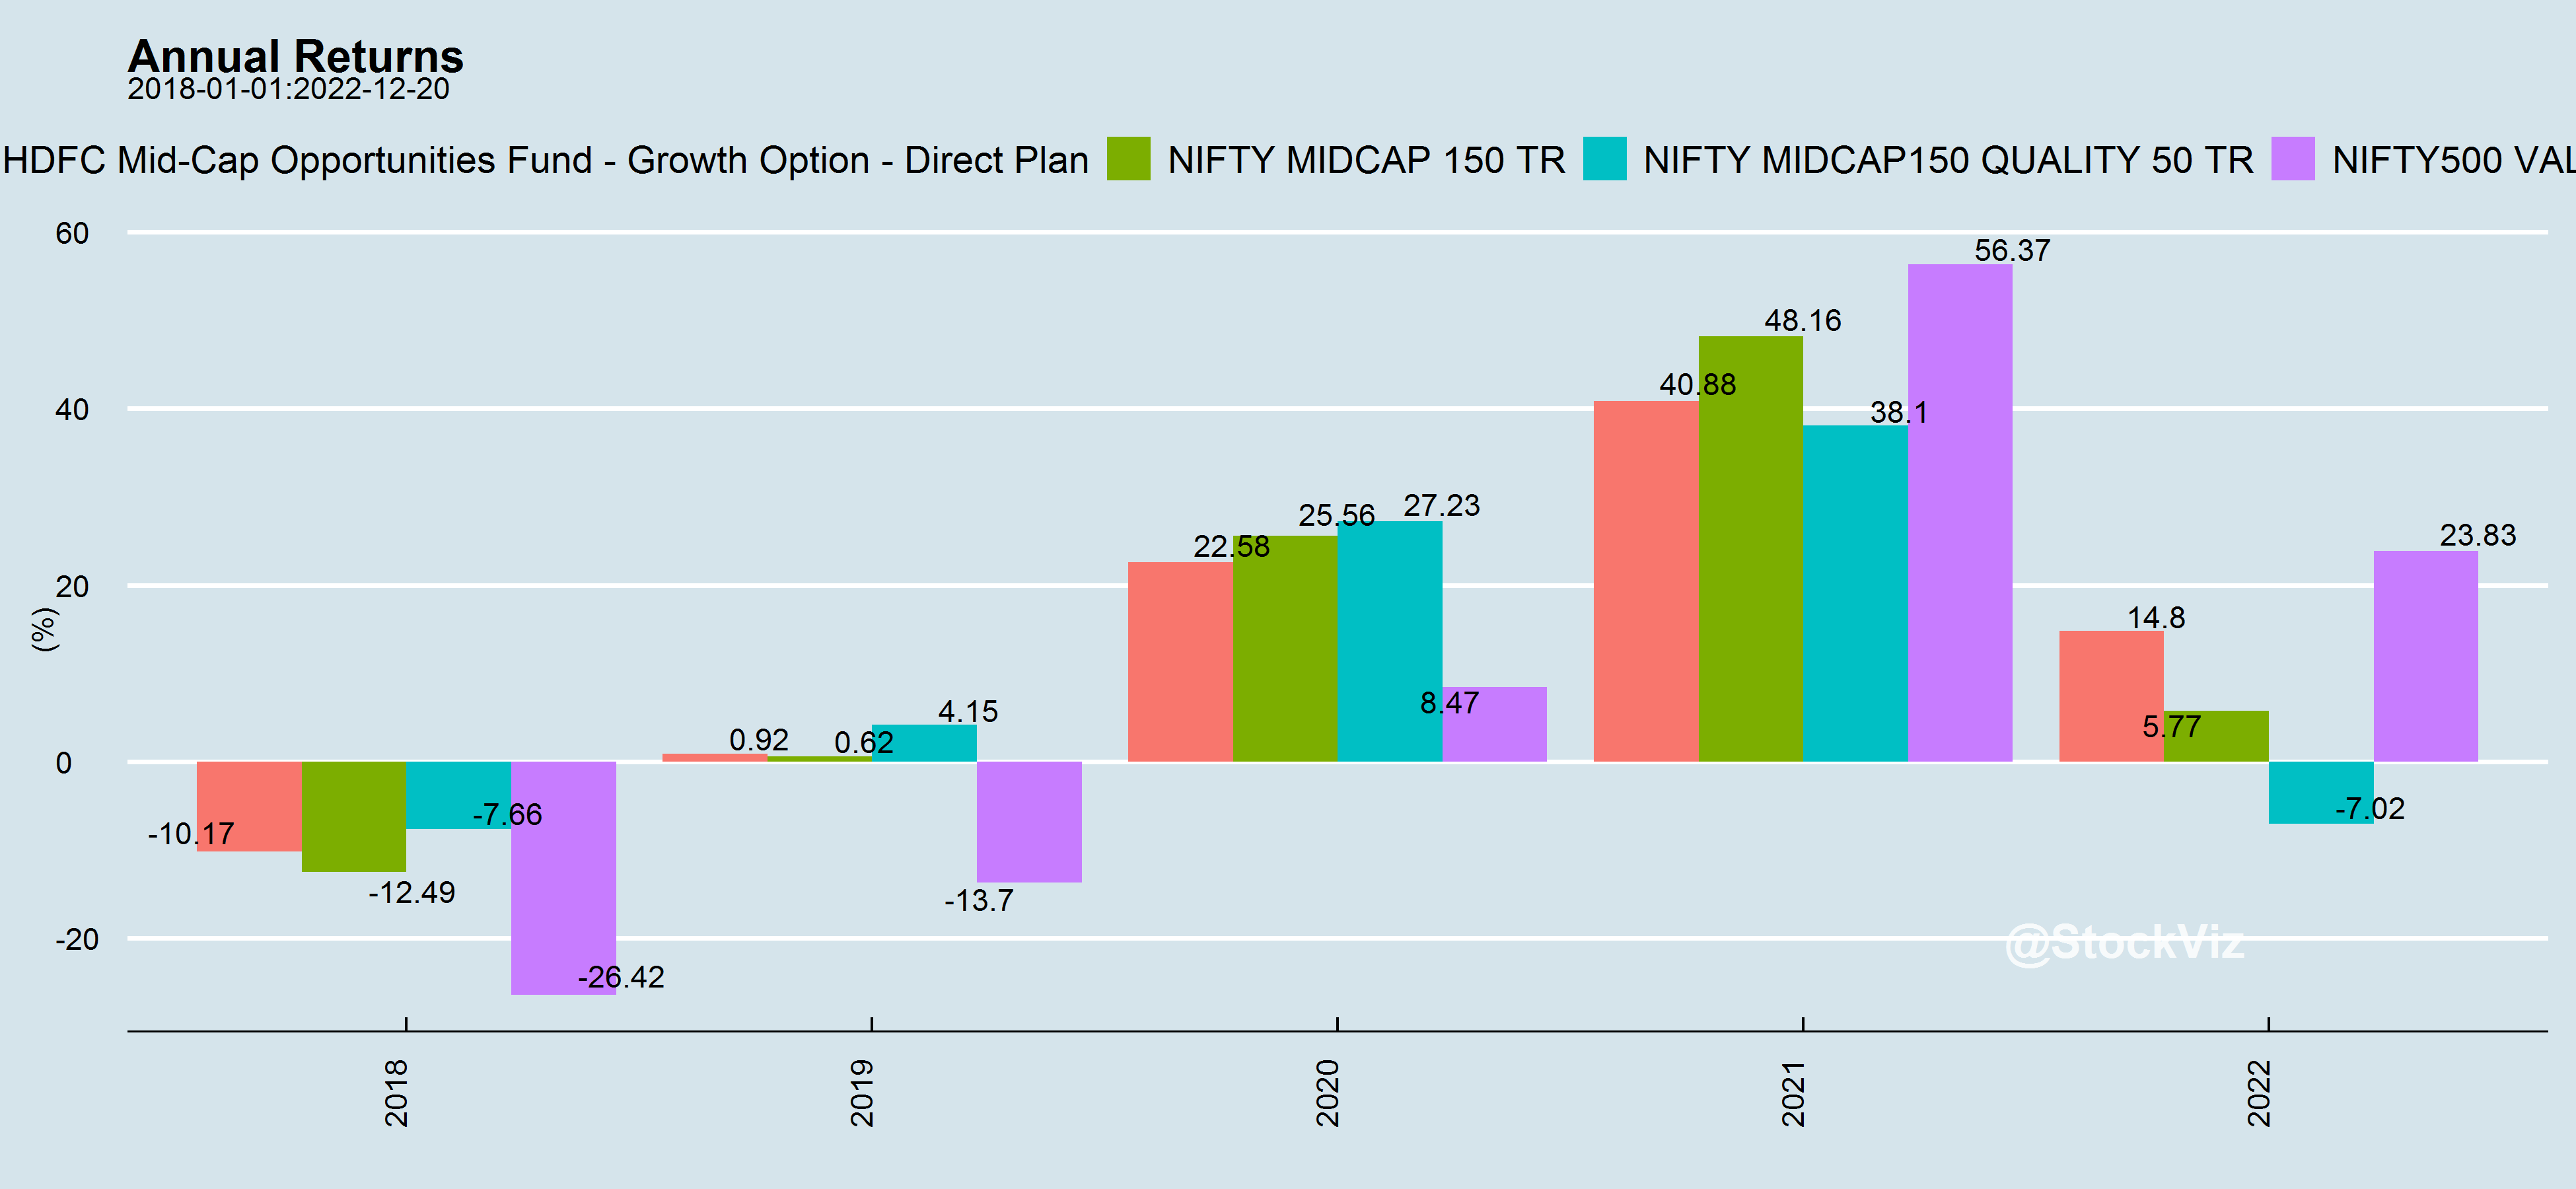
Styles go in-and-out of favor. Sometimes Quality performs better than Value and sometimes a simple cap-weighted index will outperform everything else. An actively managed portfolio’s relative performance to these styles change over time as well.
tl;dr:
- α is a statistical derivation.
- Don’t go chasing α – it keeps fluctuating.
- α is not the same as excess returns.
- When in doubt, index and forget.
- You are always in doubt.
We have setup a script that auto-updates every day with these regressions on select large-cap and mid-cap funds. The report is available here.