There are currently around 40 to 45 single-country ETFs actively trading on US exchanges. Is it possible to construct a momentum portfolio that beats a generic all-world momentum offering using them?
We ran a few scenarios. First, we looked at 50-, 100- and 200-day momentum and then we overlaid the same length of trend over them. Compared to both the market-cap and momentum all-world indices, 200-day Momentum + Trend out-performed.
You could also average out the look-backs to get a parameter-free portfolio without regrets.
With the portfolio being equal weighted, it avoids the geographic and industry concentration problem that plagues most momentum ETFs. Besides, there are no ETFs that track the MSCI ACWI Momentum Index right now. Until such a time, DIY!
Index funds and ETFs proved most naysayers wrong and finally took off post-COVID. Now, we are dealing with a problem of plenty.
The number of indices and index funds have skyrocketed with the vast majority of AUM concentrated in large-cap market-weighted indices.
As everything in investing, it is always better to wait for things to settle down before committing capital. Index post-launch returns tend to disappoint.
And these numbers are worse for index funds.
While investors win by having low-cost access to a wide range of strategies and sectors, they can still lose by rushing in to “hot” launches. Patience pays.
Previously, we had looked at using the momentum of S&P 500 Sector SPDRs for potential rotation strategies. How would the Indian story unfold?
We take 16 sector indices, use a 6-month look-back window and go long the sector with the highest returns, holding it for a month.
You end up with higher returns but lower Sharpe – makes sense given the super-concentrated nature of the portfolio.
The 4 points of out-performance (after costs, pre-tax) over the NIFTY 100 index is not much to write home about. Besides, this strategy trailed the benchmark pre-2020. If this were pitched back then, nobody would’ve deployed it and nobody would’ve been around for the post-2020 out-performance. On a positive note, the availability of index funds and ETFs should make this strategy fairly easy to implement.
The main caveat is that the index construction rules themselves are subject to change. Mid last year, SEBI capped the maximum concentration of a single stock for a sector index at 35% and required them to have at least 10 stocks.
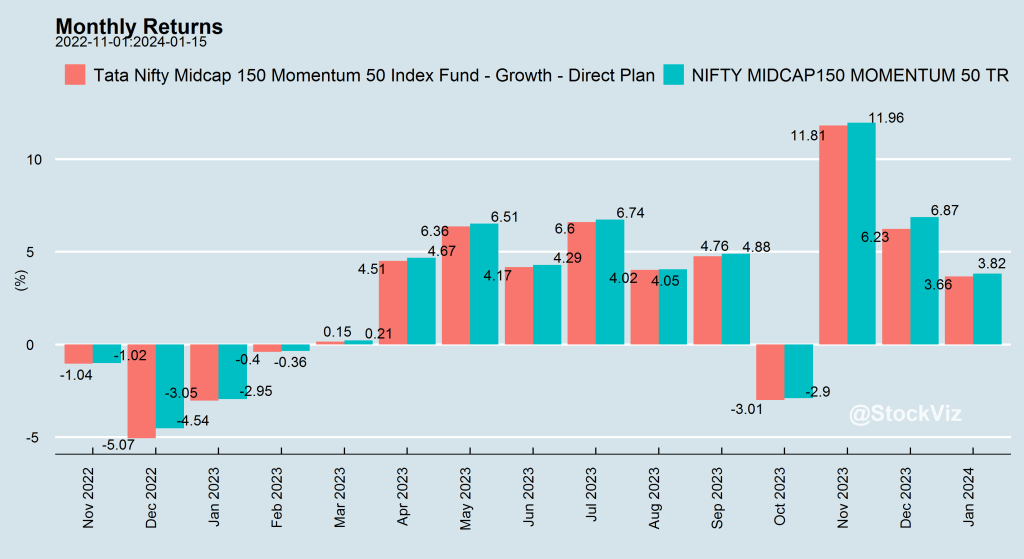
Previously, we had pointed out the wide gulf between ETF closing prices and NAVs. While that continues to exist, the underlying funds themselves don’t track their indices correctly. This tracking difference is the absolute difference between the returns of the fund and the underlying index.
In an ideal world, an index fund or ETF returns should only trail its benchmark by its expense ratio. However, that is not always the case. Some indices are tough to replicate in the actual market due to liquidity issues. Sometimes reference bonds get called away. Proxies don’t exactly replicate the underlying, and so on and so forth.
Thankfully, AMFI (tasked by SEBI) publishes these metrics on their website for all to see.
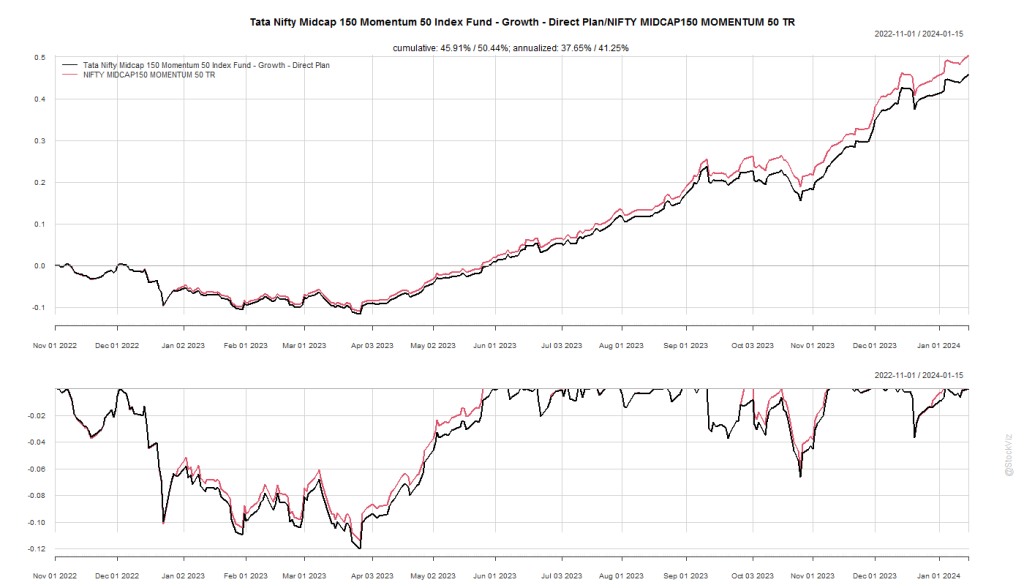
The differences are hard to notice in short-term data…
… but they add up.
Investors should be aware that not all index funds/ETFs and indices are the same and proceed with caution.
We’ve been having a bit of fun with the S&P Sector “Spider” ETFs: Intro, Momentum, Anti-Momentum. We saw how strategies that backtested well with pre-2011 data failed later. In this post, we see if buying all ETFs with a positive return over n-months help us beat the S&P 500 index.
Calculate rolling returns over n months. Where n = 1, 3, 6, 12.
For the n+1th month, go long the ETFs that had positive returns in Step 1.
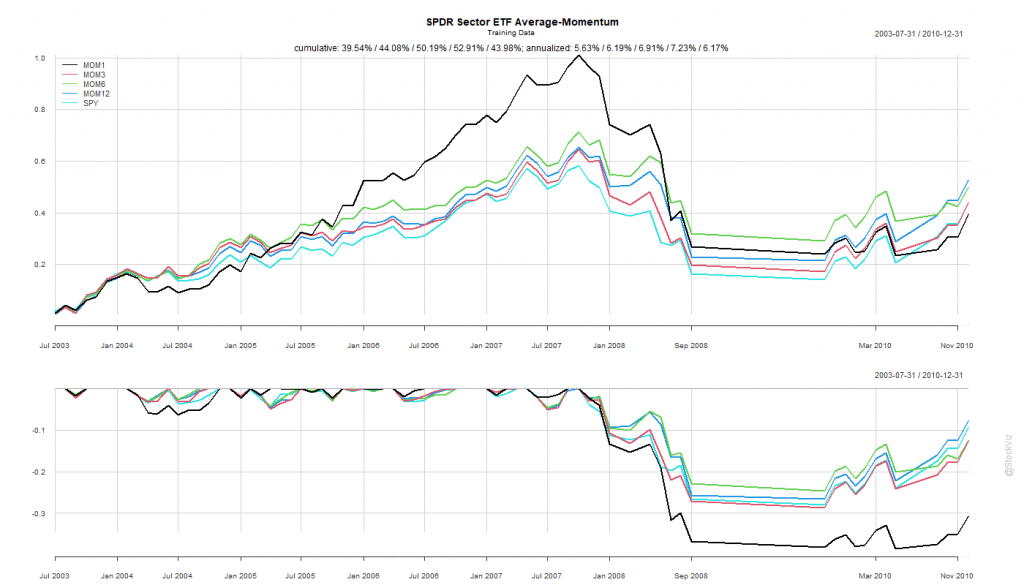
Like before, we split the dataset into Before 2010 and After 2011.
Pick your Fighter
The Before 2010 dataset shows rotation by 6- and 12-month look-back periods to be better than buying-and-holding the S&P 500.
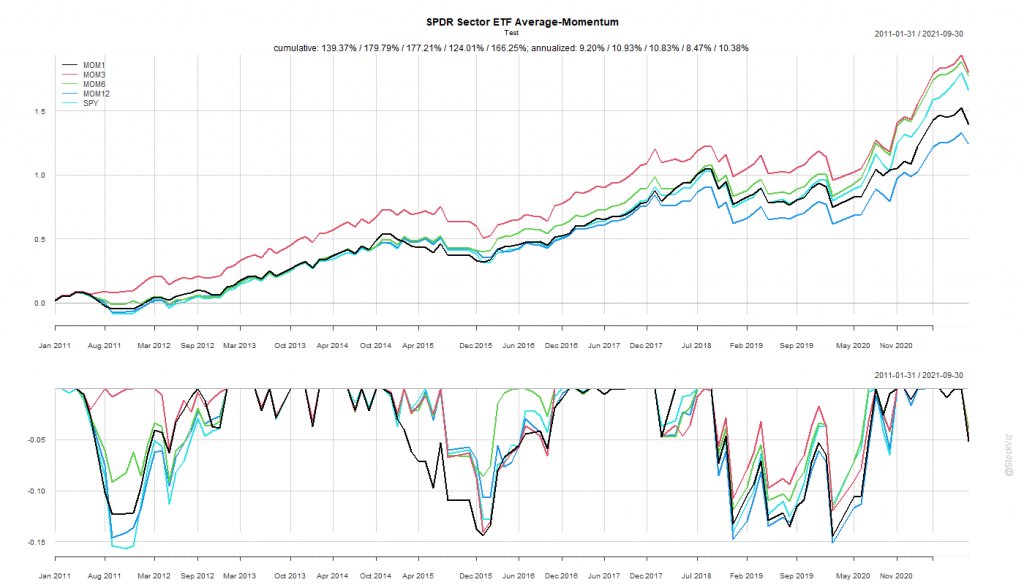
The SPY Rope-a-Dope
MOM6 and MOM12 were too close to call in the training set. If you had “course-corrected” after the first couple of years of under-performance of MOM12 and switched to MOM6, you would’ve out-performed. On the other hand, staying the course would’ve meant losing out to the mighty S&P 500.
Once again, by simply holding onto the ropes, a passive buy-and-hold S&P 500 investor would’ve come out miles ahead of someone who tried to time sectors systematically.
What did we learn?
We tested a few basic allocation strategies that investors typically use to approach the “rotation” problem. Some of them worked well in the training set but their performance failed to carry over. Besides, if you add transaction costs and taxes, we are not sure if it was worth the effort given the post-2011 market regime.
Maybe there are more sophisticated qualitative/fundamental ways to approach this problem that work. However, most media articles about “sector rotation” are written with perfect hindsight and it is near impossible to do it with simple strategies that are accessible to the average investor.