Tag: decile

Fund Portfolios and Market Cap Deciles

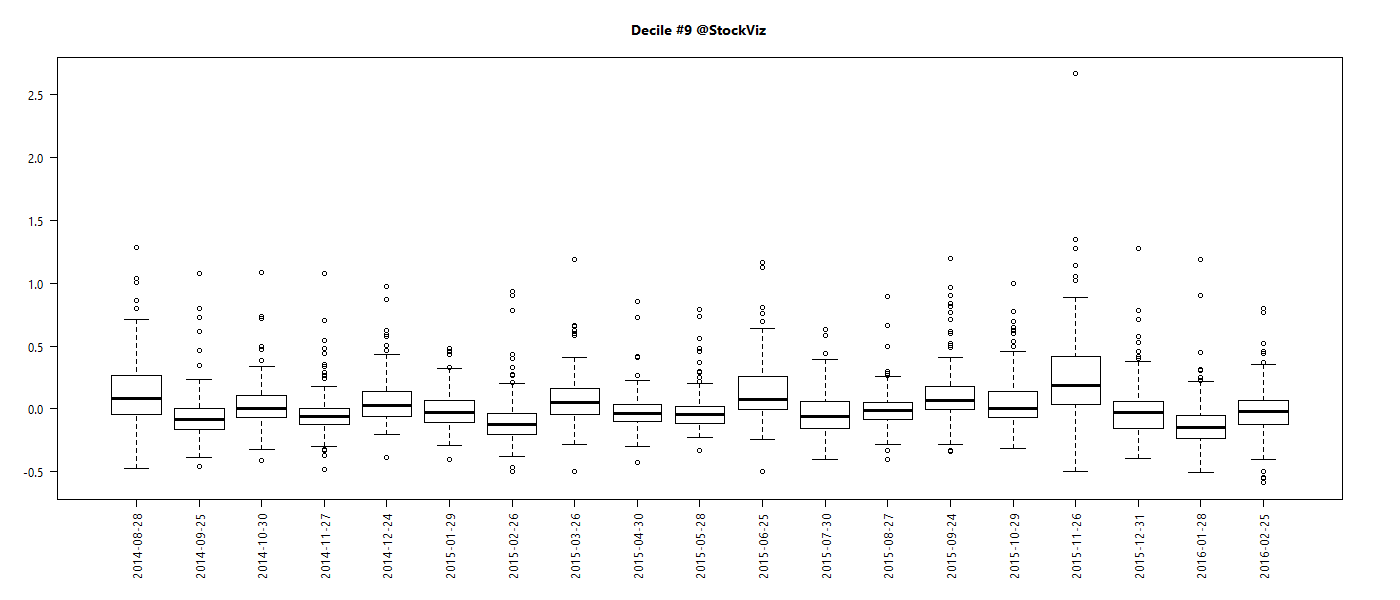
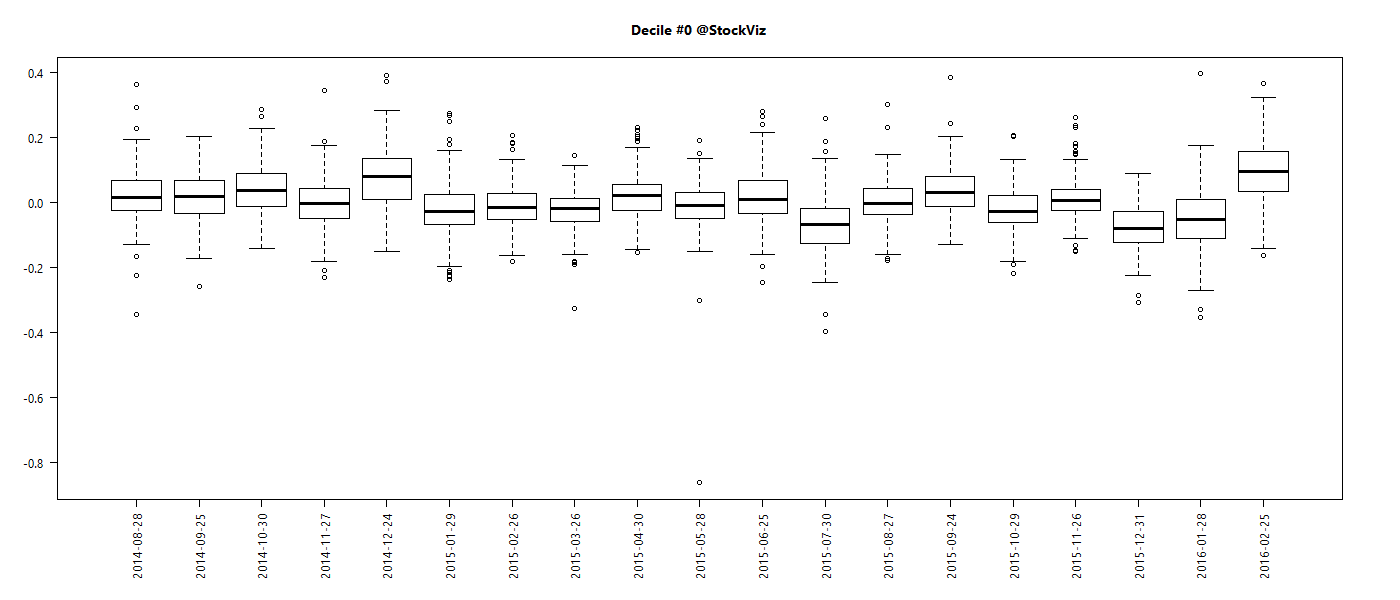
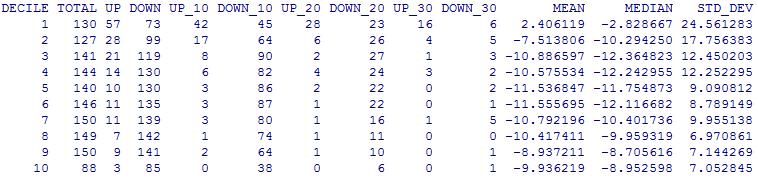
When you sort the universe of stocks in descending order of their free-float market caps and divide them into 10 sets, you end up with StockViz Deciles. If you were to plot the dispersion of market-caps within deciles, here’s how it would look:

market cap deciles

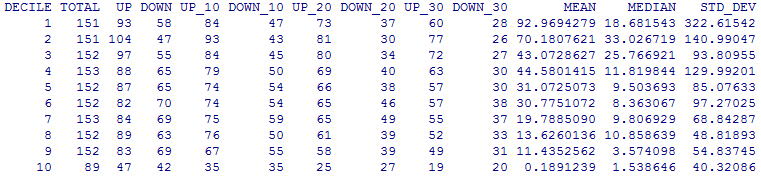
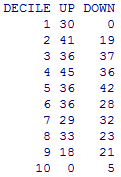
Most of the activity in the markets are in the first 3-4 deciles. Liquidity, as measured by the bid/offer spread, trails off as the float drops:
bid/offer spread by market cap decile

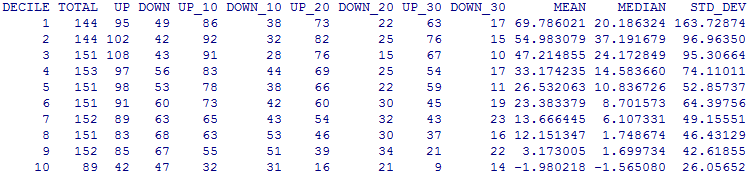
The wide bid/offers presents a scale challenge to small-cap fund managers. The hair-cut to NAV that they will have to take while crossing the spread is just too large. So most small-cap funds pull up:


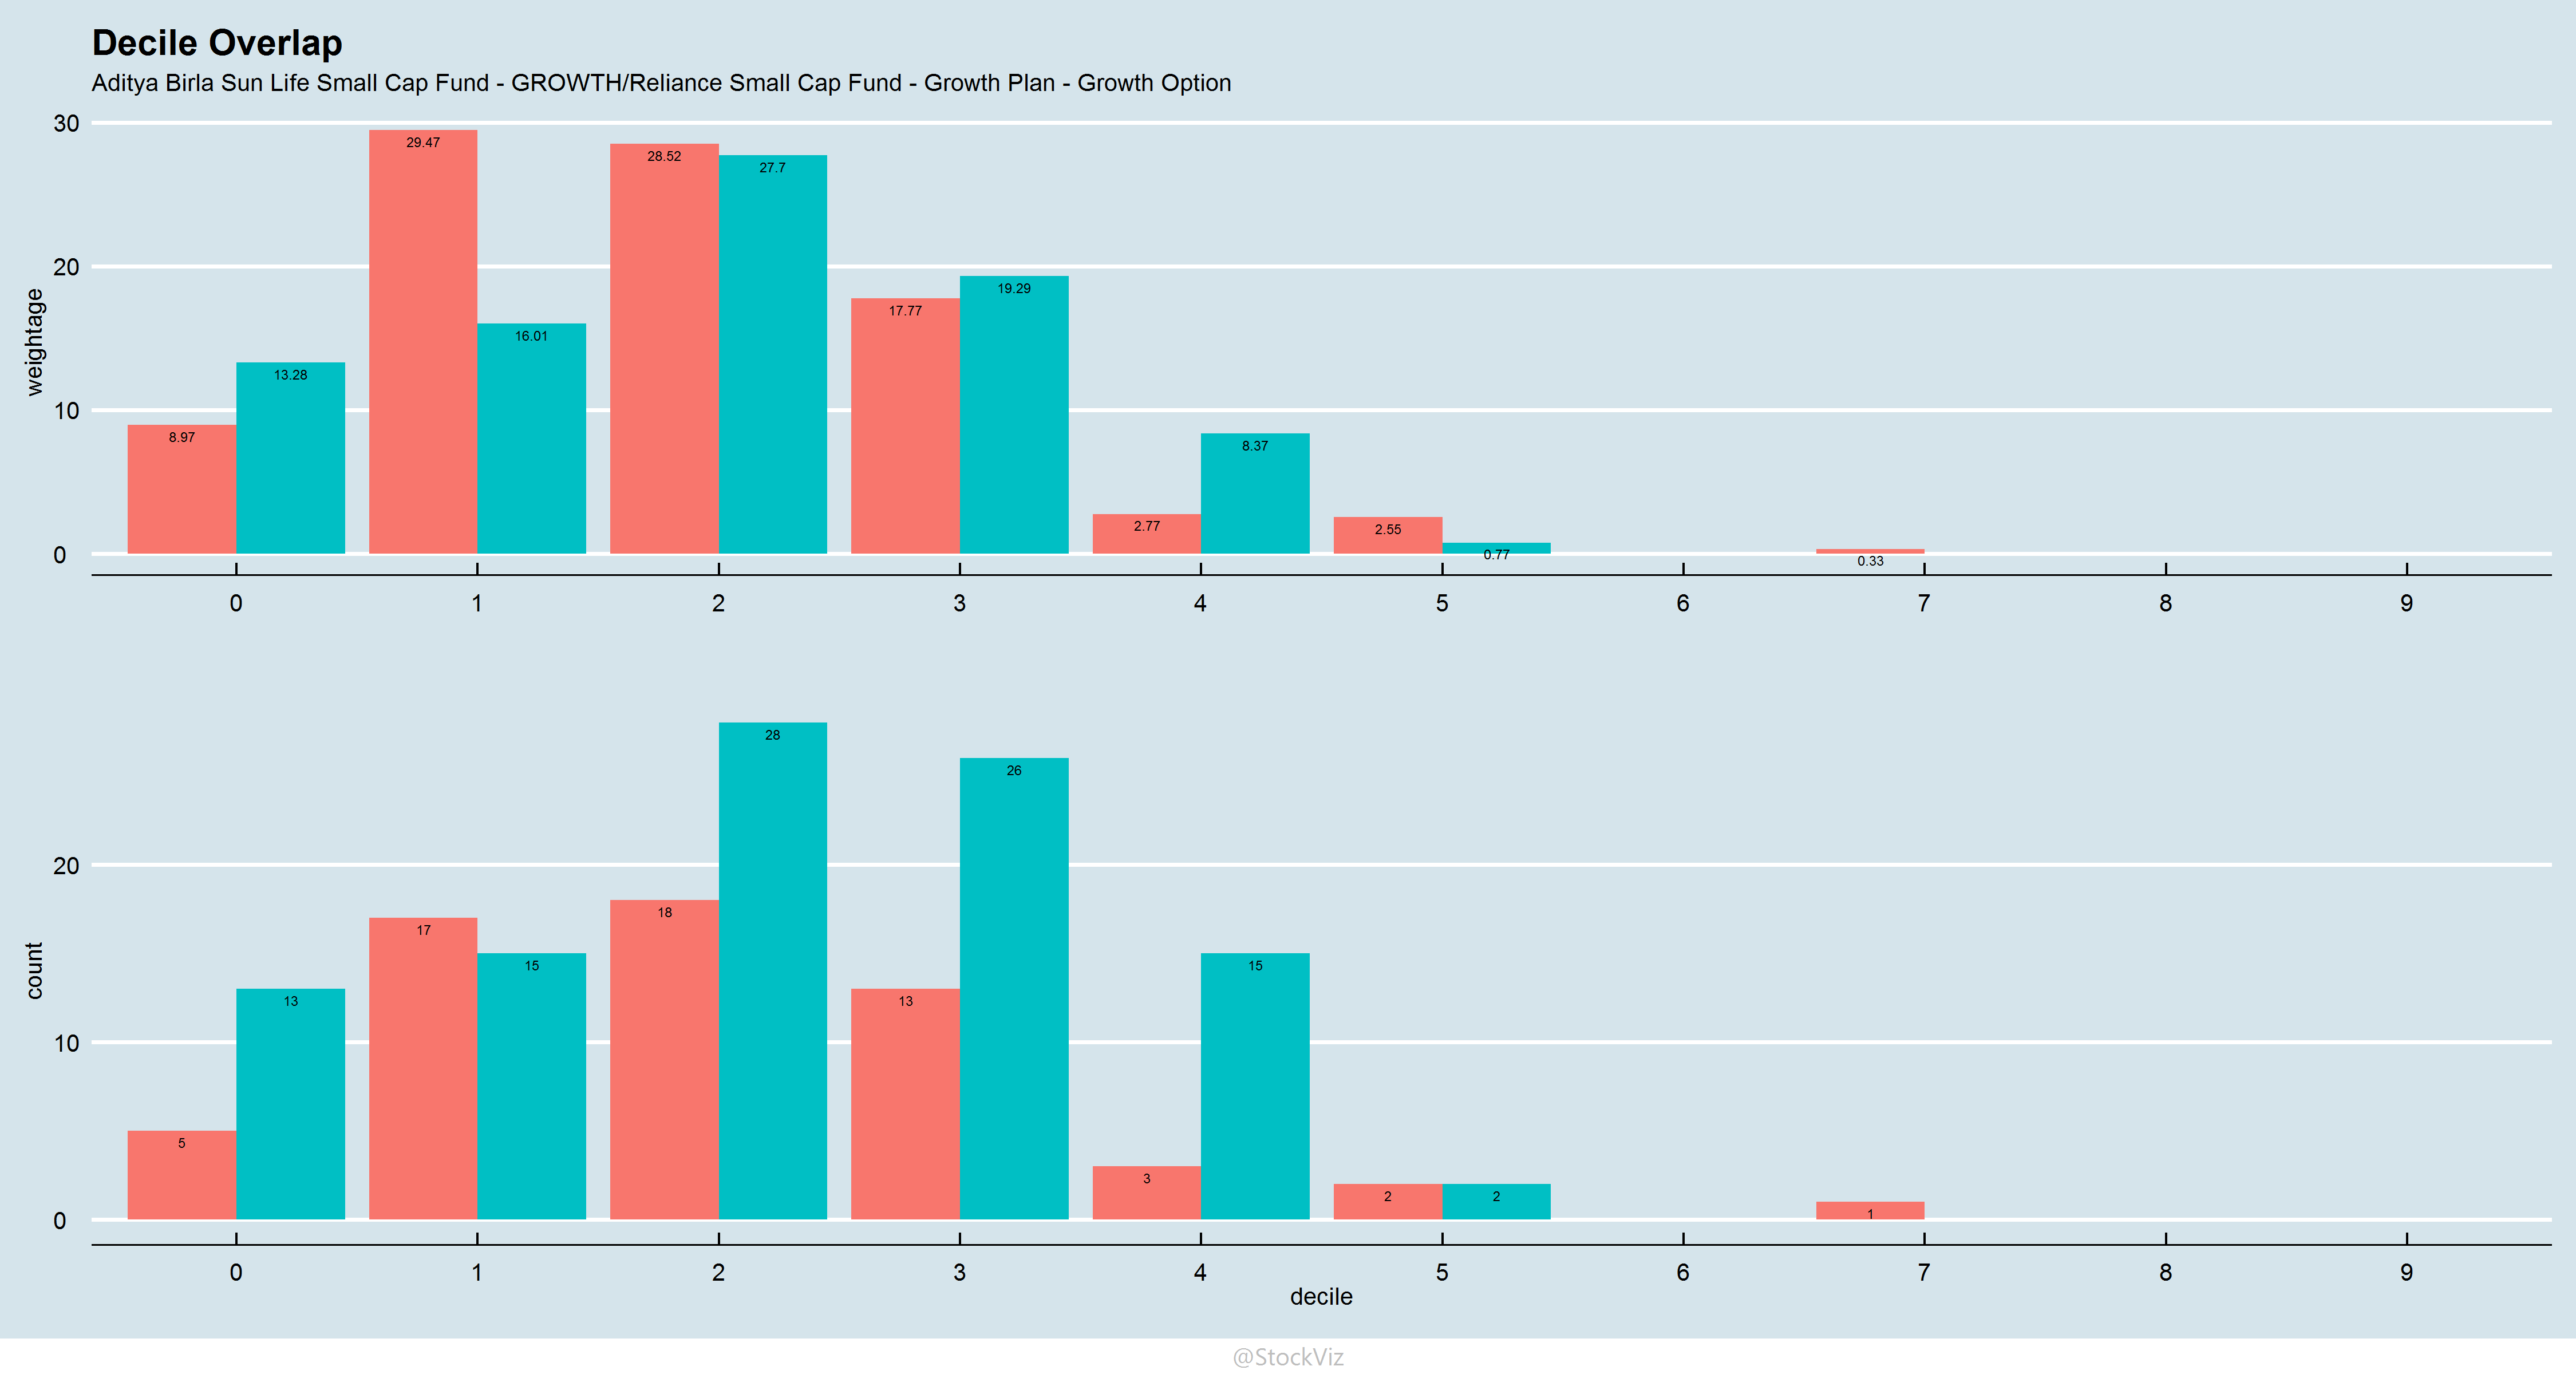
Notice how most of the portfolios is concentrated above the 4th decile. Now, contrast this to the NIFTY SMALLCAP 250 index:
SMALLCAP 250 overlap
If the funds were to stay true to their small-cap moniker, they really shouldn’t be holding decile 0 (mega-cap) stocks. However, holding them seems to be the only way to scale AUM.

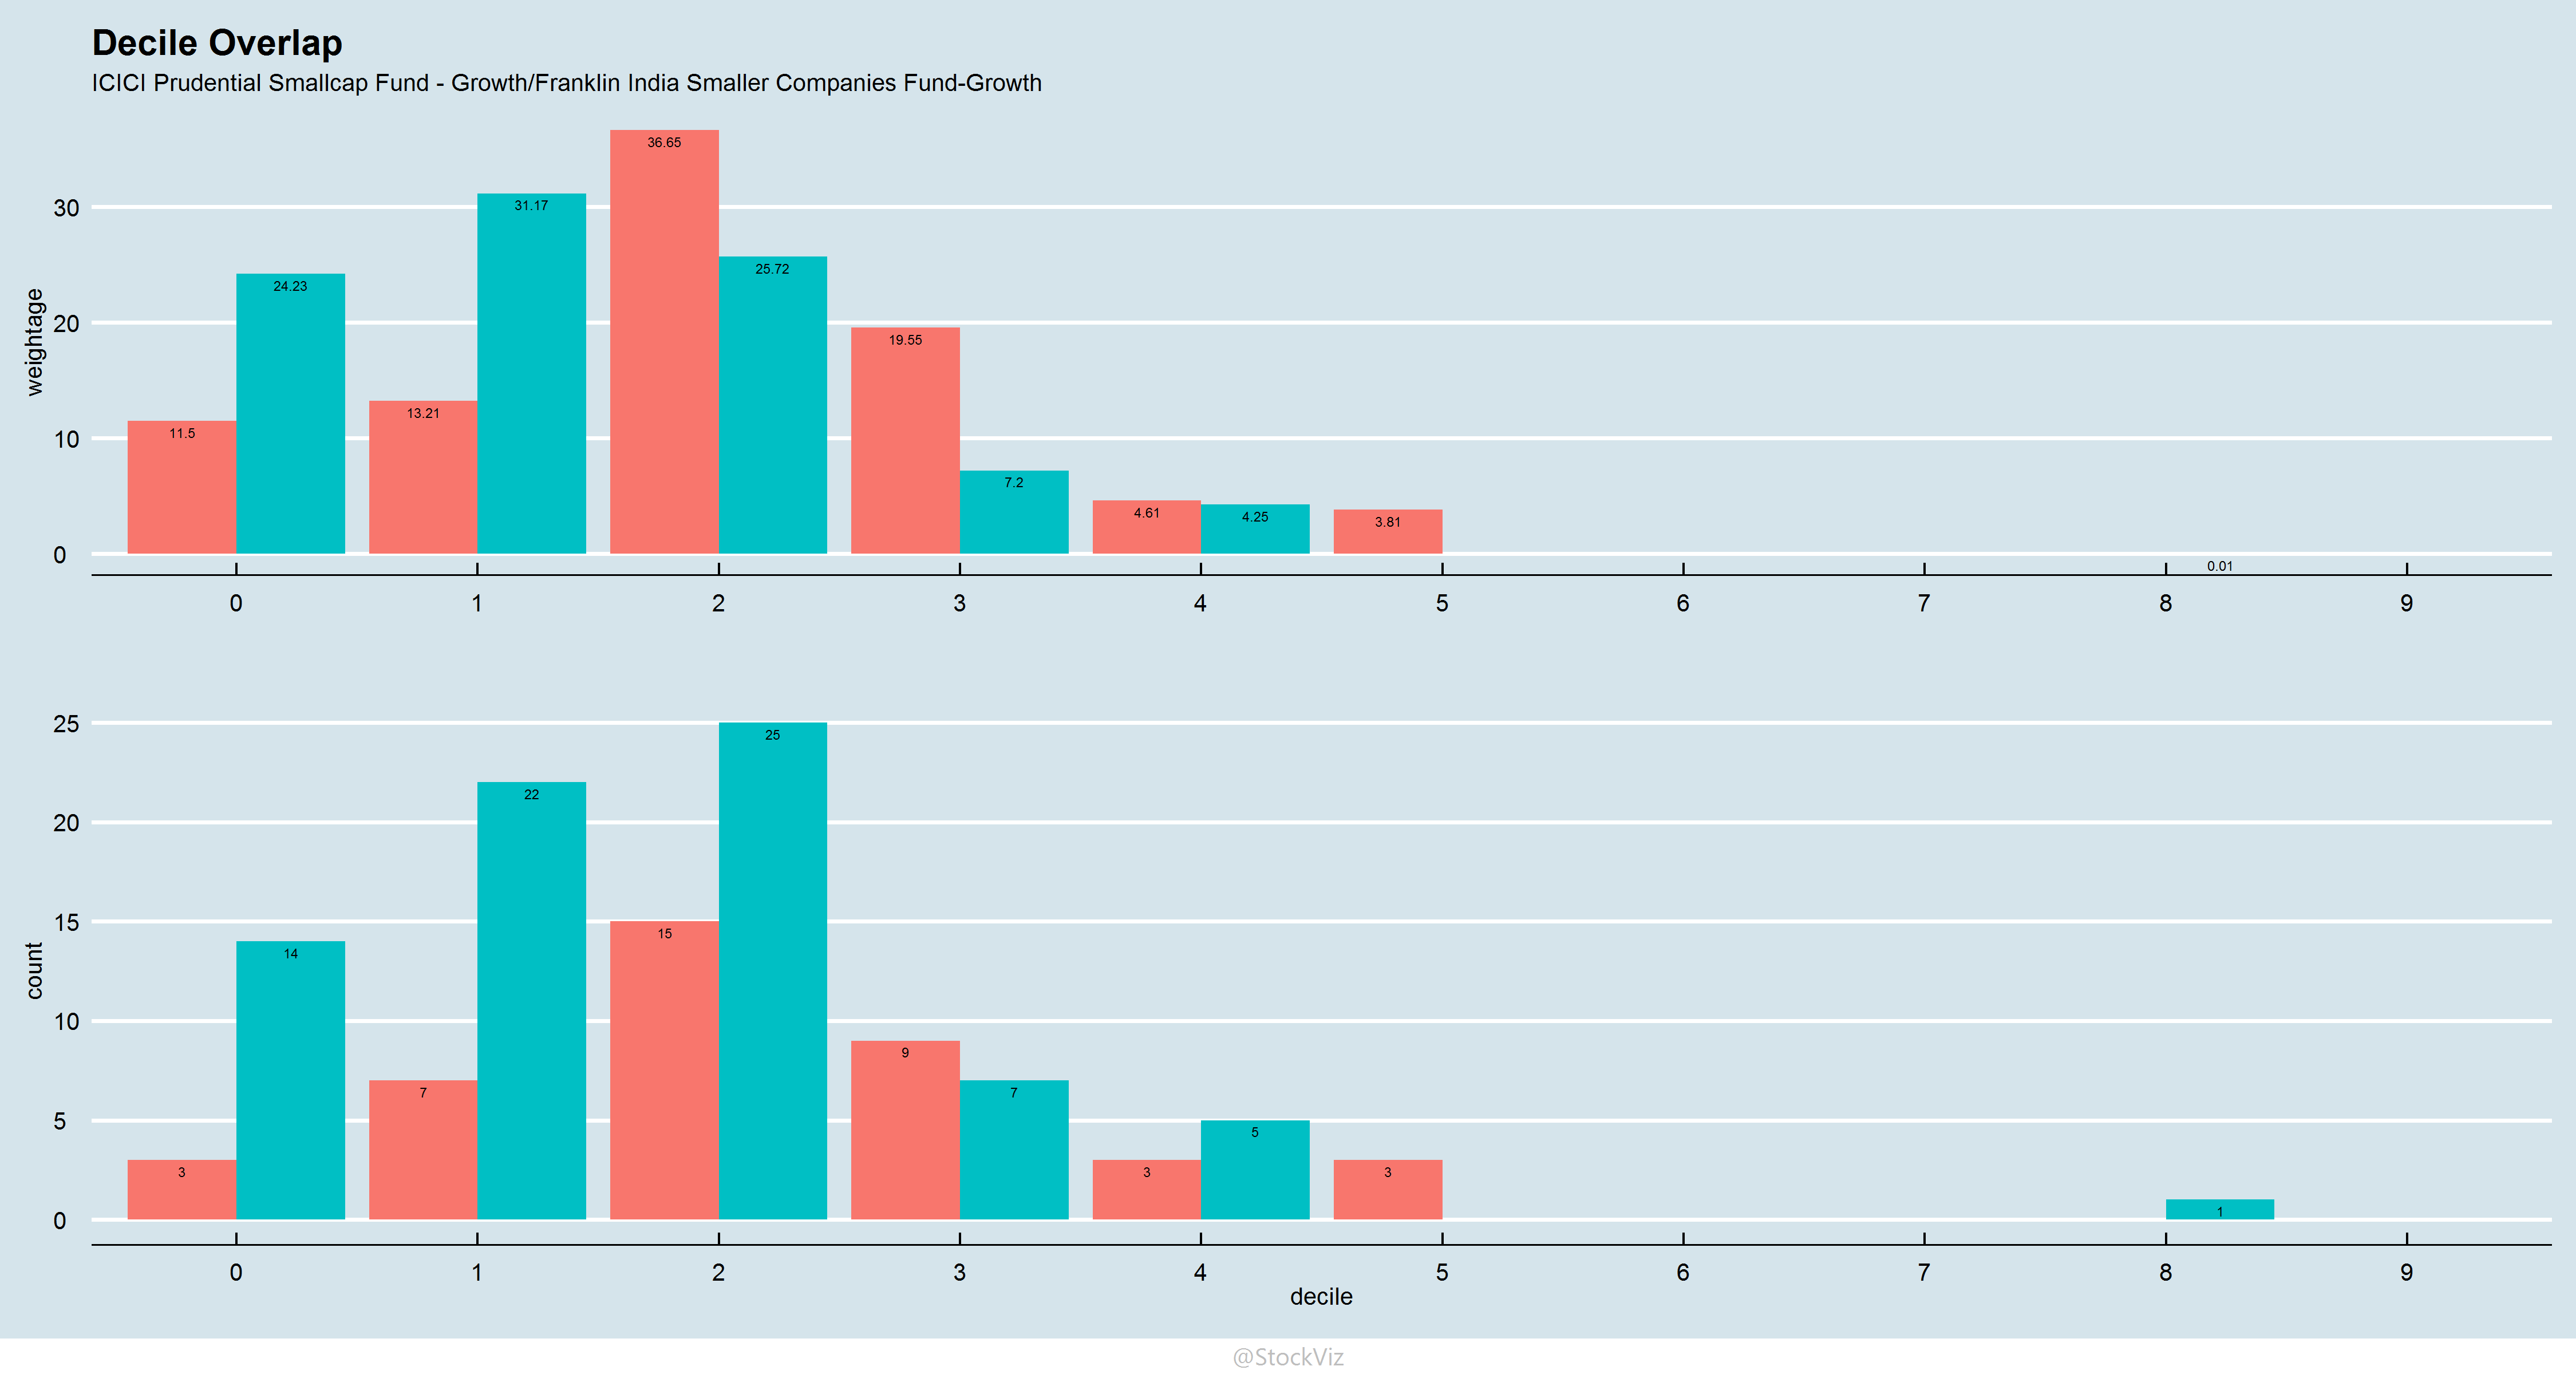
If you care about whether a fund is sticking to its portfolio mandate, give our Overlap Tool a spin.

Market Cap Deciles

Introduction

Quantitative deciling of stocks based purely on market-cap makese sense.
Read: Market Cap Deciles

Exhibits

Some charts and observations on the different deciles.
Read: II and III.

Investing

Investing in deciles through Themes.
Read: Investing in Micro-caps

Mutual fund portfolio

The number and total weightage of stocks in a mutual fund portfolio belonging to different deciles.
Read: Fund Portfolios and Market Cap Deciles
See: Overlap Tool

Investing in Micro-caps

The Size Factor

All things being equal, micro-caps outperform mega-caps in the long-run — investors are compensated for the higher systematic (business cycle) risk that they take when they invest in micro-cap stocks. One way to boost relative performance vs. a market-cap weighted index is to invest in an equal-weighted basket of stocks that are in the index. Alternately, investors can add a basket of micro-cap stocks to their portfolio to juice overall returns.

Market-cap Deciles

We had discussed how we can divide the universe of listed stocks in deciles based on their free-float market cap here. Given our ability to automate systematic investment strategies, we created an auto-rebalanced Theme each for every decile.

Investors can now gain exposure to an equal-weight portfolio of micro caps by investing in the Decile 9 Theme and mega-caps by investing in the Decile 0 Theme. Returns and risk go down as you climb up the market-cap ladder. Our Market Dashboard gives an idea of how returns have been distributed across the deciles:

decile returns

Notice how the drawdowns are deeper with micro-caps:
decile drawdown

Investors who whethered the steeper drawdowns of micro-caps have experienced returns an order of magnitude larger than mega-cap investors. Check out the ‘Size Factor’ in our Investment Themes page for other Market-cap based Themes.

Market-Cap Deciles, Part III

Part I, Part II of the series.

111% vs. 11%

A portfolio of ~150, equal-weight, small-cap stocks, rebalanced monthly, gave a return of 111% from 2015 through now.

decile.9.2016-04-24

While a similar portfolio of mega-cap stocks gave a return of 11% during the same time frame.

decile.0.2016-04-24

Variance

Returns from the small-cap portfolio are accompanied by larger volatility.

decile.distribution.9.2016-04-24

decile.distribution.0.2016-04-24

Accessibility

Is the alpha accessible? Given the meager volumes in the small-cap space, narrow circuit breakers and intra-day volatility of prices, small-cap alpha is hard to access. The impact cost of trading 150 small-cap stocks every month would be pretty high for large positions.

However, a portfolio with an exposure of Rs. 10,000 – Rs. 50,000 per stock is doable. So, theoretically, you can size the portfolio between Rs. 15,00,000 – Rs. 75,00,000 to access this alpha.

Appendix

Cumulative wealth charts for each decile (both cap- and equal-weighted): (a)

Box plots of cumulative returns of stocks in each decile: (b)

Market-Cap Deciles, Part II

We had introduced the concept of dividing the universe of stocks by market-cap deciles a while ago (StockViz.) Here are some observations.

Returns

The last year has been spectacular for small- and mid-cap stocks.

From August-2014 to Now:
decile all

For 2015:
decile 2015

So far in 2016:
decile 2016-JAN
Note: Deciles go from 1 (micro-cap) to 10 (mega-cap)

In 2015:

  1. If you had blindly invested in an equal-weight portfolio of ~145 micro-cap stocks, you would have been up ~70%
  2. Every other decile out-performed the mega-caps (decile #1)
  3. Note how the standard-deviation of returns compress as you walk up the cap

Migrations

migrations 2015
Free-float market-cap is a volatile measure in itself – when you use that to classify stocks, you end up with quite a bit of movement between deciles. Something to keep in mind while using deciles for analysis.

Market breadth indicator

The mega-cap decile (decile #1) can be used as a crude market-timing indicator. If you track the number of stocks in the decile that went up vs. the number that went down, you end up with a proxy for breadth.

long-short-nifty

Even though technically it beat the buy-and-hold NIFTY 50, the indicator produces too many trades and it doesn’t offer a large enough margin of out-performance to be useful in live trading.

Next steps

We will continue to poke around and share what we find!