Tag: volatility

INDA vs. SPY Observed Volatility

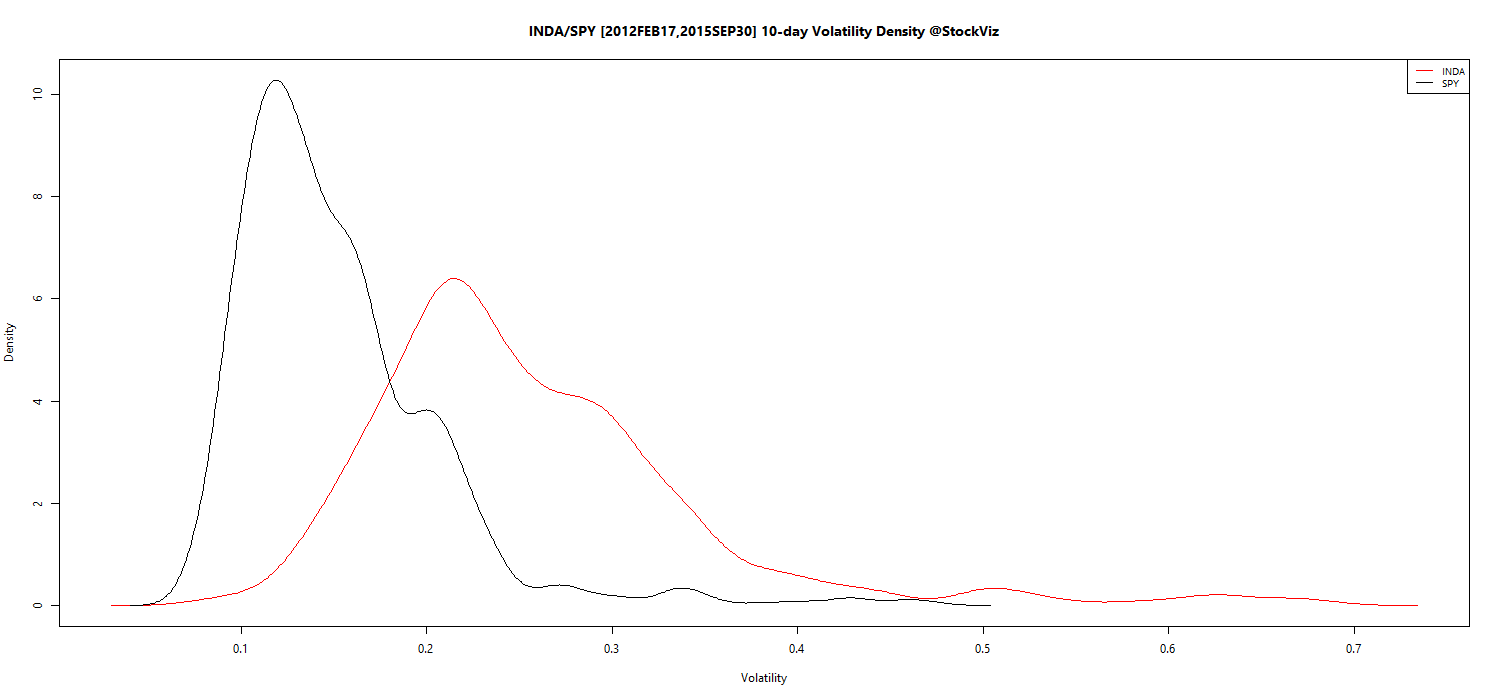
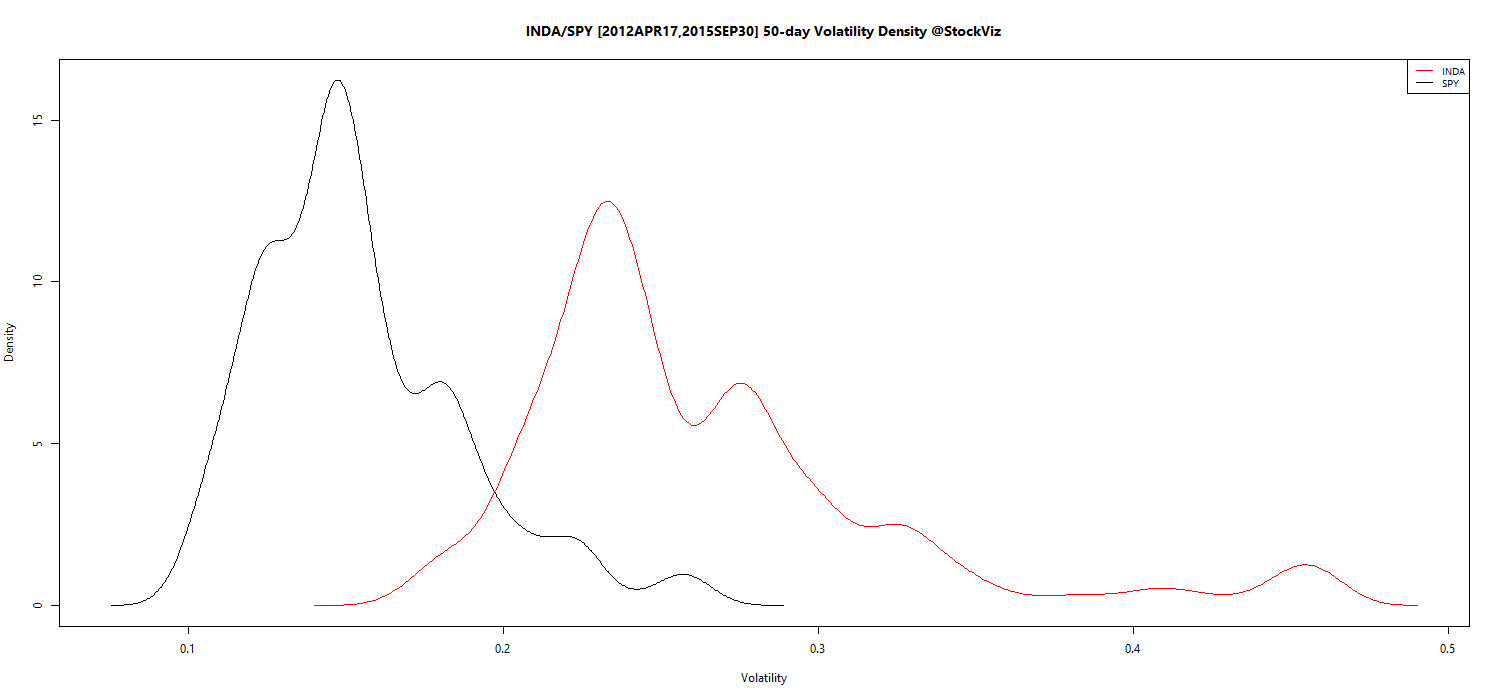
The iShares MSCI India ETF (INDA) tracks the MSCI India Total Return Index, representing about 85% of the Indian stock market. As a follow up to our earlier post on the historical volatility of the NIFTY historical NIFTY volatility, we thought we’ll compare the volatilities of INDA and SPY, the S&P 500 ETF.

10-day volatility:
INDA.SPY.volatility.density.10

50-day volatility:
INDA.SPY.volatility.density.50

As expected, a dollar denominated emerging market ETF is more volatile than the S&P. File this away in your brain attic.

NIFTY Volatility, Historical Perspective

Was 2014 an anomaly?

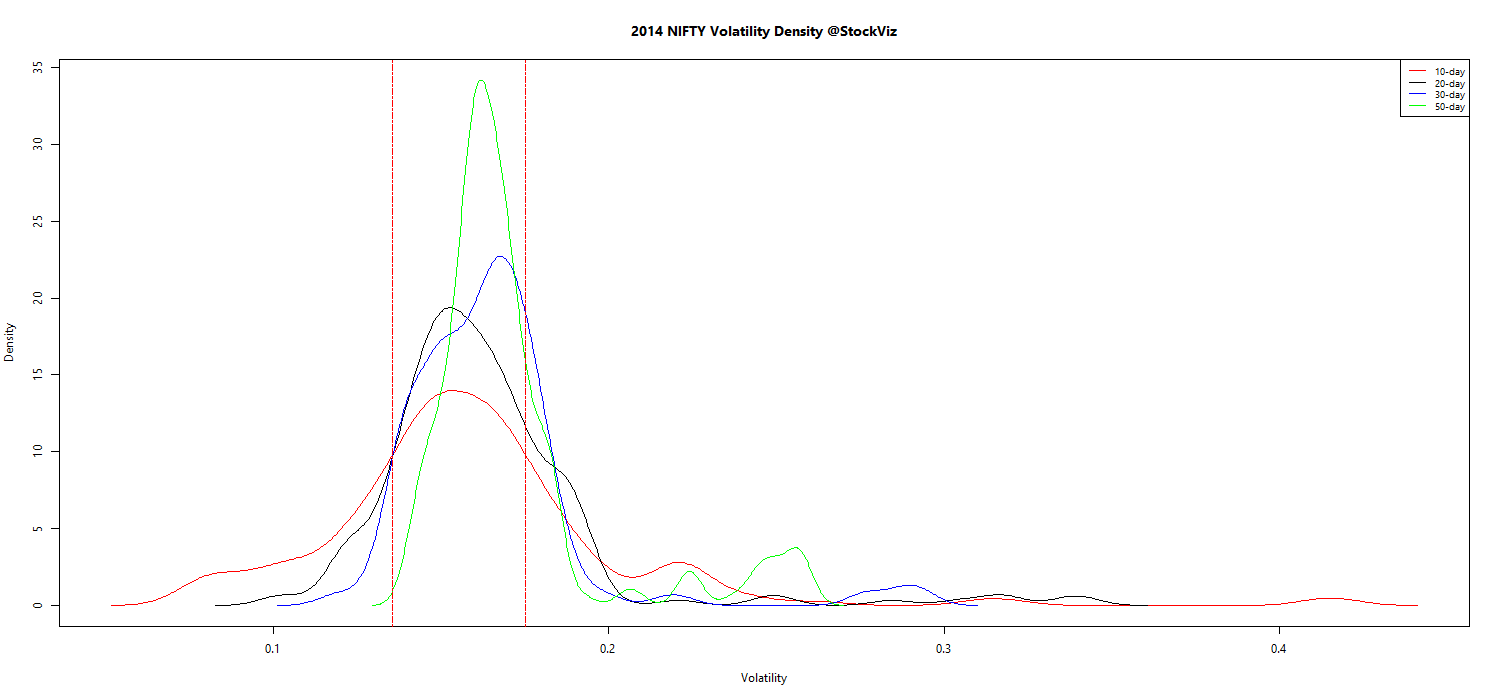
Here’s a density plot of NIFTY volatility across 10-, 20-, 30-, and 50-day periods:

NIFTY.volatility.density.2014

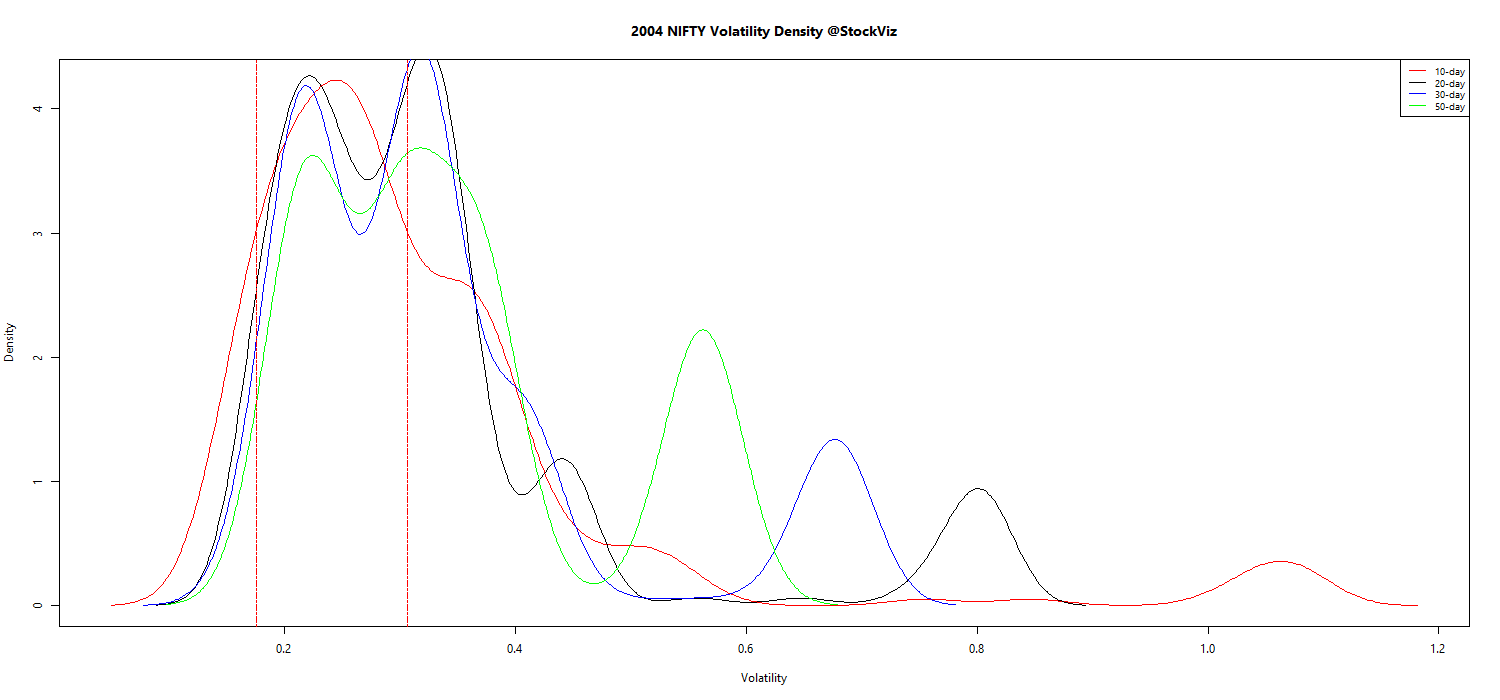
And here’s how it was in 2004 (10-years ago):

NIFTY.volatility.density.2004

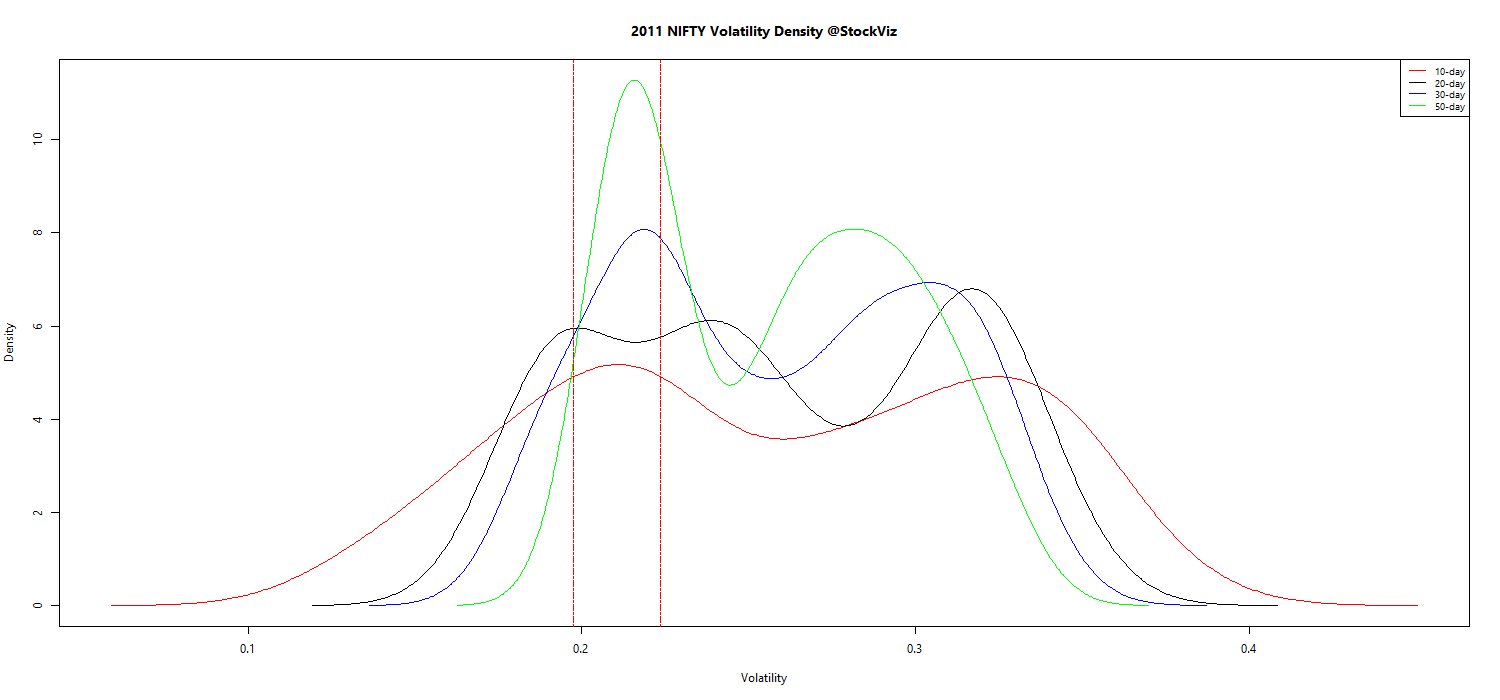
For those of who argue that the introduction of the pre-open auction call in 2010Gaps and the Pre-Open Call Auction skews these results, here’s how 2011 looked like:

NIFTY.volatility.density.2011

The unprecedented absence of a second “hump” in the volatility density plot for 2014 should give pause to investors looking for a repeat of 2014 anytime soon.

Reversion to higher volatility?

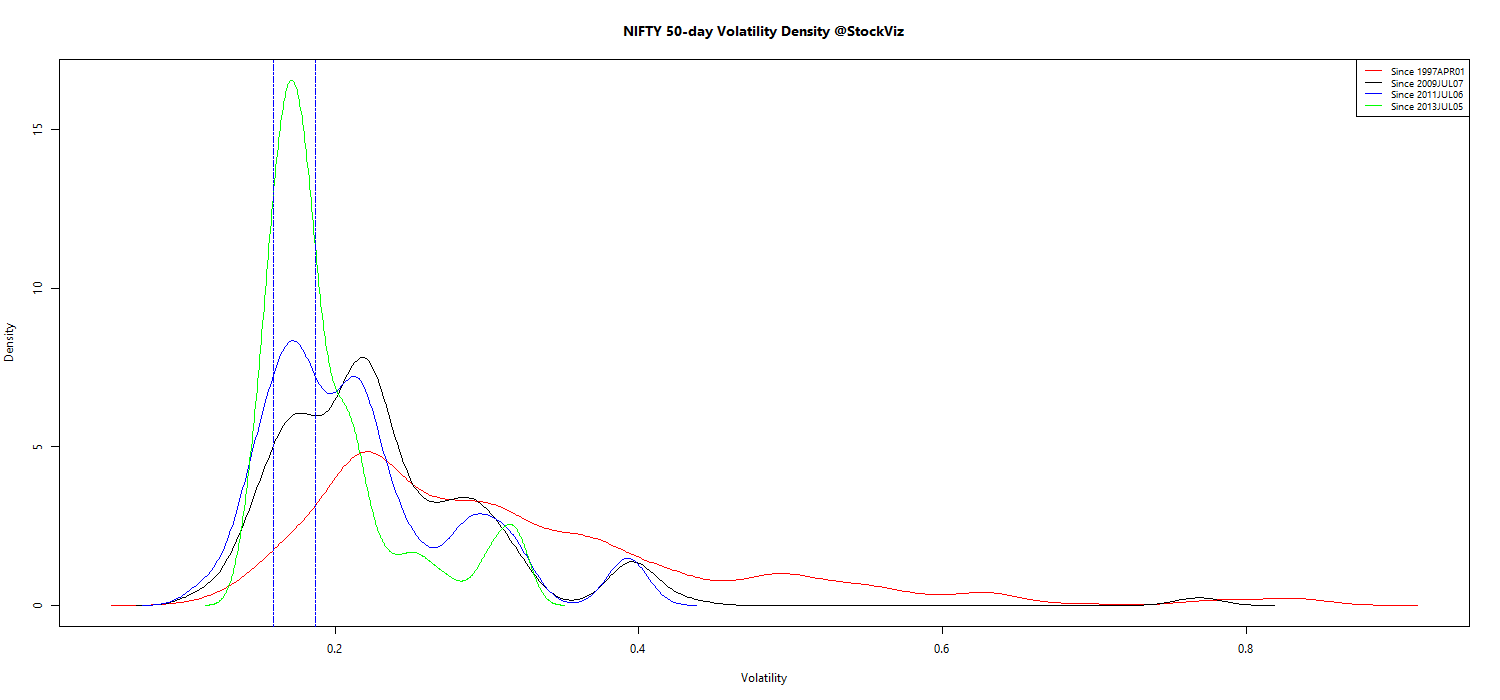
If you look at the 50-day volatility over different time-periods, you can observe how volatile volatility is:

NIFTY.volatility.density.50

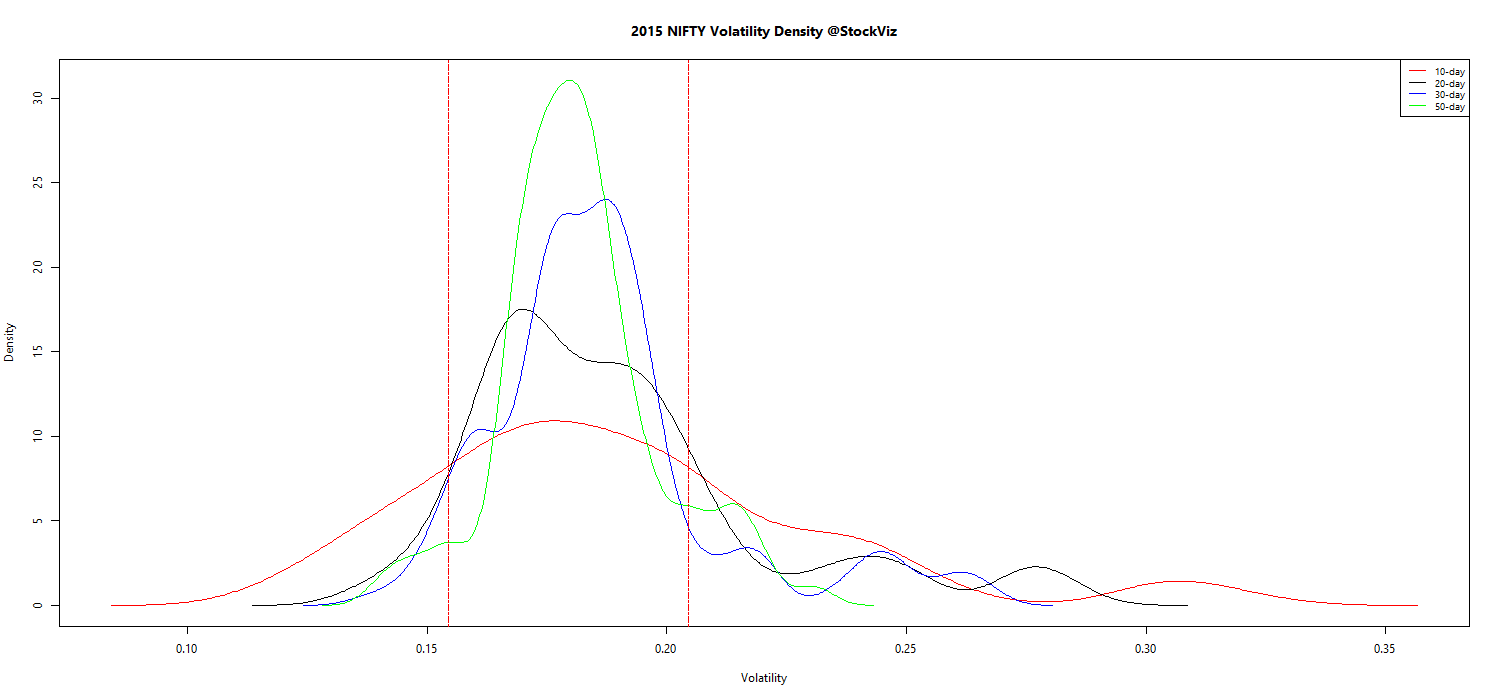
This year’s observed volatility is closer to last-year’s than to its long-term mean. Here’s how 2015 has panned out so far:

NIFTY.volatility.density.2015

We should expect higher volatility as the initial bull-run wears off and volatility reverts. This will have a ripple effect on pretty much every investment/trading strategy.

Appendix

Year-wise NIFTY volatility density plots (pdf)

Butterflies

Introduction

The butterfly can be used to bet on underlying volatility and is cheaper than straddles and strangles and without the unlimited risk.

Bearish outlook on volatility

A long call butterfly can entered when you think that the underlying stock will not rise or fall much by expiration. Using calls, the long butterfly can be constructed by buying one lower striking ITM call, writing two ATM calls and buying another higher striking OTM call.

For example, with the Nifty trading at 6780, that means entering into an April 6700/6750/6800 Long Call Butterfly. If the Nifty ends between 6712.00 and 6788.00 at expiry, you make a profit of Rs. 1900.00 and your downside (max loss) is limited to the premium you paid (Rs. 600.00)

April NIFTY 6700-6750-6800 Long Call Butterfly

April NIFTY 6700-6750-6800 Long Call Butterfly payoff
April NIFTY 6700-6750-6800 Long Call Butterfly PL

The same outlook can be expressed using puts. For example, with the Nifty trading at 6780, you can enter into an April 6700/6750/6800 Long Put Butterfly. If the Nifty ends between 6707.75 and 6792.25 at expiry, you make a profit of Rs. 2112.50 and your downside (max loss) is limited to the premium you paid (Rs. 387.50) In this case, the Long Put Butterfly makes more sense: it costs less, the expected P&L is higher and the break-evens are wider.

April NIFTY 6700-6750-6800 Long Put Butterfly

April NIFTY 6700-6750-6800 Long Put Butterfly payoff
April NIFTY 6700-6750-6800 Long Put Butterfly PL

γ: runs from positive to negative. γ is negative when the stock is at the middle strike. This indicates that the butterfly will manufacture negative δs if the stock price rises, and positive δs if the stock price falls. This is precisely what you don’t want to happen. That’s why the long butterfly wants the price of the stock to stay right where it is when it’s at the middle strike.

θ: positive when the price of the stock is at the middle strike, indicating that time passing helps the long butterfly reach its maximum value. At the outer strikes theta is negative, indicating that the butterfly is losing value as time passes.

κ is negative when the stock price is at the middle strike. That means that any increased implied volatility in the stock will decrease the value of the butterfly. κ is positive for the long butterfly at the outer strikes. Therefore, an increase in the implied volatility of the stock increases the value of the butterfly because of the greater likelihood that the stock will move toward the middle strike by expiration.

Bullish outlook on volatility

A Short Call Butterfly allows you to collect premiums if you can wait out uncertainty. For example, with the Nifty trading at 6780, you can enter into an April 6700/6750/6800 Short Call Butterfly. If the Nifty ends below 6712.00 or above 6788.00 then you lose Rs. 1900.00 (difference in strikes – premium received). Otherwise, you get to keep the option premium you collected (Max: Rs. 600.00)

NIFTY April 6700-6750-6800 Short Call Butterfly

NIFTY April 6700-6750-6800 Short Call Butterfly payoff
NIFTY April 6700-6750-6800 Short Call Butterfly PL

The same view can be expressed using a Short Put Butterfly. For example, with the Nifty trading at 6780, you can enter into an April 6700/6750/6800 Short Put Butterfly. If the Nifty ends below 6707.75 or above 6707.75 then you lose Rs. 2112.50 (difference in strikes – premium received). Otherwise, you get to keep the option premium you collected (Max: Rs. 387.50)

NIFTY April 6700-6750-6800 Short Put Butterfly

NIFTY April 6700-6750-6800 Short Put Butterfly payoff
NIFTY April 6700-6750-6800 Short Put Butterfly pl

θ: helpful when the position is profitable
δ: greatest around the outer strikes, zero around the middle strike
κ: volatility is helpful, unless the underlying moves outside the outer strikes
γ: peaks positively around the middle strike and negatively around the outside strikes

Trading butterflies

You should know the historical volatility of the underlying and its distribution before you get into volatility trades. As a rule of thumb, always try to position your derivative book towards being long volatility.

If the bid/ask spread is too wide, it can affect the quality of the trade. Since the losses are capped, running this trade to expiry may be tempting in such a scenario.

Source: ThinkOrSwim
Understanding Nifty Volatility

Definition

Volatility (σ) is a measure for variation of price of a financial instrument over time. Historic volatility is derived from time series of past market prices. There are different ways of calculating volatility. At StockViz, we use Yang Zhang Volatility.

σ is one of the biggest contributor of option premiums. Understanding its true nature will help you trade it better.

Volatility spikes

Observe the volatility spikes since 2005. Even though the average is around 0.3, its not uncommon to have huge swings.

nifty-volatility

Fat tails abound

nifty-volatility-10-histogram

nifty-volatility-20-histogram

nifty-volatility-30-histogram

nifty-volatility-50-histogram

Trading strategy

Always try to be on the long-side of volatility. It might be tempting, while trading options, to try and clip the carry on θ-decay. But you should always be aware of the fat-tails of volatility that can crush many months of carry P&L overnight.

USDINR Implied Vol vs. Realized Vol

Does implied volatility contain incremental information about future volatility? At least according to this paper, it does.

Here’s a chart that plots USDINR option implied volatility (nearest at the money) vs. futures (nearest expiry). It does appear that IV leads realized vol, but it would be interesting to see if there’s any trading edge here…

USDINR Option Implied Vol and Futures Realized Vol

[stockquote]ATULAUTO[/stockquote]