Was 2014 an anomaly?
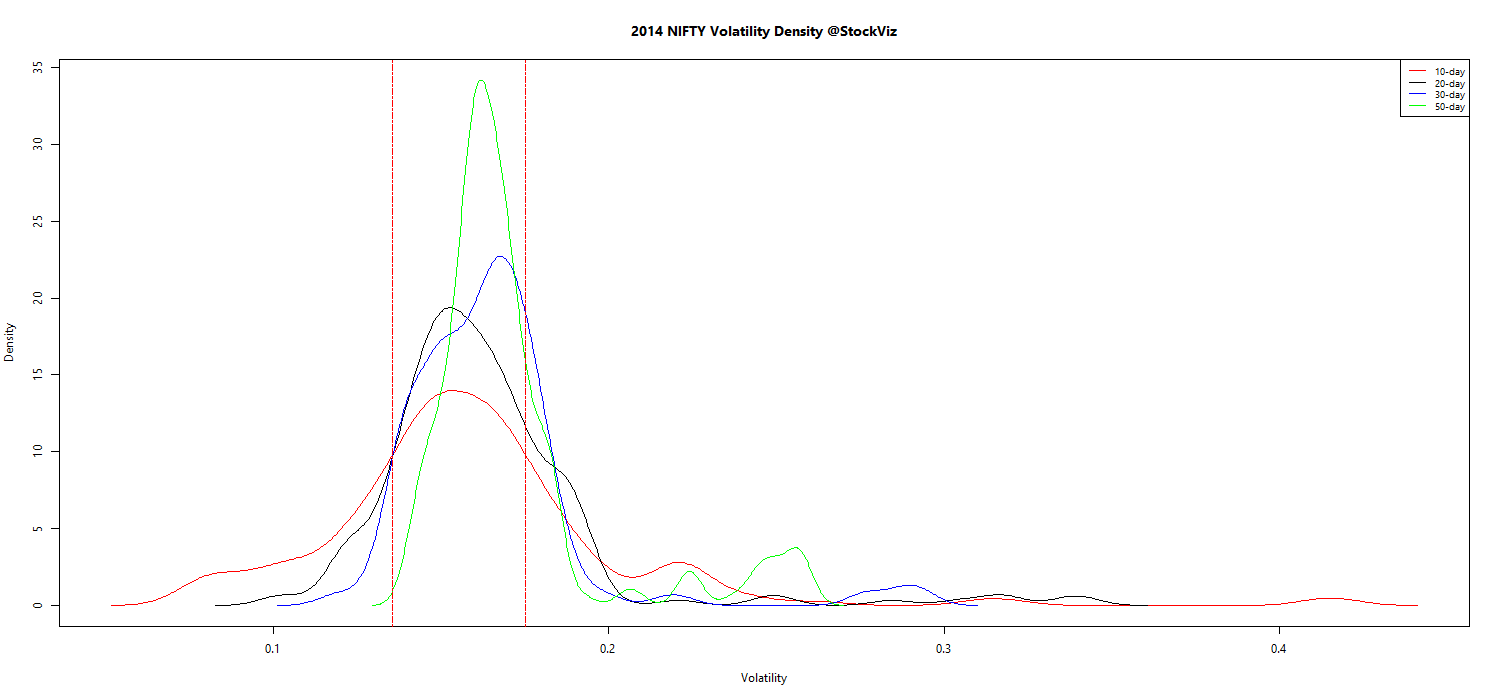
Here’s a density plot of NIFTY volatility across 10-, 20-, 30-, and 50-day periods:
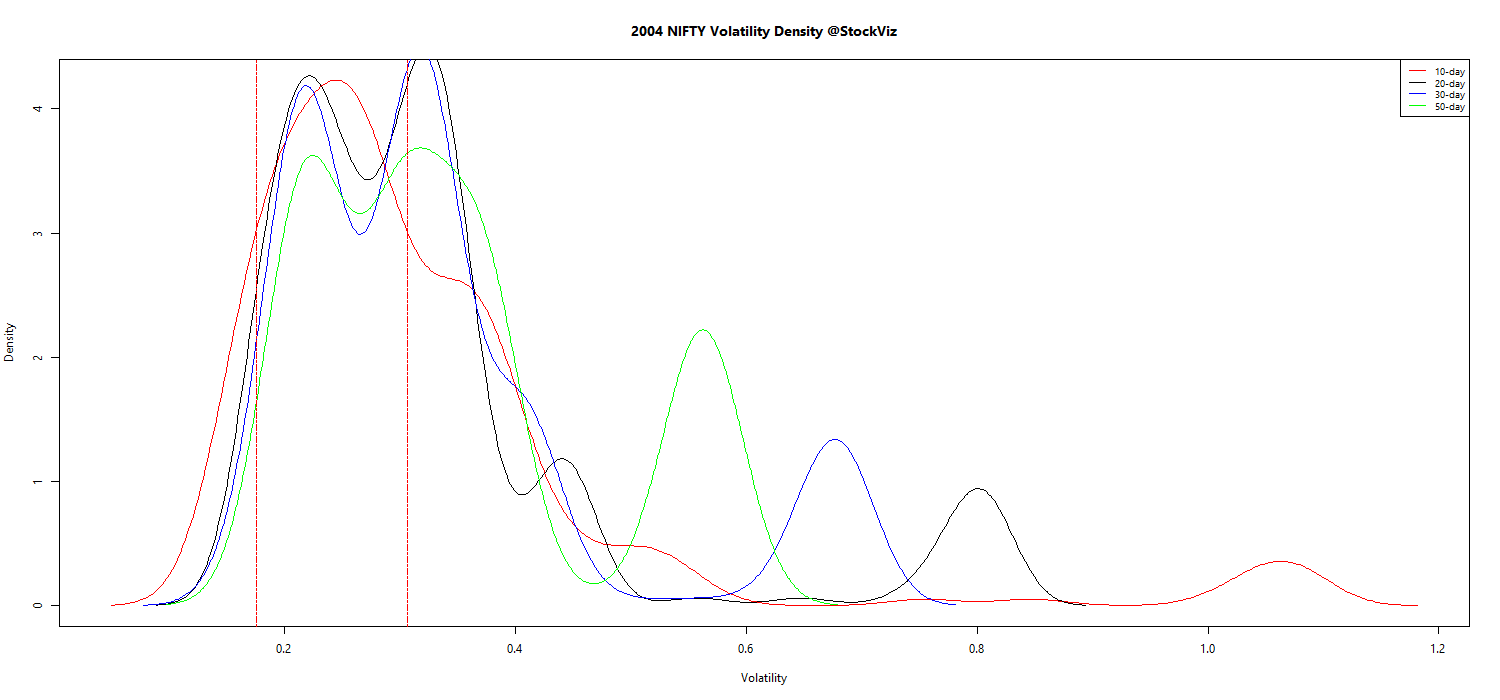
And here’s how it was in 2004 (10-years ago):
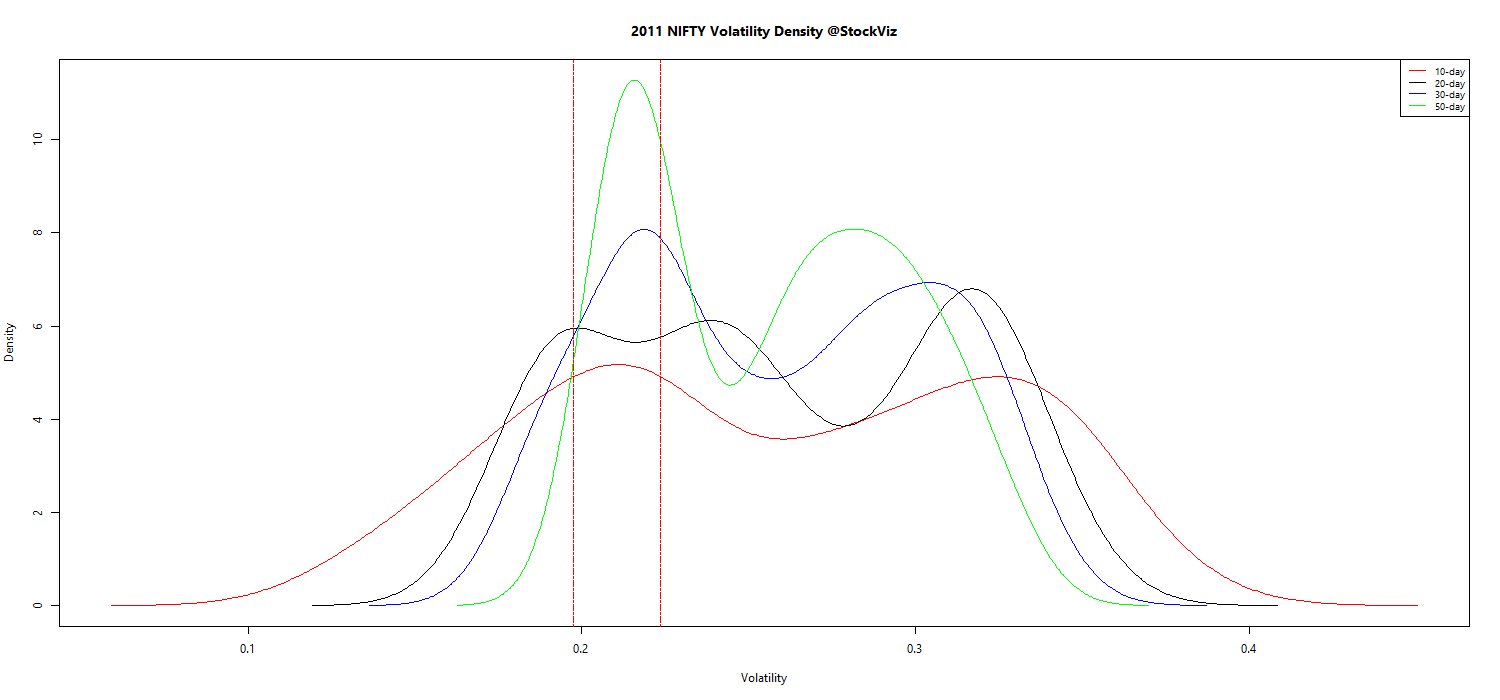
For those of who argue that the introduction of the pre-open auction call in 2010![]() skews these results, here’s how 2011 looked like:
skews these results, here’s how 2011 looked like:
The unprecedented absence of a second “hump” in the volatility density plot for 2014 should give pause to investors looking for a repeat of 2014 anytime soon.
Reversion to higher volatility?
If you look at the 50-day volatility over different time-periods, you can observe how volatile volatility is:
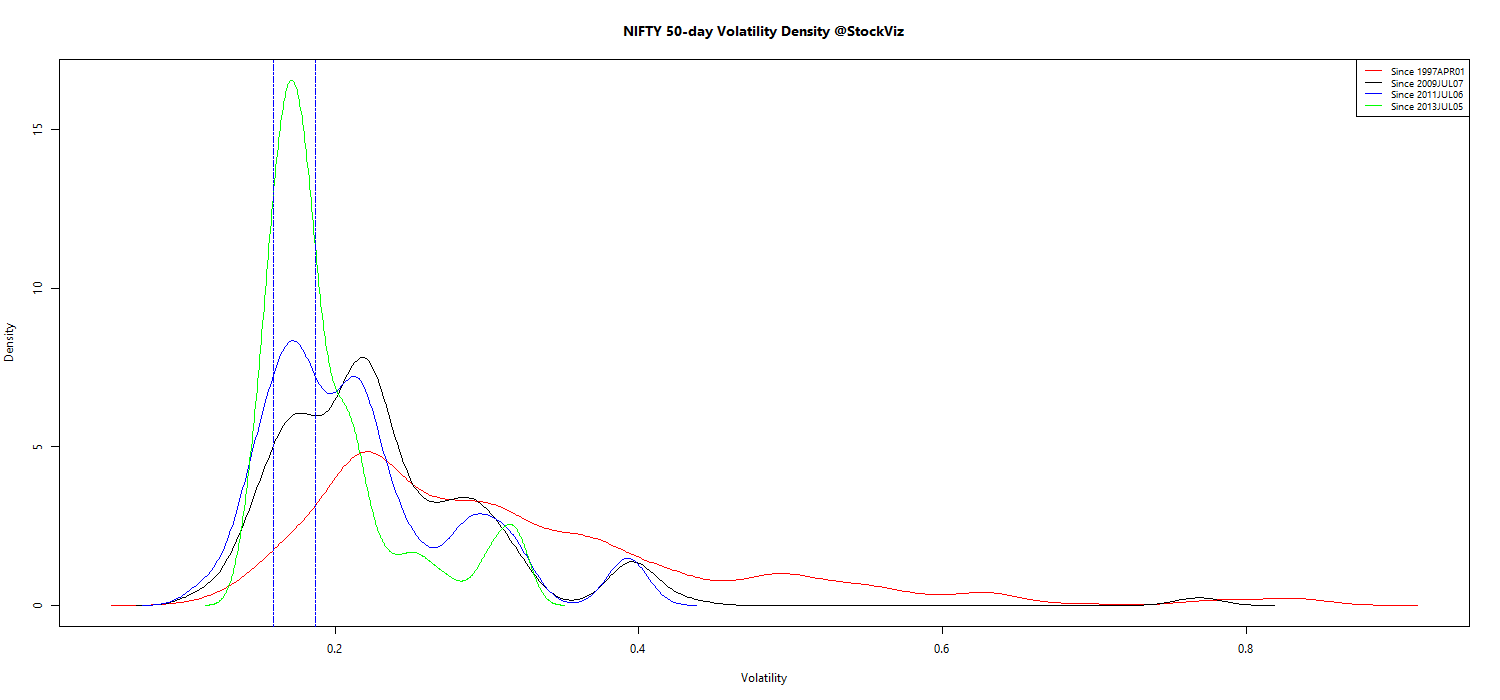
This year’s observed volatility is closer to last-year’s than to its long-term mean. Here’s how 2015 has panned out so far:
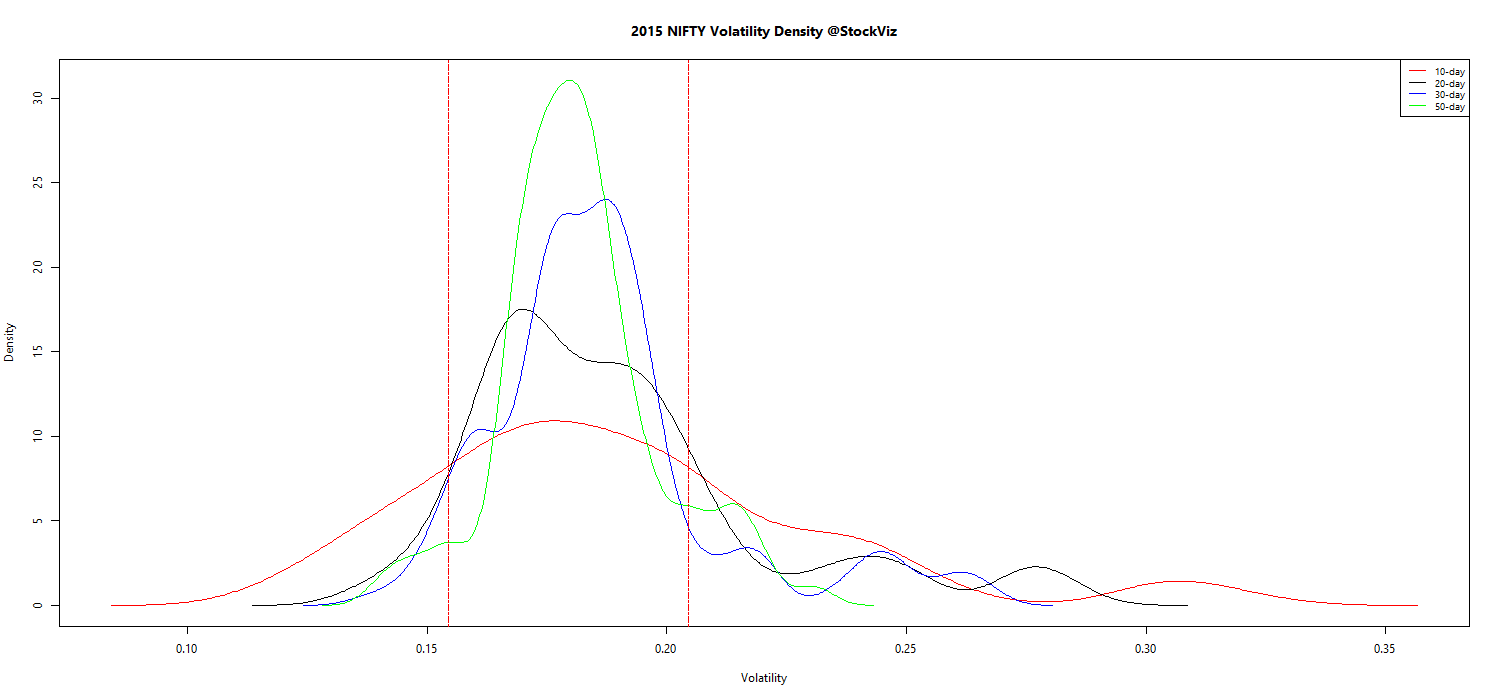
We should expect higher volatility as the initial bull-run wears off and volatility reverts. This will have a ripple effect on pretty much every investment/trading strategy.
Appendix
Year-wise NIFTY volatility density plots (pdf)