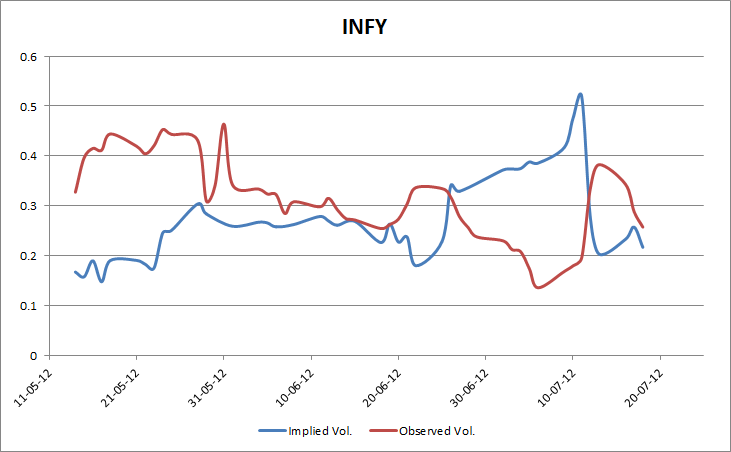
 Previously, we discussed historical volatility – a measure of volatility already exhibited by the stock. However, history, in and of itself, doesn’t tell you much. There’s another measure, called “Implied Volatility” (IV, for short) that embodies the market’s expectation of future volatility. IV is a useful gauge of the uncertainty “priced-in” by market participants. The chart on the left gives you a comparison between the near maturity IV of ATM calls vs. historical volatility exhibited by INFY.
So what exactly is IV? One of the inputs for the Black–Scholes-Merton model for option pricing is volatility. When you use historical volatility for this input, the price calculated by the model doesn’t match the price at which the market is trading that option. So IV is that value of volatility that brings the output of the BSM in-line with the market price.
How exactly is IV useful? IV allows you to determine a stock’s one-standard deviation move (a stock tends to stay within its one standard deviation move 68% of the time.) If the market is “right”, IV should lead observed (or spot) volatility. So if you plan to hold a stock for less than three months, you should be watching the ATM IVs of the on the run option as well.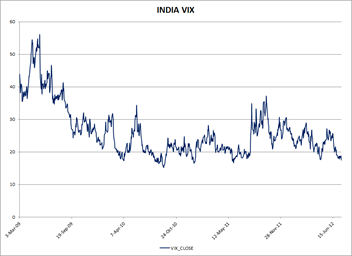
Implied Volatilities are specific to stocks who’s options are traded. It is very hard to generalize the IV of one scrip to a sector or the market. That’s where VIX comes in. India VIX is a volatility index based on the NIFTY Index options. From the best bid-ask prices of NIFTY Options contracts, a volatility figure (%) is calculated which indicates the expected market volatility over the next 30 calendar days. For example, if the VIX is 15, this represents an expected annualized change of 15% over the next 30 days; thus one can infer that the index option markets expect the NIFTY to move up or down 15%/√12 = 4.33% over the next 30-day period.
Implied Volatility and its market aggregate, the VIX, are key gauges that any investor should track on a regular basis. A big variation usually signals “something” is afoot and allows the investor to position himself appropriately. When possible, you should always combine historical volatility and implied volatility to get a true sense of where the underlying stock or index is headed.
