Introduction
The butterfly can be used to bet on underlying volatility and is cheaper than straddles and strangles and without the unlimited risk.
Bearish outlook on volatility
A long call butterfly can entered when you think that the underlying stock will not rise or fall much by expiration. Using calls, the long butterfly can be constructed by buying one lower striking ITM call, writing two ATM calls and buying another higher striking OTM call.
For example, with the Nifty trading at 6780, that means entering into an April 6700/6750/6800 Long Call Butterfly. If the Nifty ends between 6712.00 and 6788.00 at expiry, you make a profit of Rs. 1900.00 and your downside (max loss) is limited to the premium you paid (Rs. 600.00)

The same outlook can be expressed using puts. For example, with the Nifty trading at 6780, you can enter into an April 6700/6750/6800 Long Put Butterfly. If the Nifty ends between 6707.75 and 6792.25 at expiry, you make a profit of Rs. 2112.50 and your downside (max loss) is limited to the premium you paid (Rs. 387.50) In this case, the Long Put Butterfly makes more sense: it costs less, the expected P&L is higher and the break-evens are wider.

γ: runs from positive to negative. γ is negative when the stock is at the middle strike. This indicates that the butterfly will manufacture negative δs if the stock price rises, and positive δs if the stock price falls. This is precisely what you don’t want to happen. That’s why the long butterfly wants the price of the stock to stay right where it is when it’s at the middle strike.
θ: positive when the price of the stock is at the middle strike, indicating that time passing helps the long butterfly reach its maximum value. At the outer strikes theta is negative, indicating that the butterfly is losing value as time passes.
κ is negative when the stock price is at the middle strike. That means that any increased implied volatility in the stock will decrease the value of the butterfly. κ is positive for the long butterfly at the outer strikes. Therefore, an increase in the implied volatility of the stock increases the value of the butterfly because of the greater likelihood that the stock will move toward the middle strike by expiration.
Bullish outlook on volatility
A Short Call Butterfly allows you to collect premiums if you can wait out uncertainty. For example, with the Nifty trading at 6780, you can enter into an April 6700/6750/6800 Short Call Butterfly. If the Nifty ends below 6712.00 or above 6788.00 then you lose Rs. 1900.00 (difference in strikes – premium received). Otherwise, you get to keep the option premium you collected (Max: Rs. 600.00)

The same view can be expressed using a Short Put Butterfly. For example, with the Nifty trading at 6780, you can enter into an April 6700/6750/6800 Short Put Butterfly. If the Nifty ends below 6707.75 or above 6707.75 then you lose Rs. 2112.50 (difference in strikes – premium received). Otherwise, you get to keep the option premium you collected (Max: Rs. 387.50)

θ: helpful when the position is profitable
δ: greatest around the outer strikes, zero around the middle strike
κ: volatility is helpful, unless the underlying moves outside the outer strikes
γ: peaks positively around the middle strike and negatively around the outside strikes
Trading butterflies
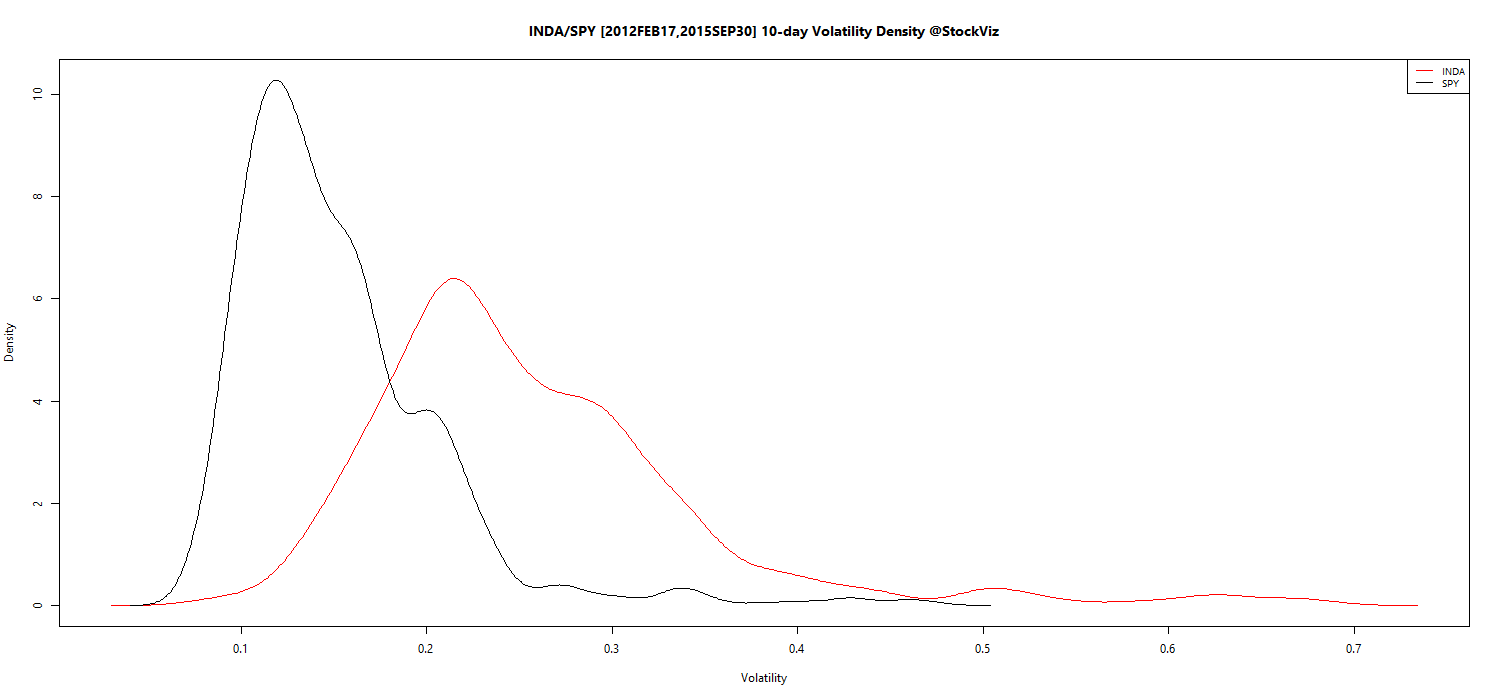
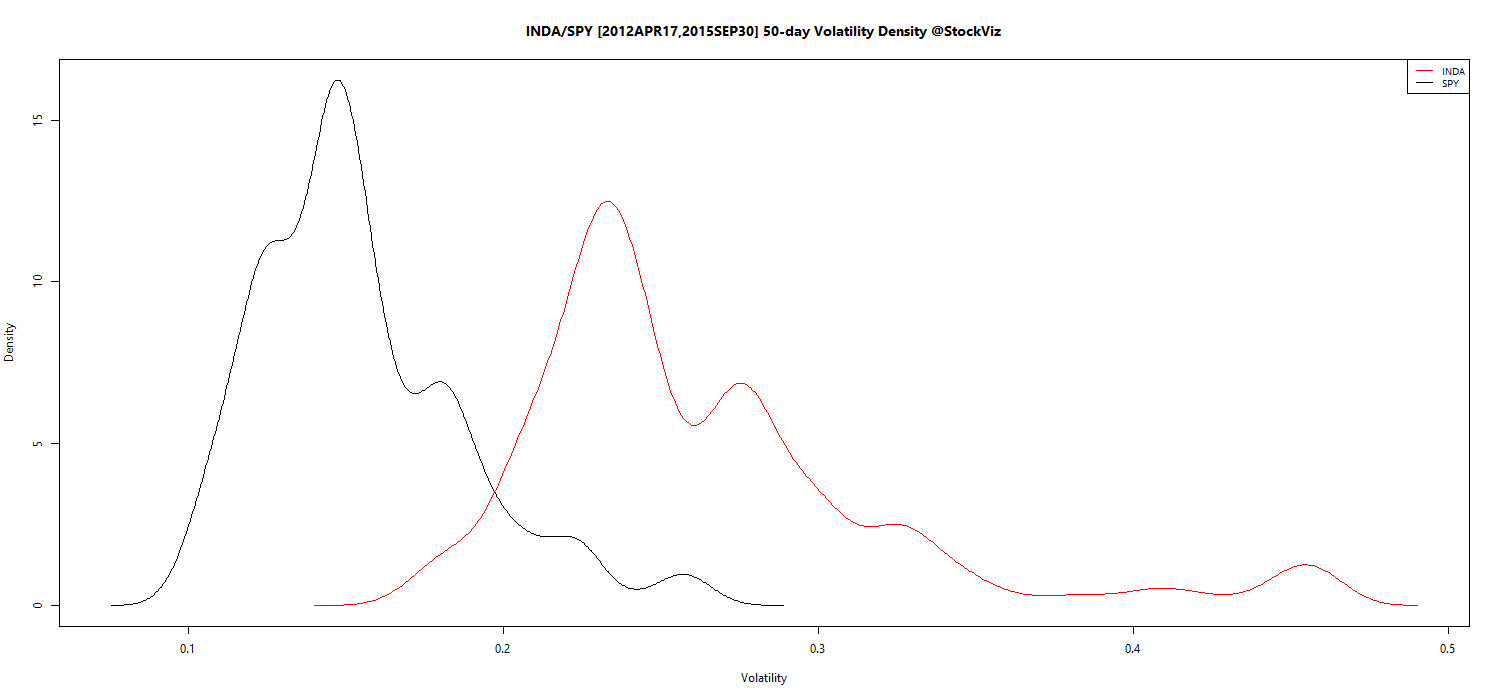
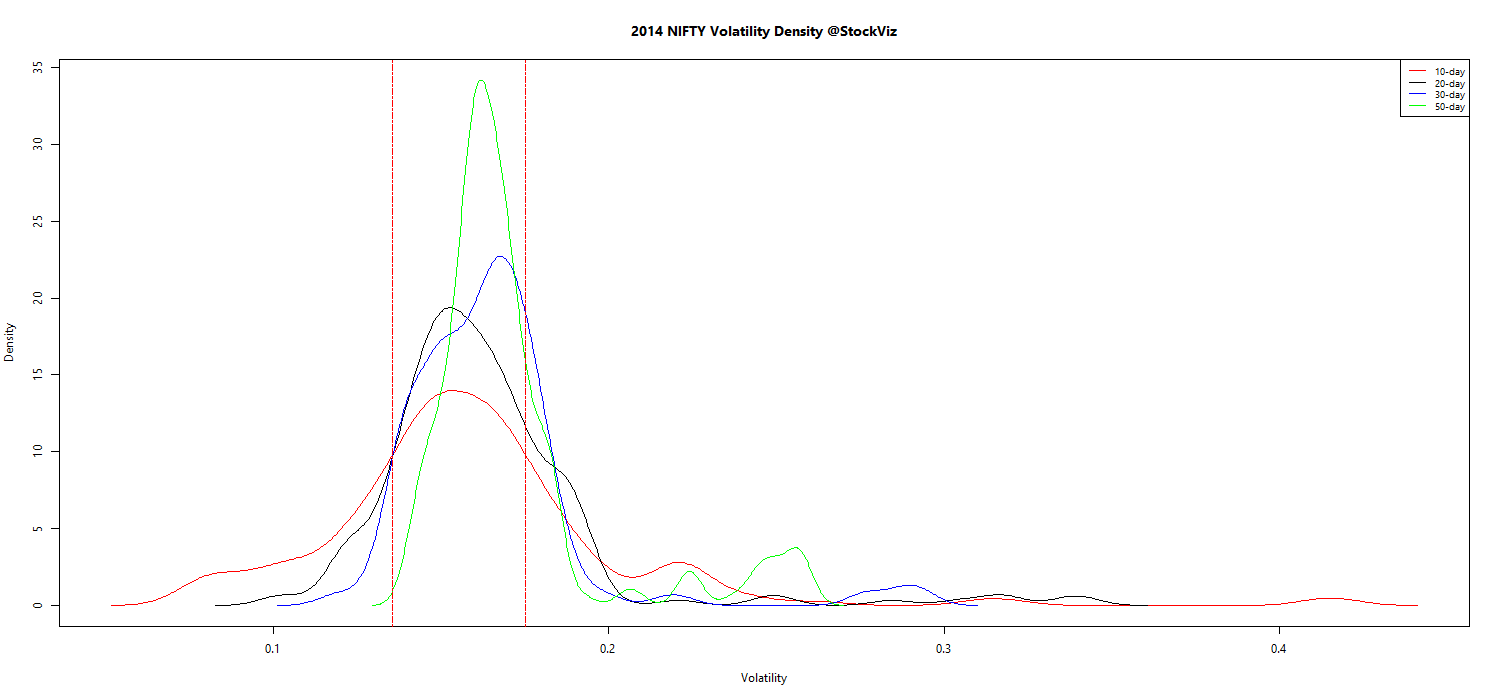
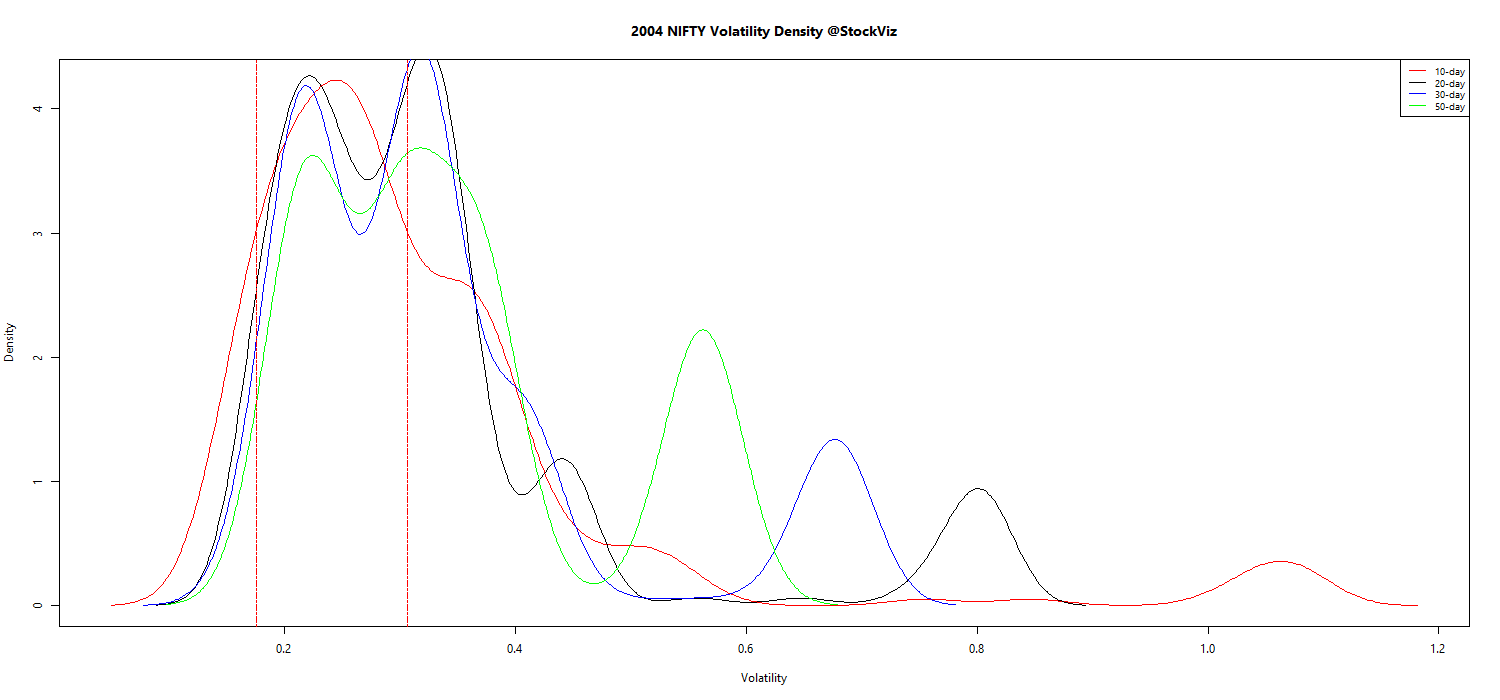
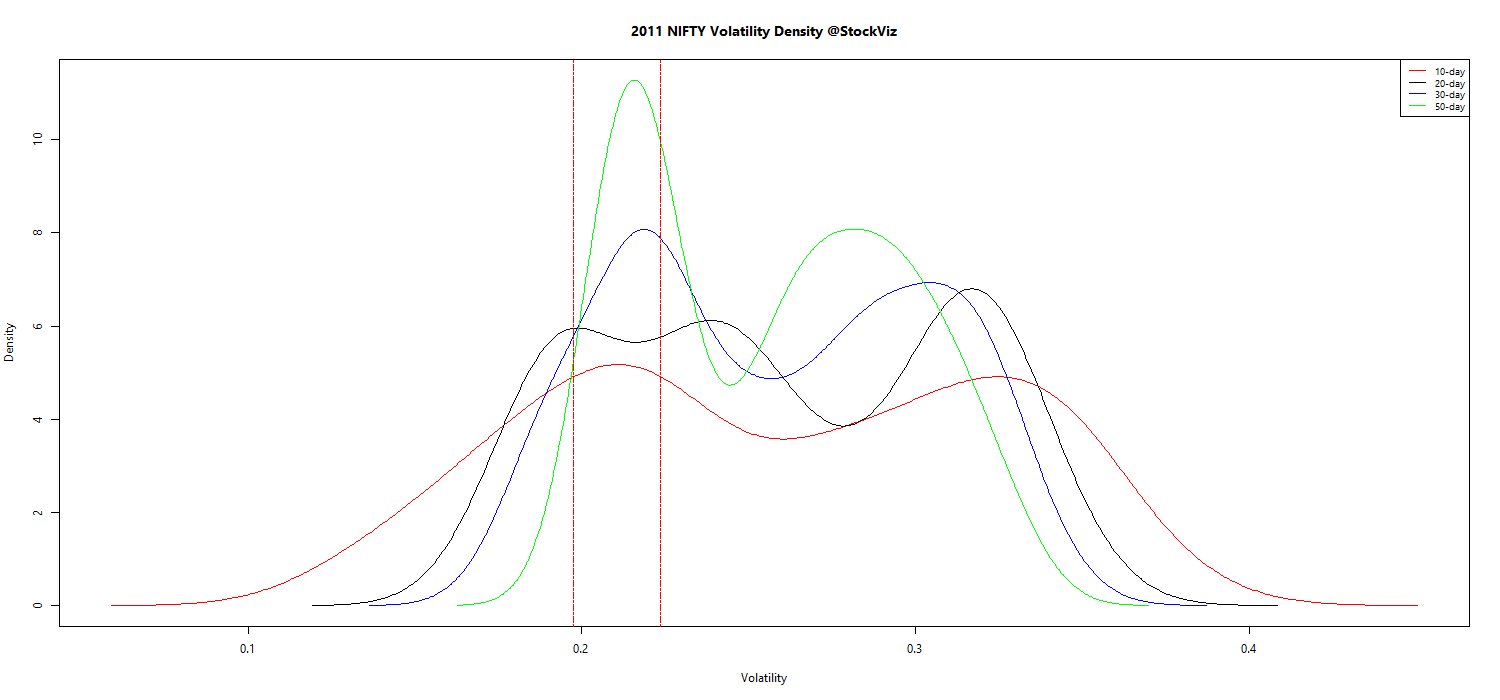
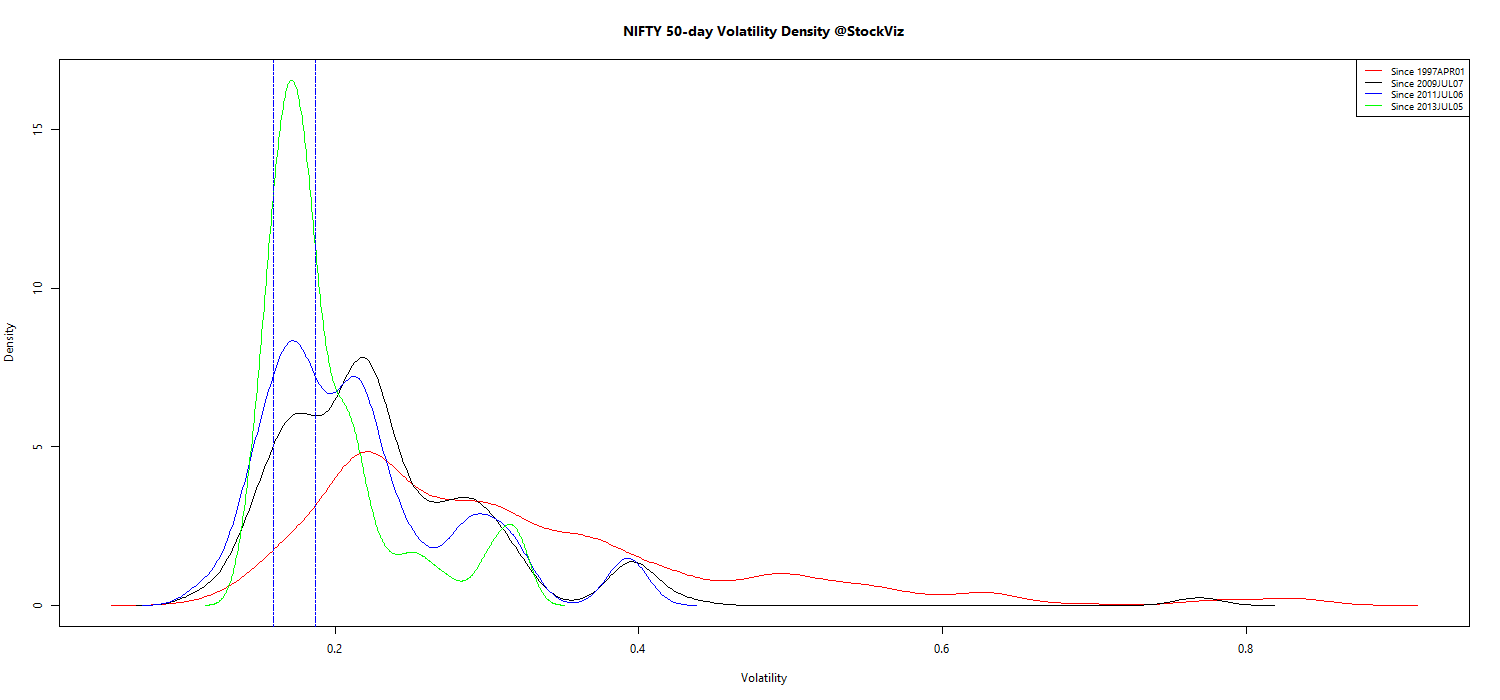
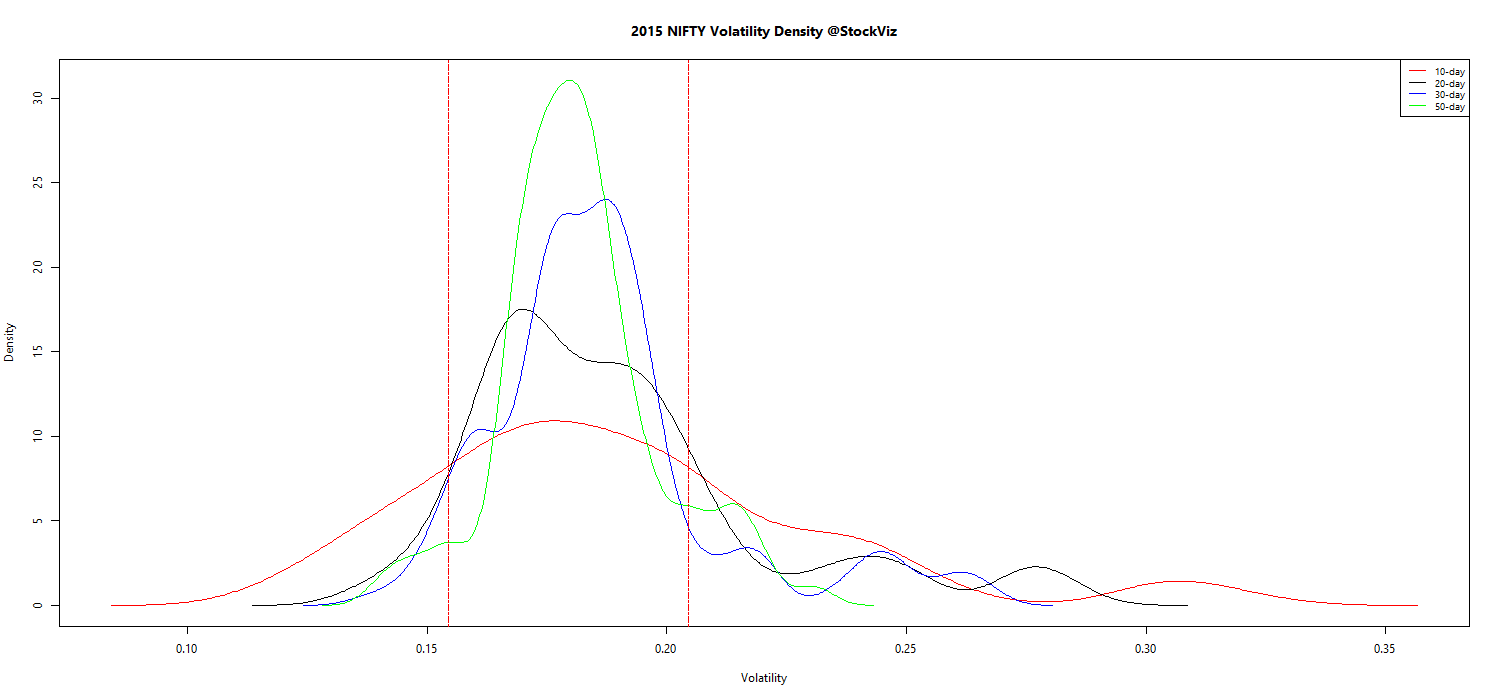
You should know the historical volatility of the underlying and its distribution before you get into volatility trades. As a rule of thumb, always try to position your derivative book towards being long volatility.
If the bid/ask spread is too wide, it can affect the quality of the trade. Since the losses are capped, running this trade to expiry may be tempting in such a scenario.
Source: ThinkOrSwim