Lower the Risk, Higher the Returns?
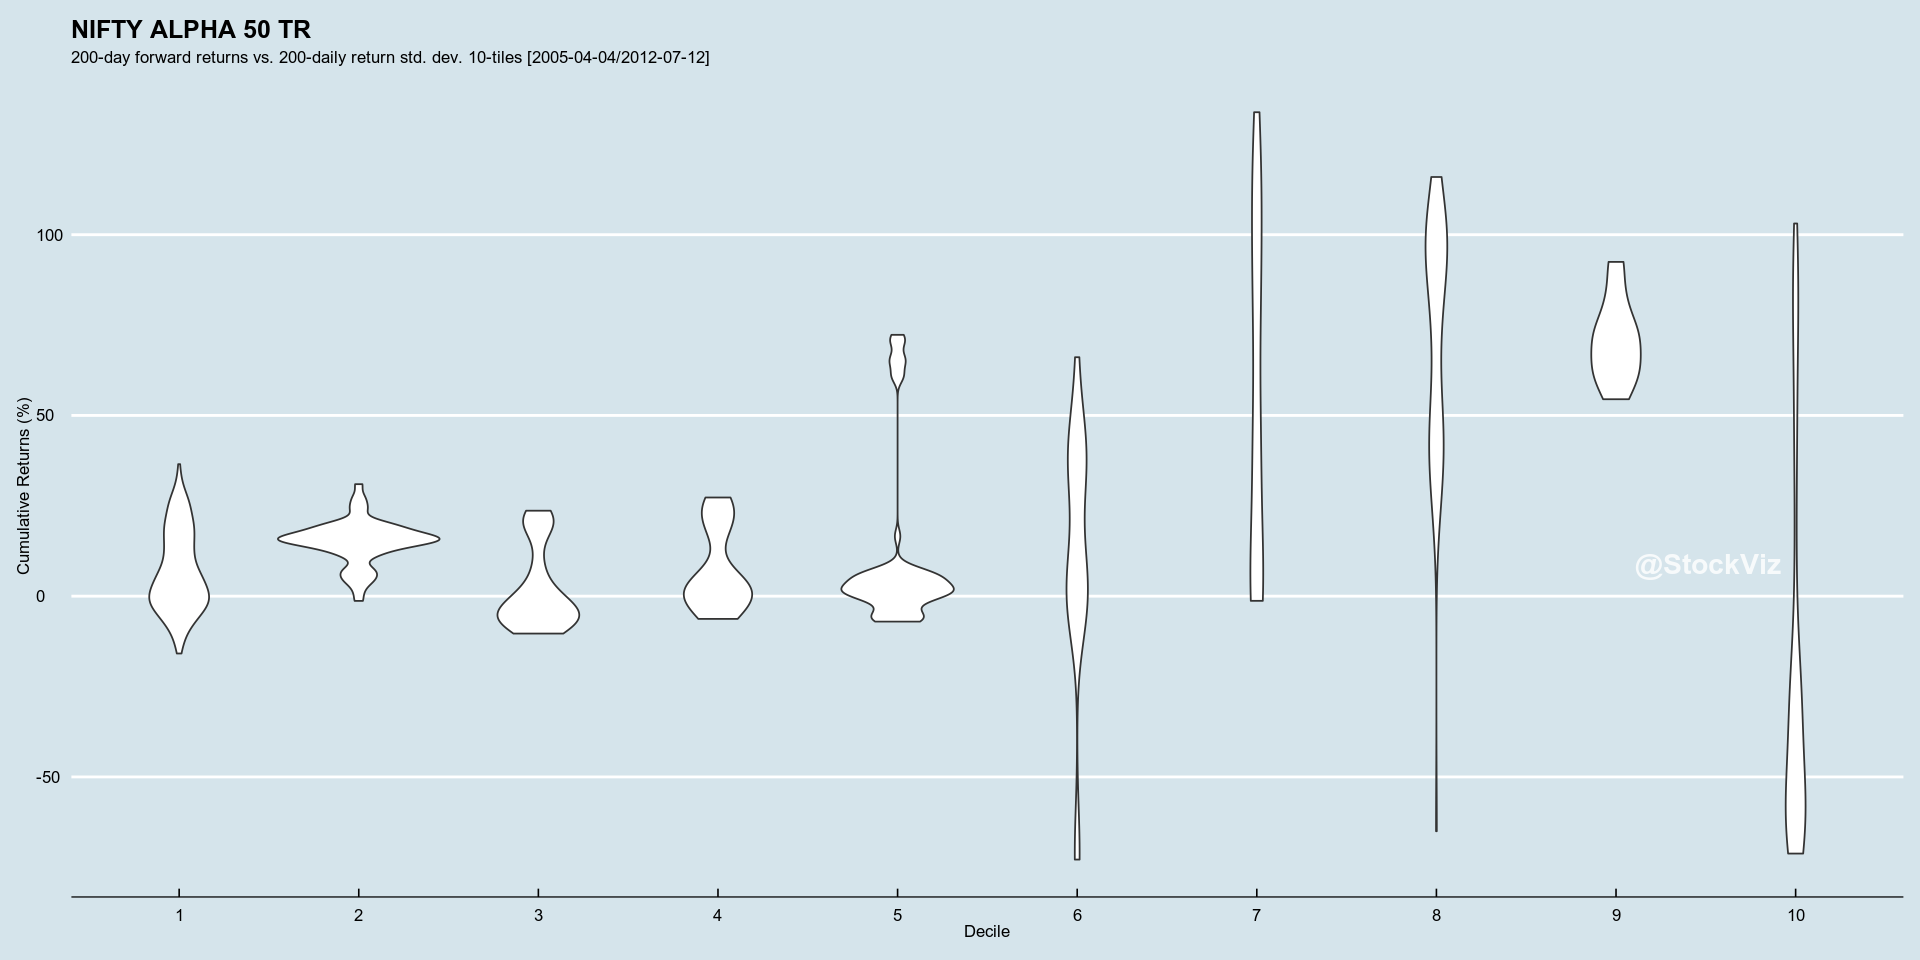
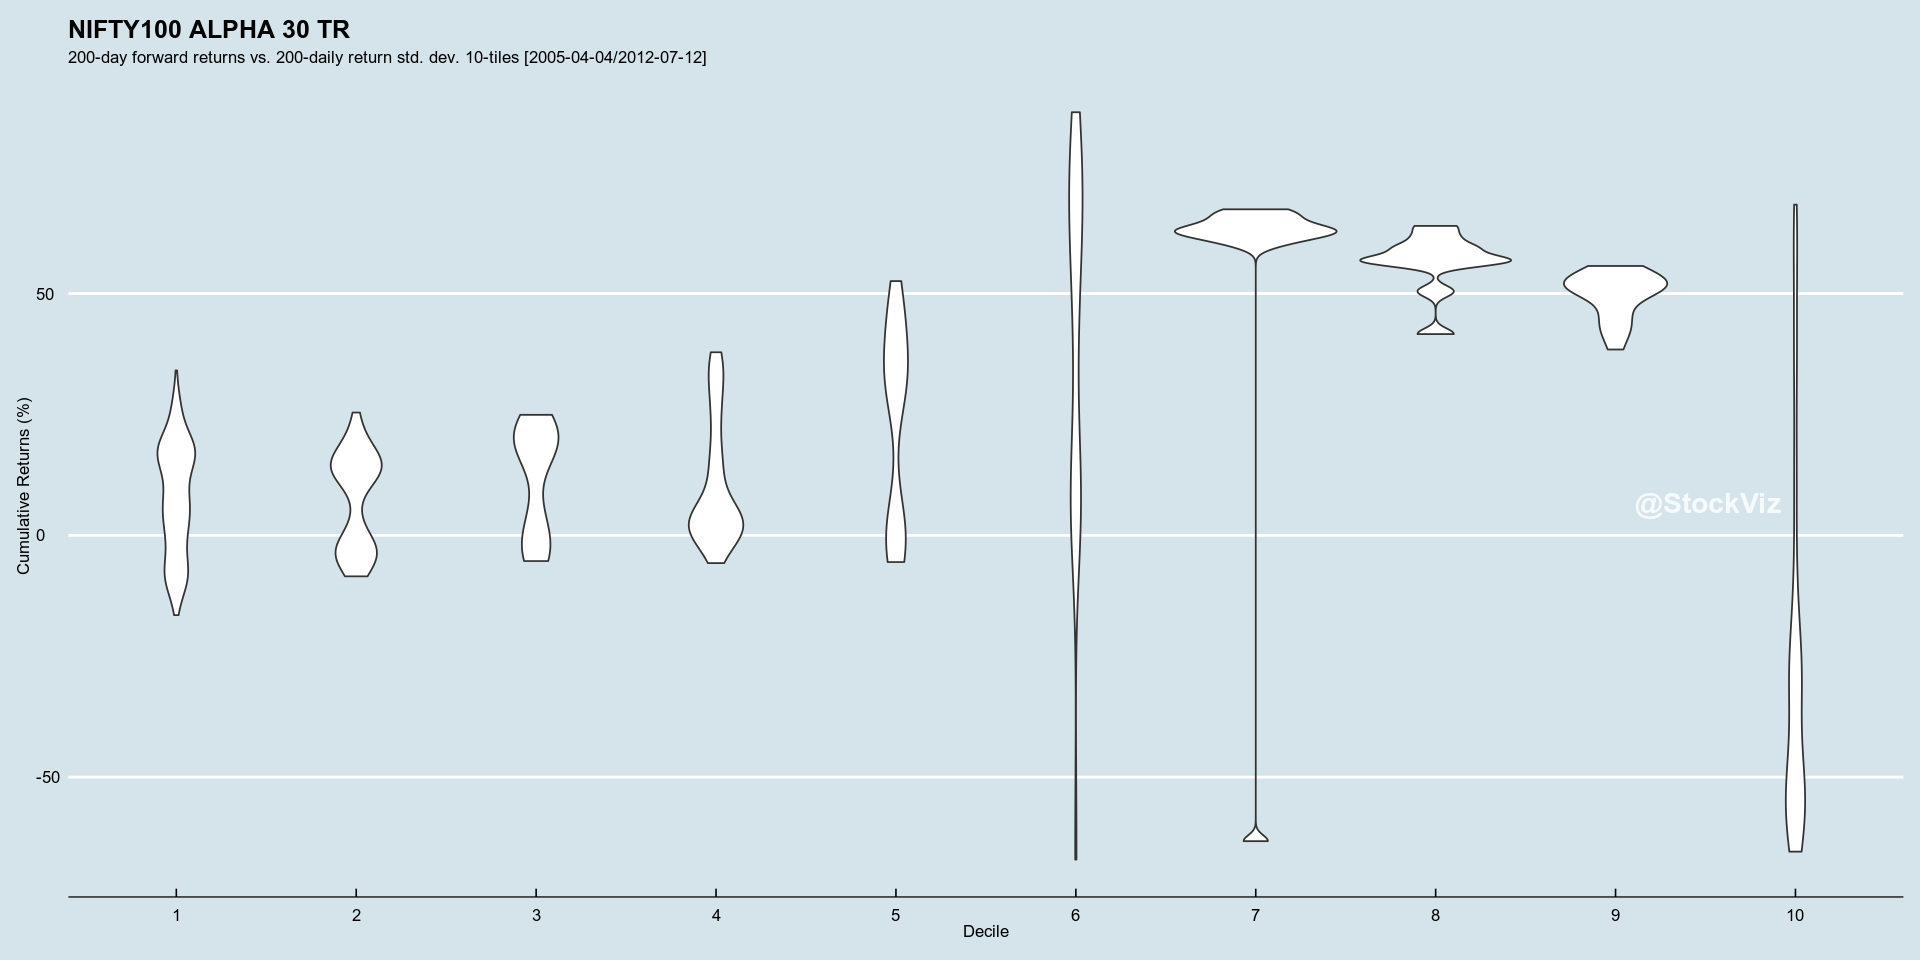
Typically, investors expect higher returns from high risk investments compared to low risk ones. However, realized returns are the opposite of what they expect.
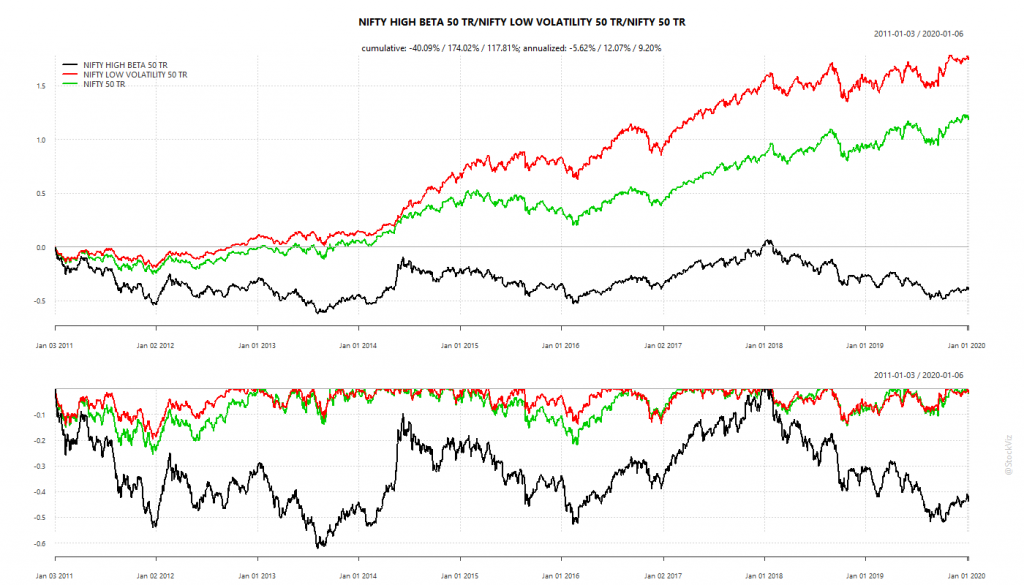
This anomaly, where lower risk systematically results in higher returns, has spawned a number of “betting against beta” strategies. A common approach is to rank a universe of stocks by volatility and create a portfolio off the top-N. However, this approach could lead to a highly volatile portfolio if relative correlations are not considered.
1+1 = 0
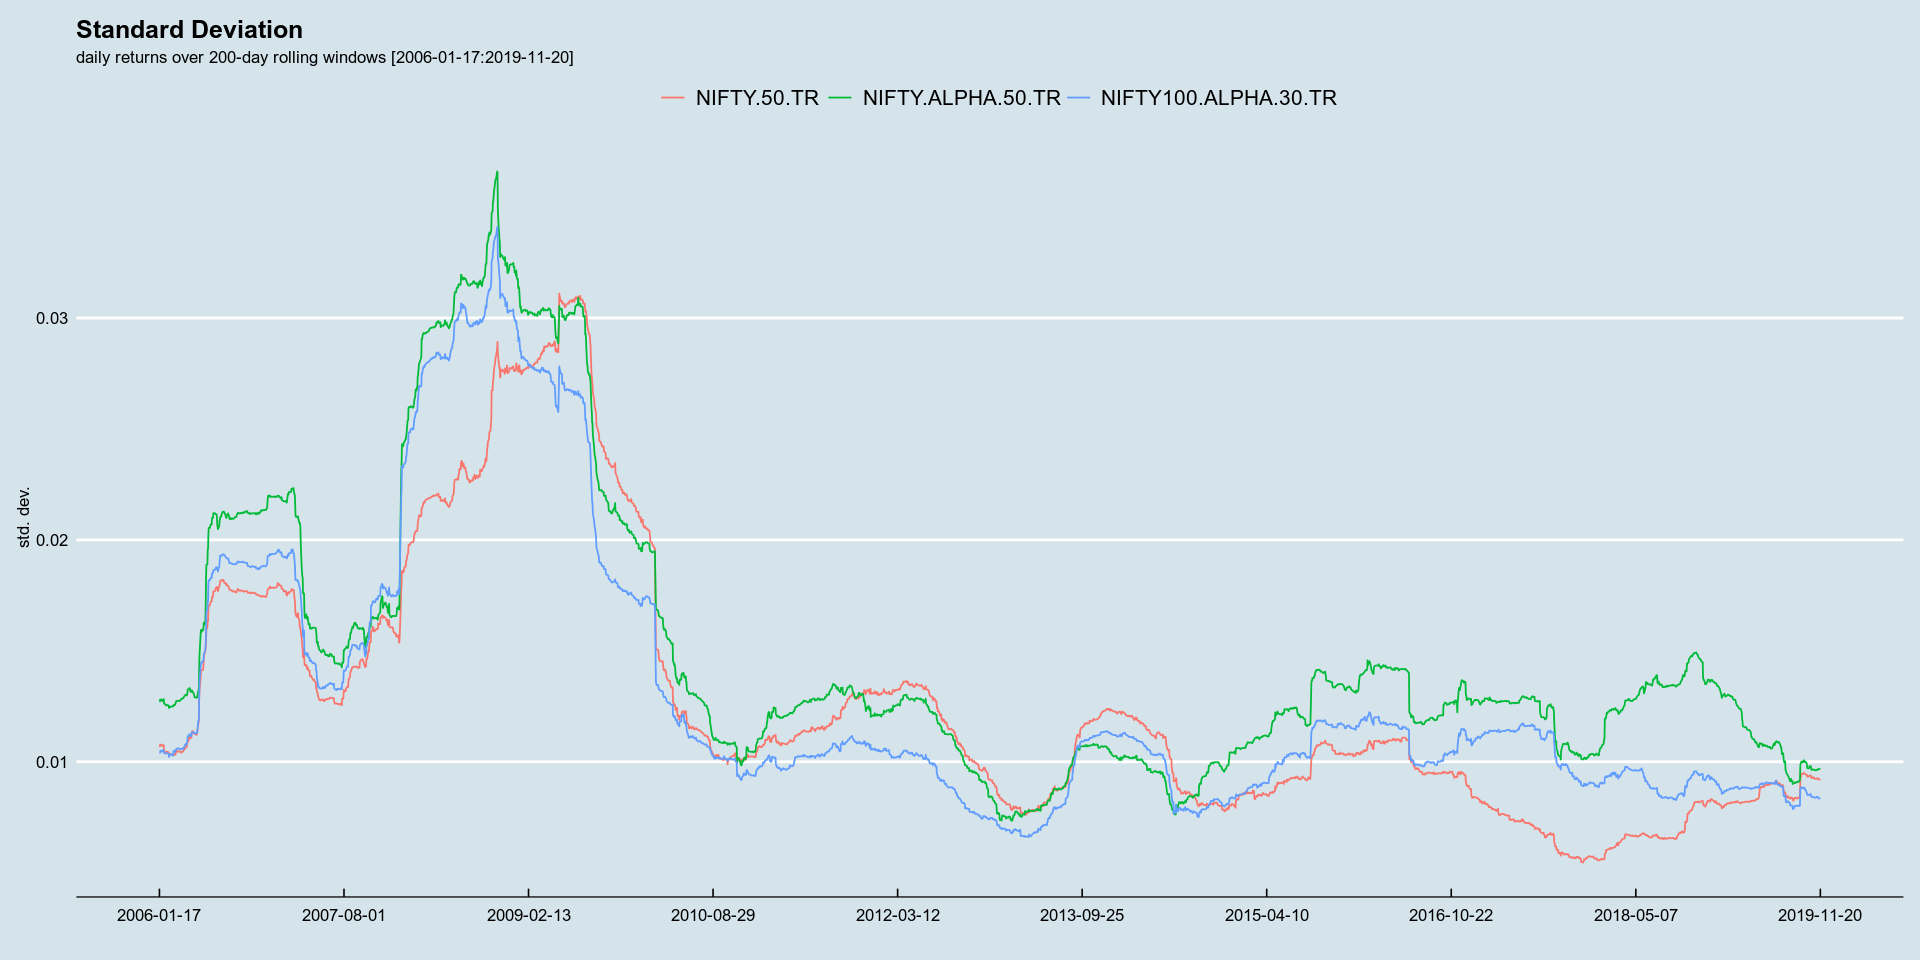
Here are two stocks with their volatility plotted against time:
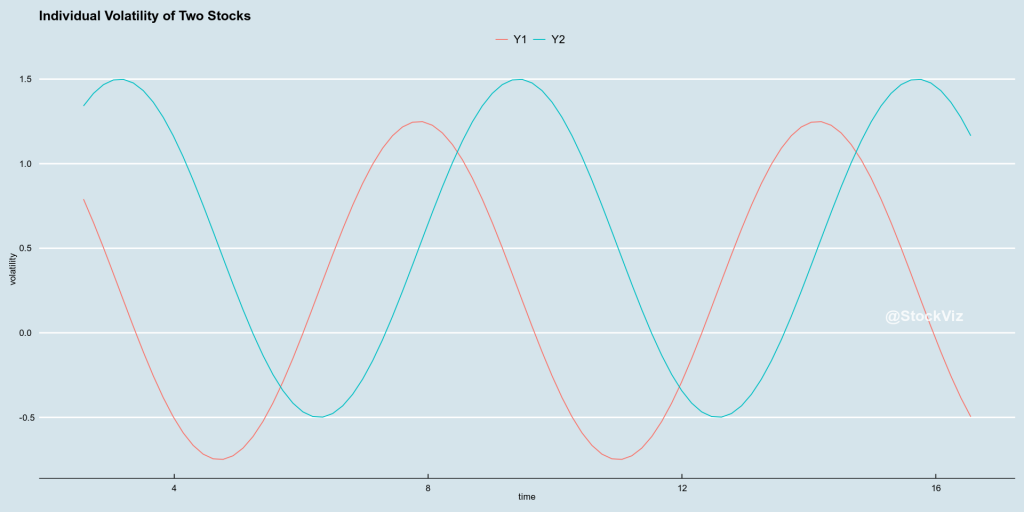
If you create a portfolio off these two stocks, what happens to portfolio volatility?
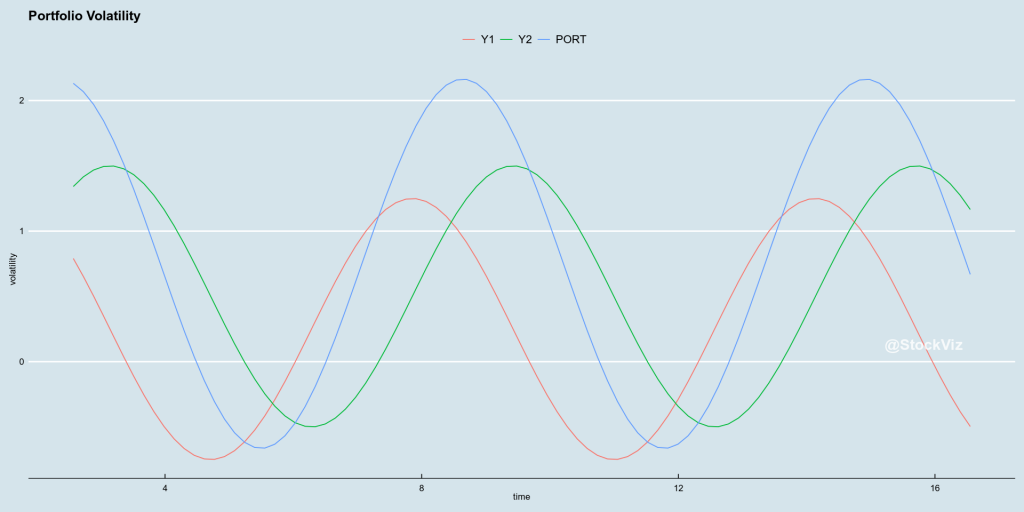
In the worst case scenario, where all the volatilities are correlated, portfolio volatility can end up being a sum of all component volatility.
If low-vol stocks can create a high-vol portfolio, can high-vol stocks create a low-vol portfolio? Yes! It all depends on how the volatilities are correlated.
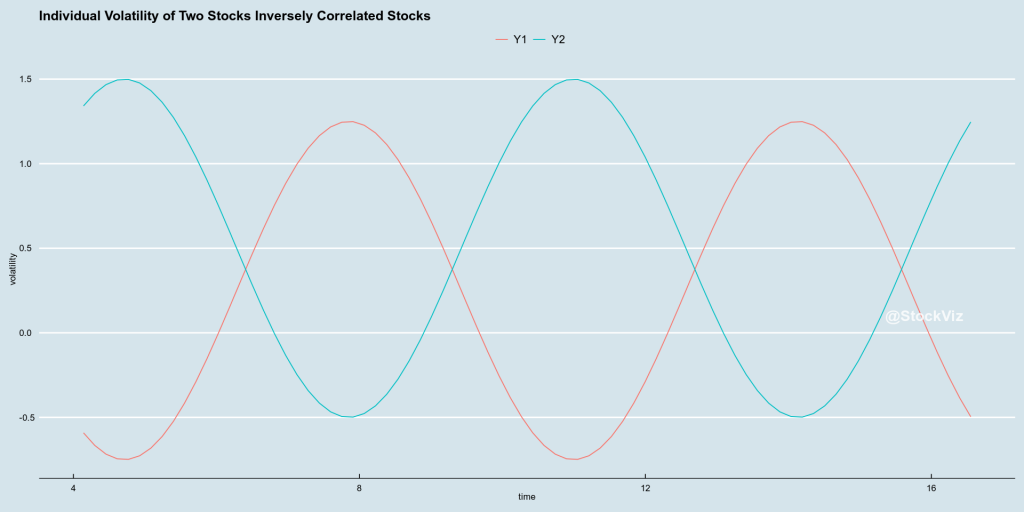
In the best case scenario, portfolio volatility can be a very low constant value if the components are inversely correlated.
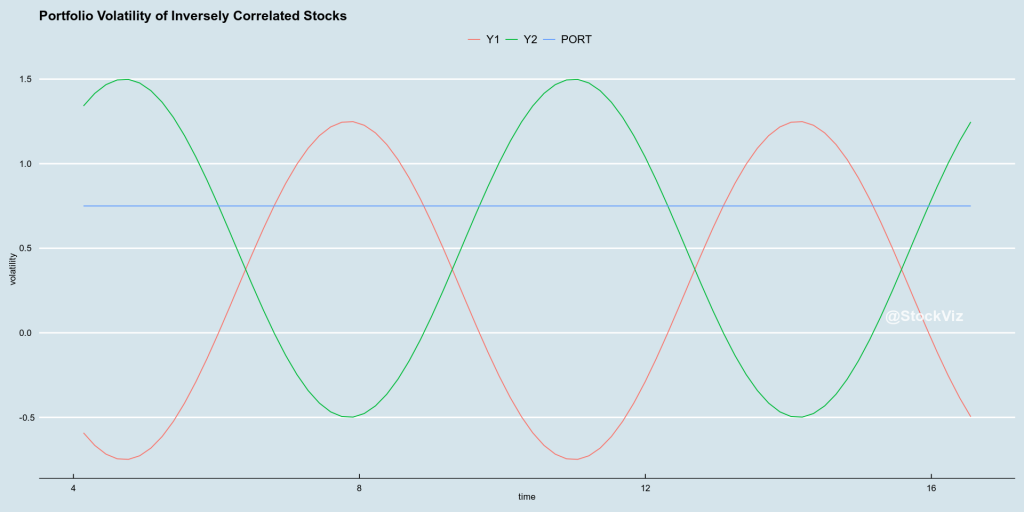
It doesn’t matter if individual volatilities are high or low. What matters is the correlation of volatilities.
Portfolio Optimization
A simple ranking of stocks will not help in creating a low-vol portfolio. What we need is a holistic approach that considers the correlation of volatilities and optimizes the entire portfolio.
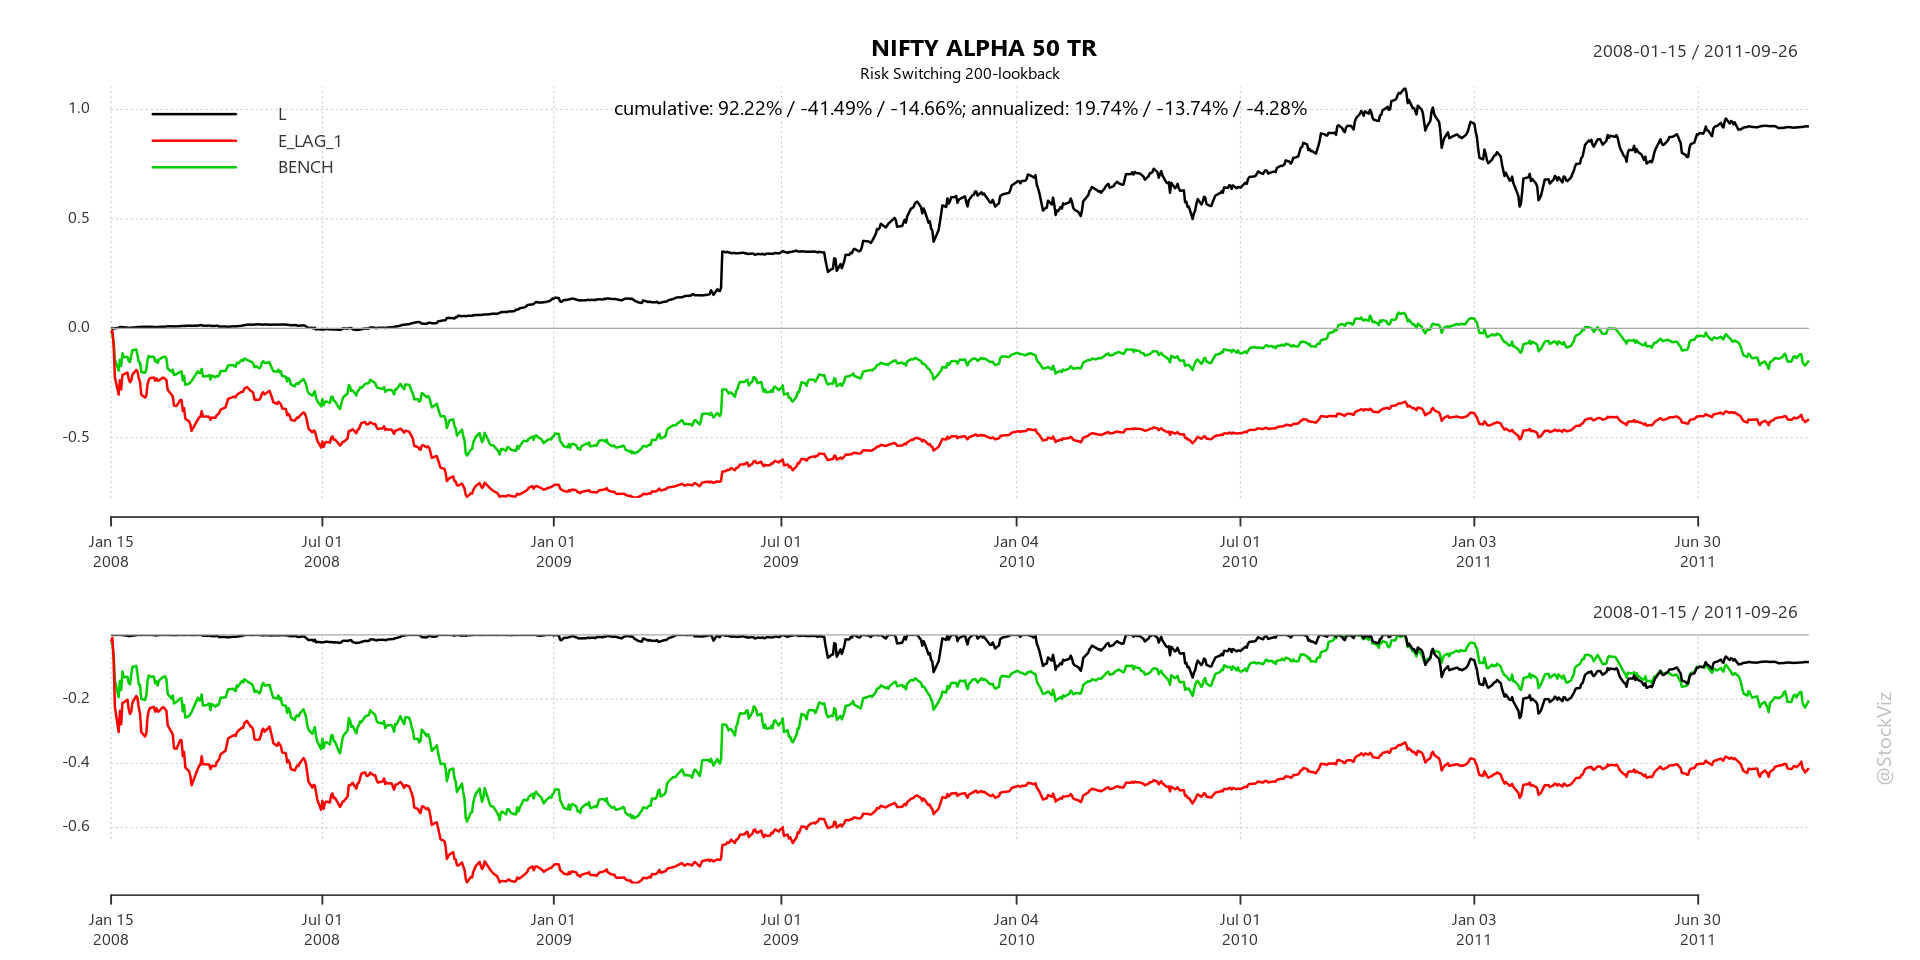
One way to go about this is to use gradient descent. Start with a random portfolio and go in the direction that minimizes variance (min-var) or expected tail loss (min-ETL)
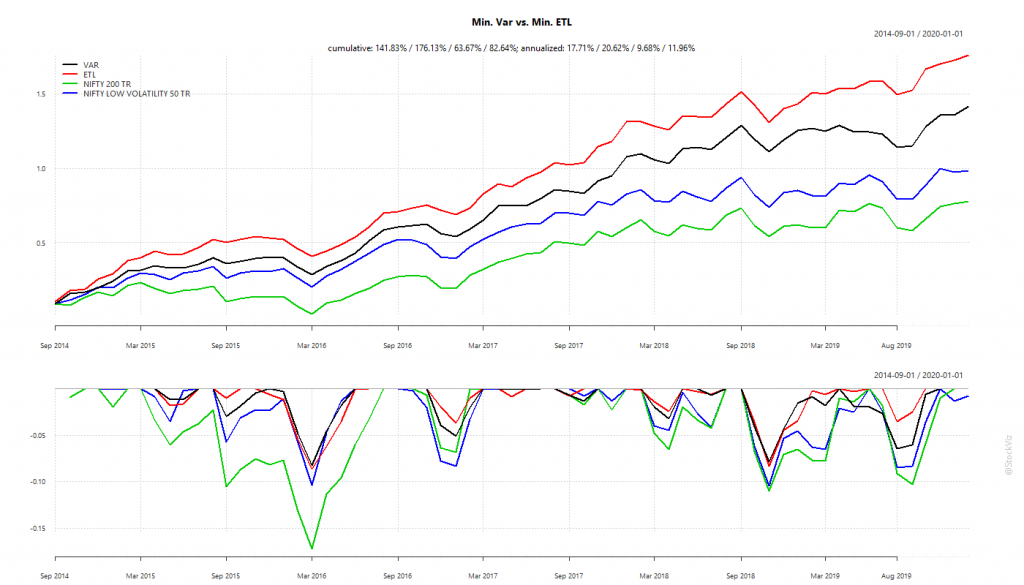
With a monthly rebalance, the chances of the portfolio getting trapped in a local-minima are low. And the backtest looks promising.
Investing in Low-Volatility Portfolios
Equity investors can map our Minimum Variance and Minimum ETL Themes to their portfolios to gain exposure to these low-vol strategies.