Tag: VIX

Historical vs. Implied Volatility

India VIX is a volatility index computed by NSE based on the order book of NIFTY Options. For this, the best bid-ask quotes of near and next-month NIFTY options contracts. India VIX indicates the investor’s perception of the market’s volatility in the near term i.e. it depicts the expected market volatility over the next 30 calendar days. Higher the India VIX values, higher the expected volatility and vice versa. (NSE)

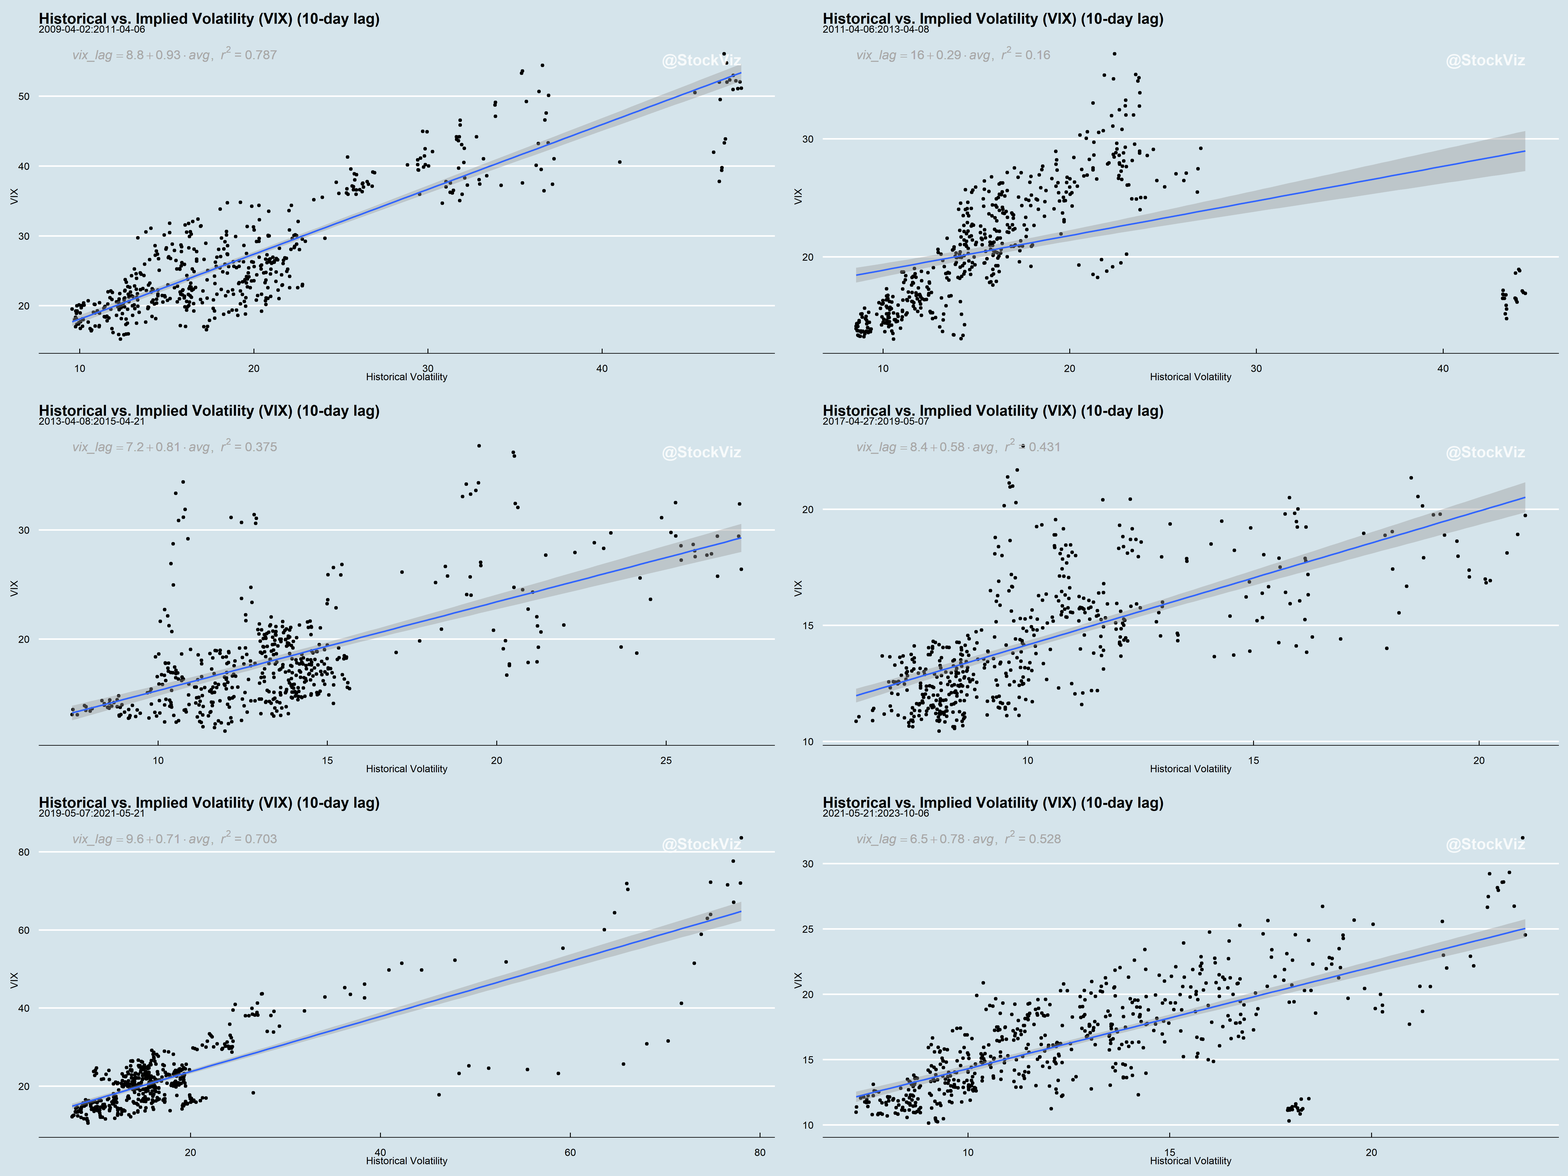
Does the actual volatility come close what the VIX was implying 30 calendar days before? Not always and probably never.

What if it’s pricing something more immediate? Here’s the regression with a 10-day lag:

Regression with no lag:

The relationship between implied and historical is one of those things that are directionally true… sometimes.

Code and charts on github.

VIX Seasonality

Is India VIX seasonal? Yes.

There is a huge amount of dispersion in the daily data when grouped by months. Taking averages of these may not make much sense.

However, when you decompose the series, you get some interesting monthly seasonality.

Zooming into the “season_year” chart:

If you transform the seasonality component and plot it by month, you’ll notice why everybody gets nervous in May.

Code and charts on github.

Hamming Distance

Previously, we discussed how removing information from data can be useful. And our discussion on using Euclidean Distance for Pattern Matching showed how you can use a rolling window to identify matching segments within a time-series. What if we mix the two ideas together?

If you transform a time-series of returns to 0-1, then we can use Hamming distance, a measure the minimum number of substitutions required to change one string into the other (Wikipedia,) as a measure of similarity.

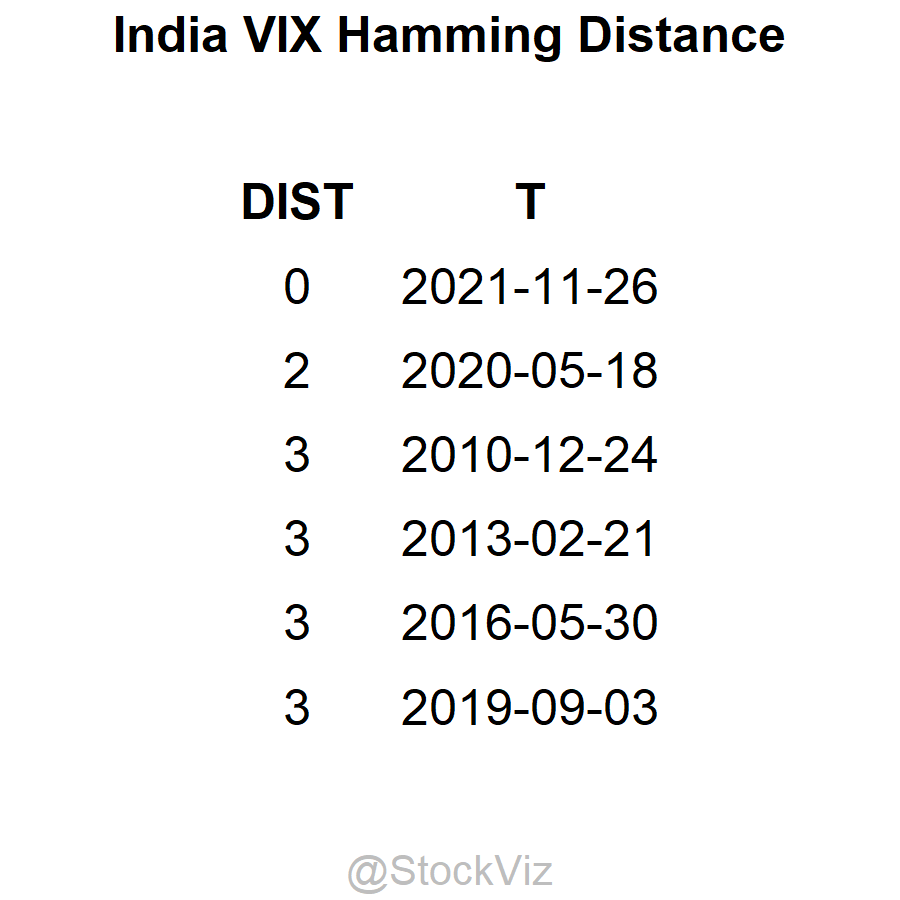
For example, take the most recent 20-day VIX time-series and “match” it with a rolling window of historical 20-day VIX segments and sort it by its Hamming Distance.

Here, on the second row, we see that by just flipping two bits, the 20-day sequence ending on 2020-05-18 matches with the 20-day sequence ending 2021-11-16.
If you are looking for a rough up/down days match, then this is a blistering fast way to compute it.

Euclidean Distance for Pattern Matching

Most of us have learnt how to calculate the distance between 2 points on a plane in high school. The simplest one is called the Euclidean Distance – a pretty basic application of the Pythagorean Theorem. The concept can be extended to calculate the distance between to vectors. This is where it gets interesting.

Suppose you want to match a price series with another, ranking a rolling window by its Euclidean Distance is the fastest and simplest way of pattern matching.

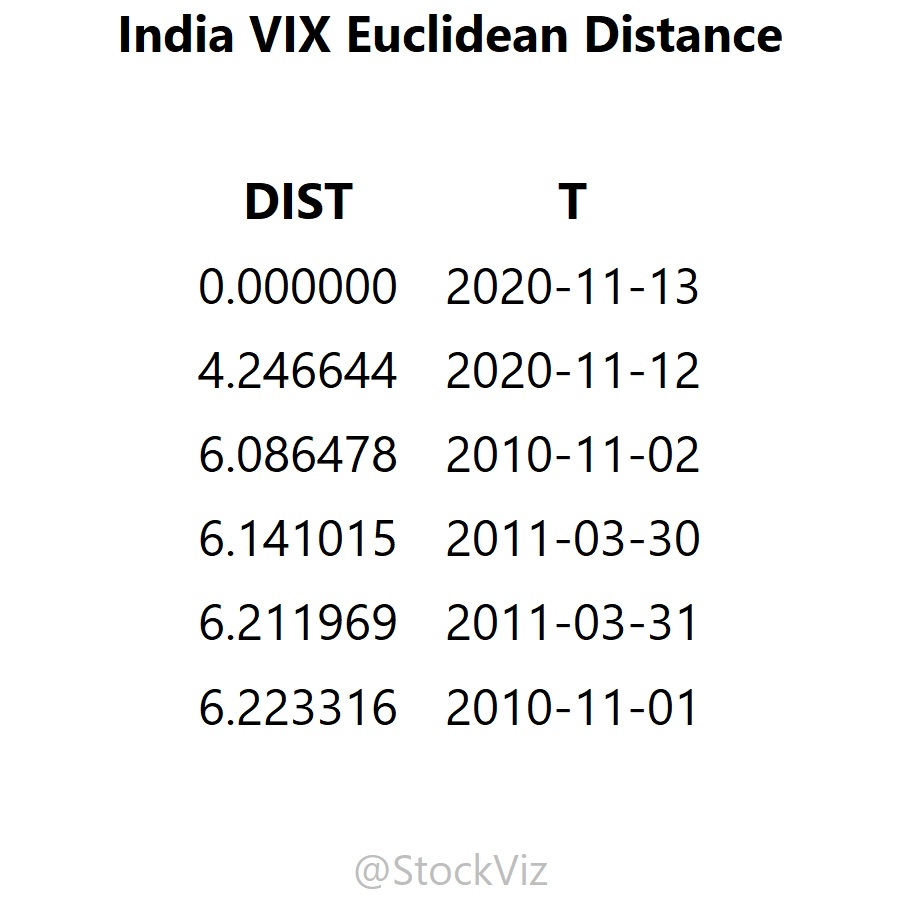
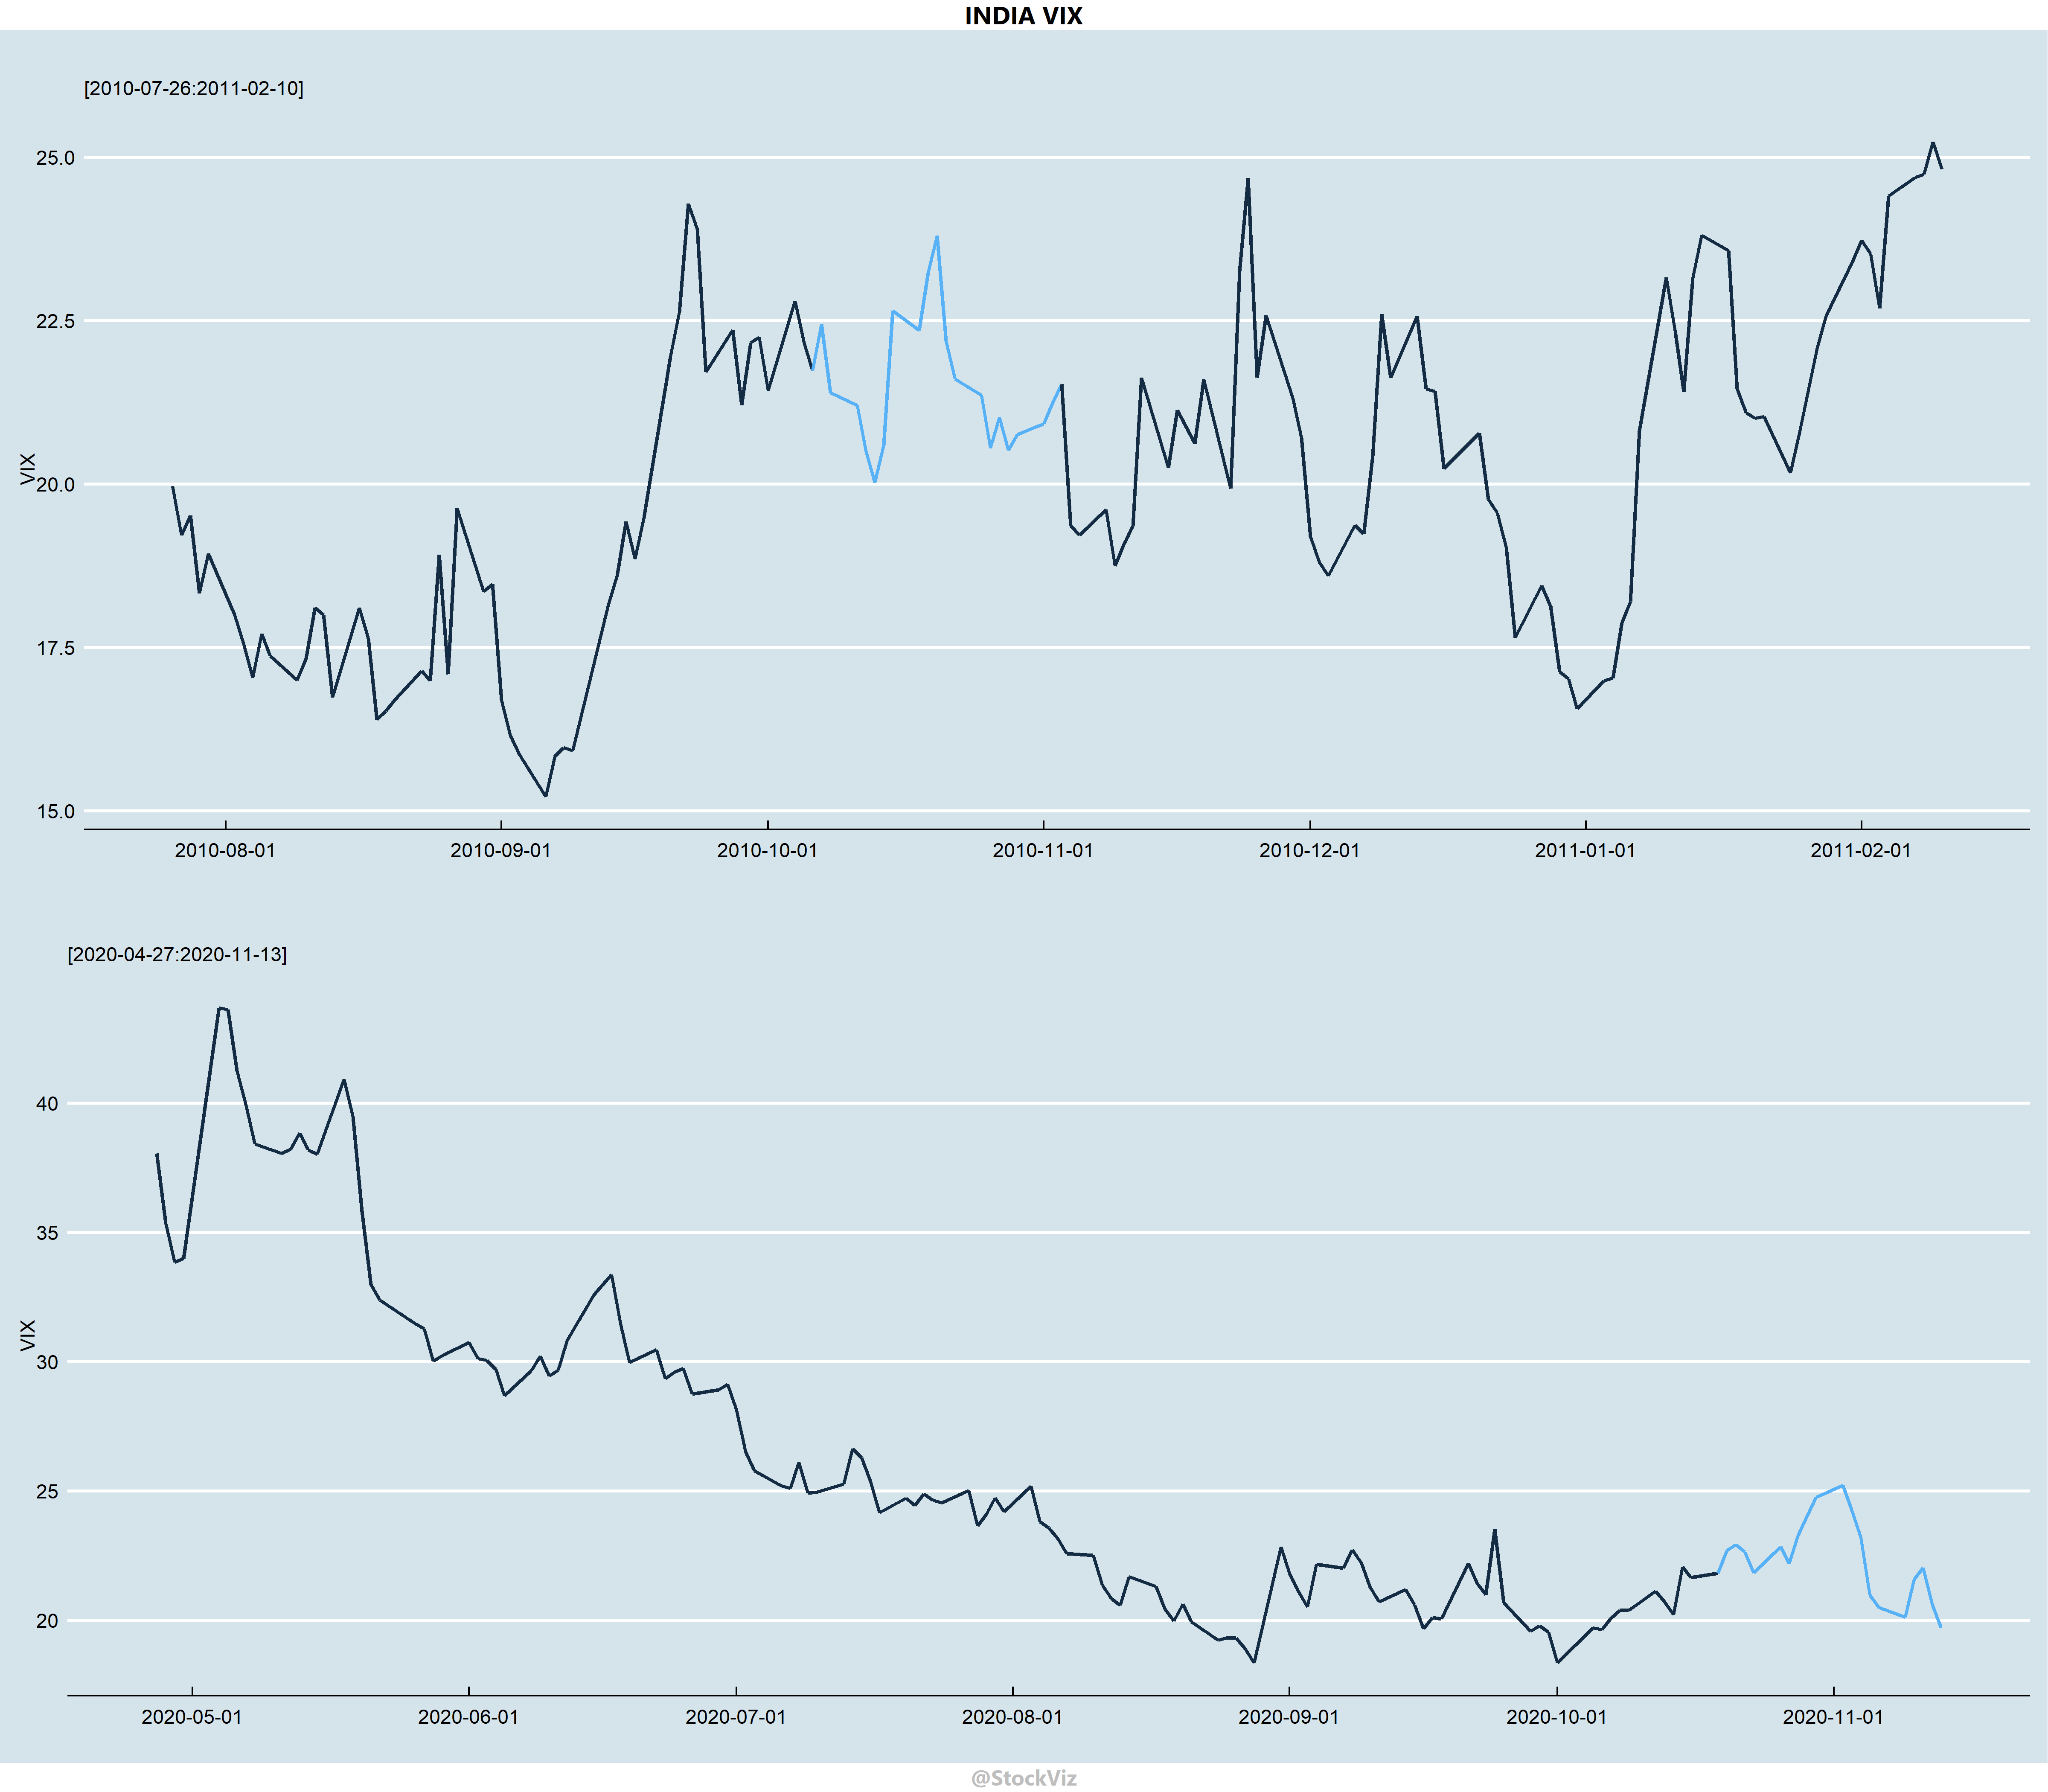
For example, take the most recent 20-day VIX time-series and “match” it with a rolling window of historical 20-day VIX segments and sort it by its Euclidean Distance (ED.)

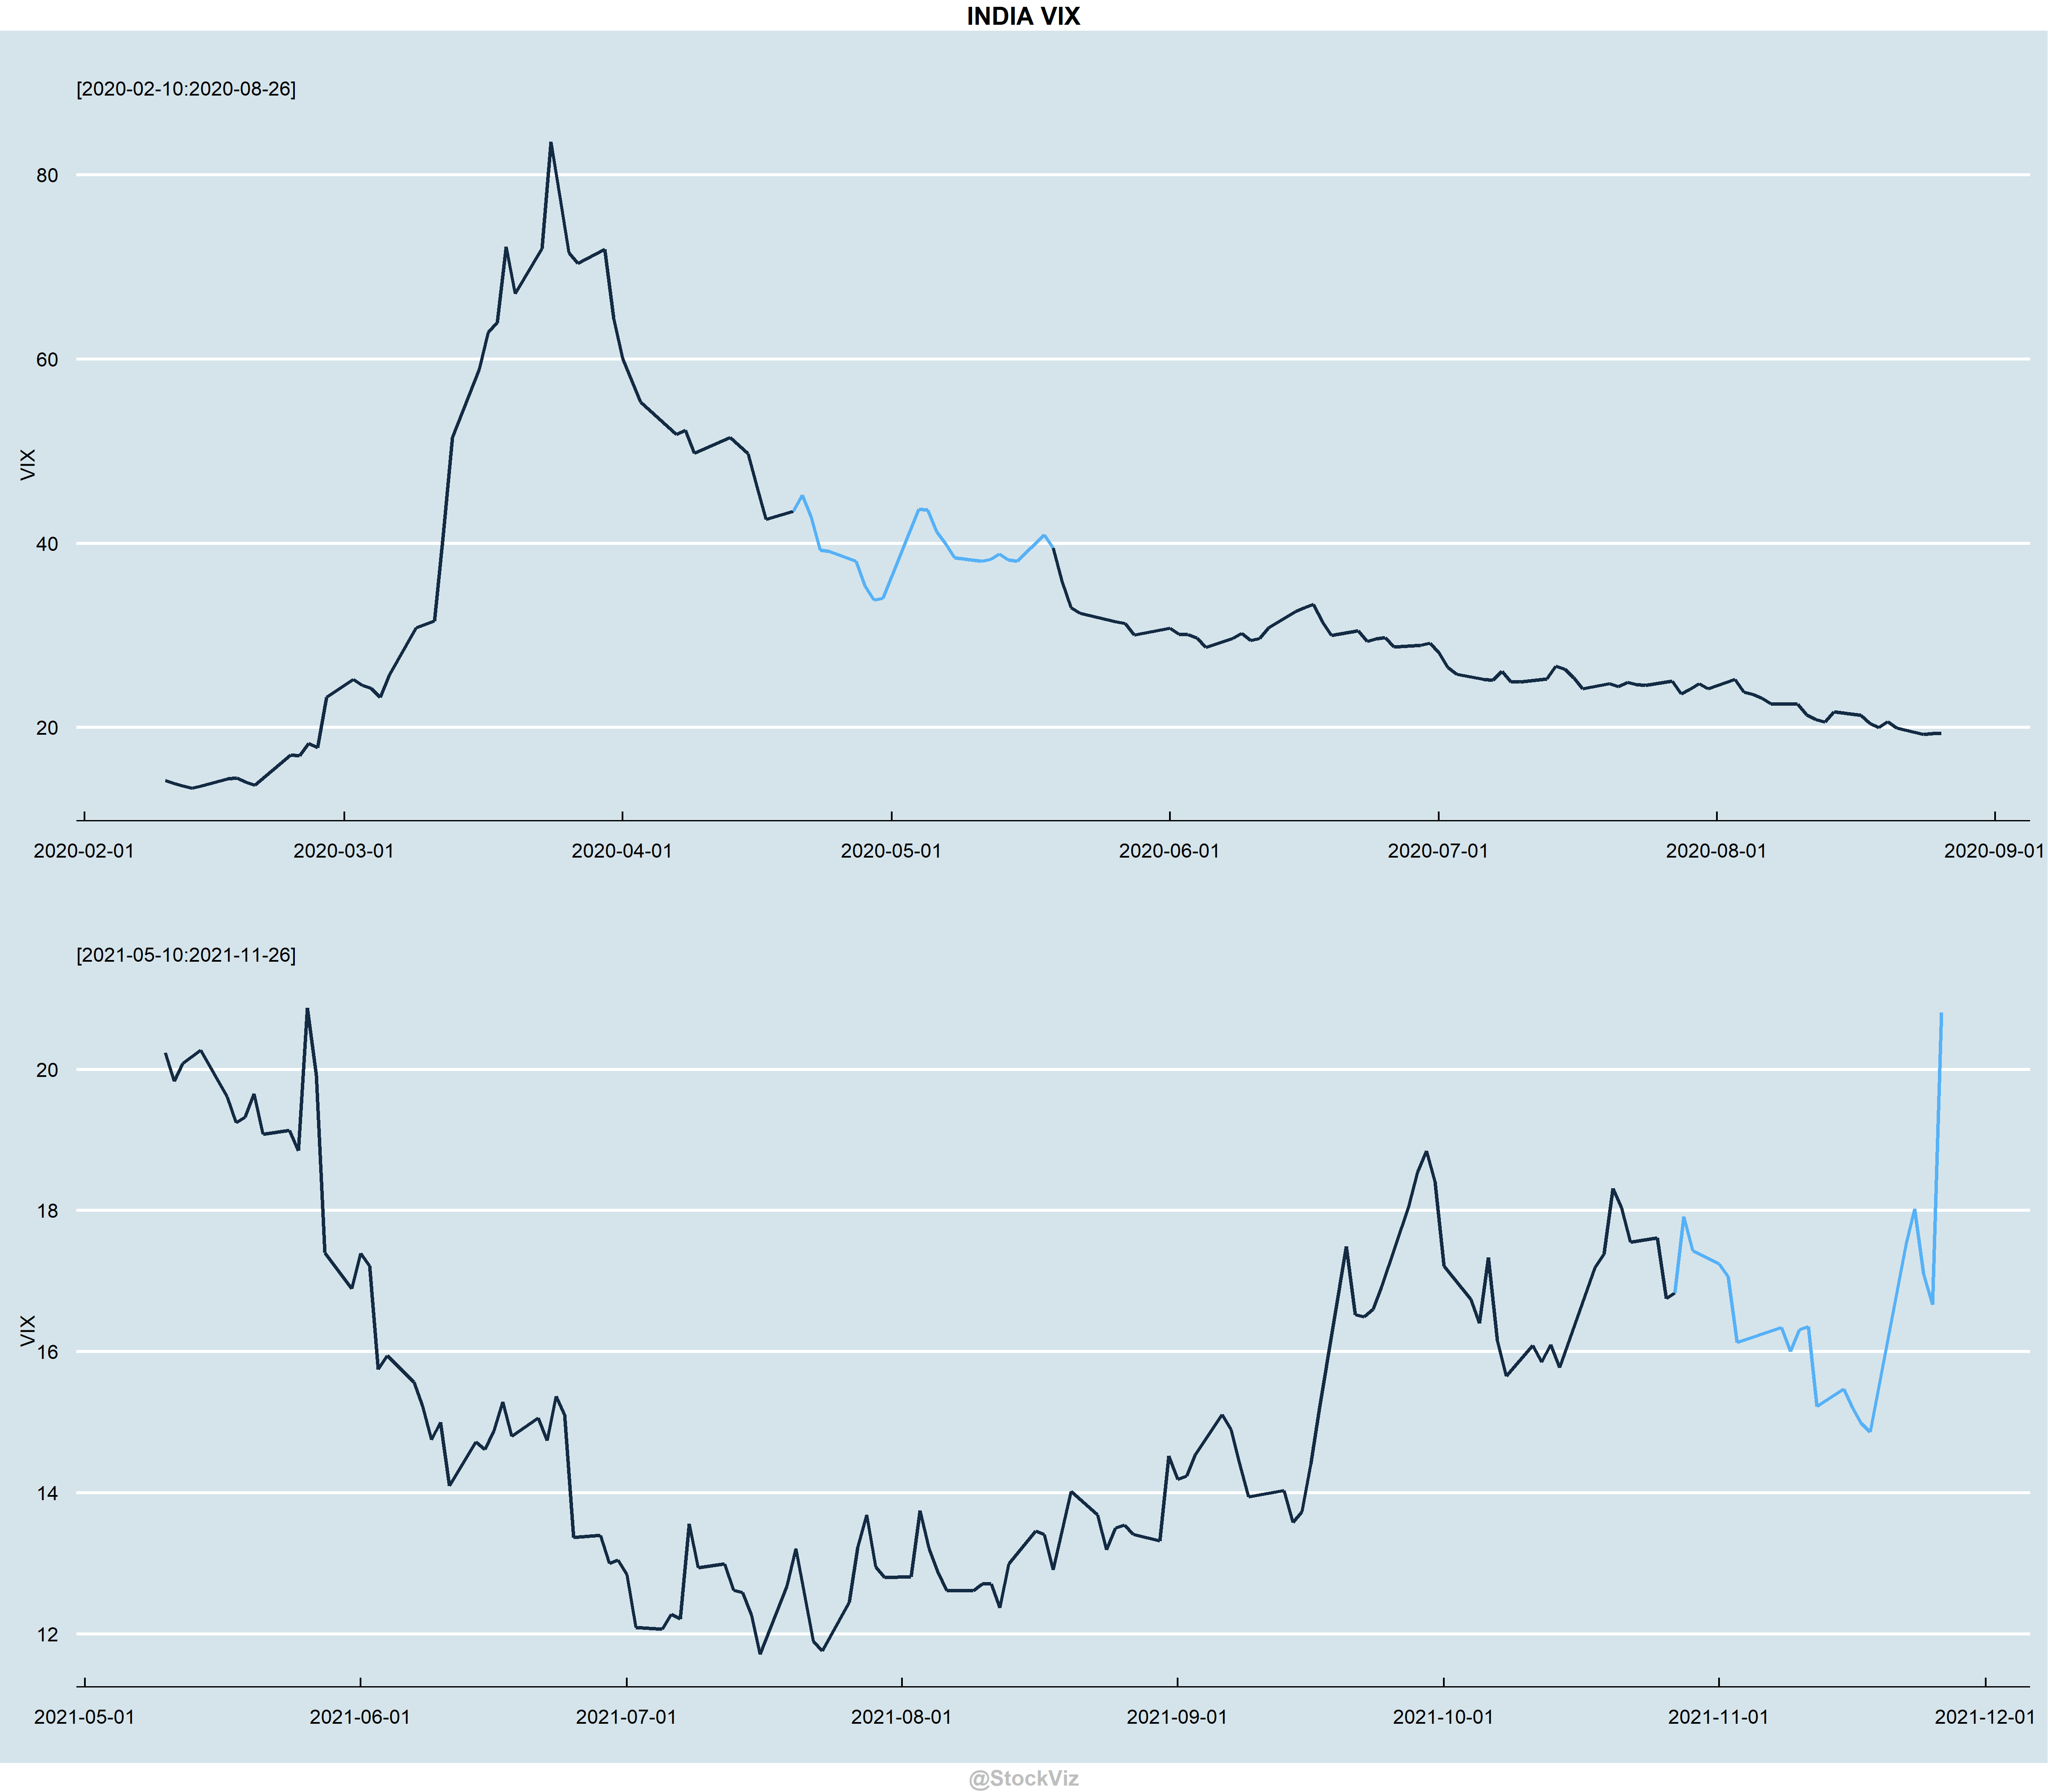
Here, the ED has dug up a segment from November-2010 as one of the top 5 matches. Take a closer look:

While not a perfect match, it “sort of” comes close.

Sometimes, a simple tool is good enough to get you 80% of the way. This is one of them.

VIX and Equity Index Returns, Part II

Please read Part I for the introduction.

Holding-period back-test

In Part I, we ran a quick back-test that would go long the equity index if the VIX was in a certain quintile and saw how the 5th quintile produced the lowest draw-down returns. The index was held only for a day. However, our box-plot of VIX quintile vs. subsequent n-day returns begs us to look at alternate holding periods as well. What would the returns be if we held onto the index beyond a day?

Here is how long-only S&P 500 returns when VIX is in the 5th quintile, across different holding periods looks like:
S&P 500 returns

The problem with this strategy is that when there is a steep fall in the index, the VIX keeps going higher and will be in the 5th quintile for an extended period of time. Have a look at the 2008-2009 segment in this chart:
VIX quintiles over S&P 500

What happens if we used the change in VIX to time the equity index?

VIX returns deciles

If we bucket VIX returns (percentage change over previous close over n-days, 1000 trailing observations) into deciles and observe the next 5, 10, 15 and 20-day returns of the underlying index over them:
S&P 500 returns over changes in VIX

There is no determinable pattern here. Perhaps the VIX and the index are co-incident with none holding the power of prediction over the other.

Interested readers can browse the github repo for corresponding Nikkei 225 and NIFTY 50 charts.