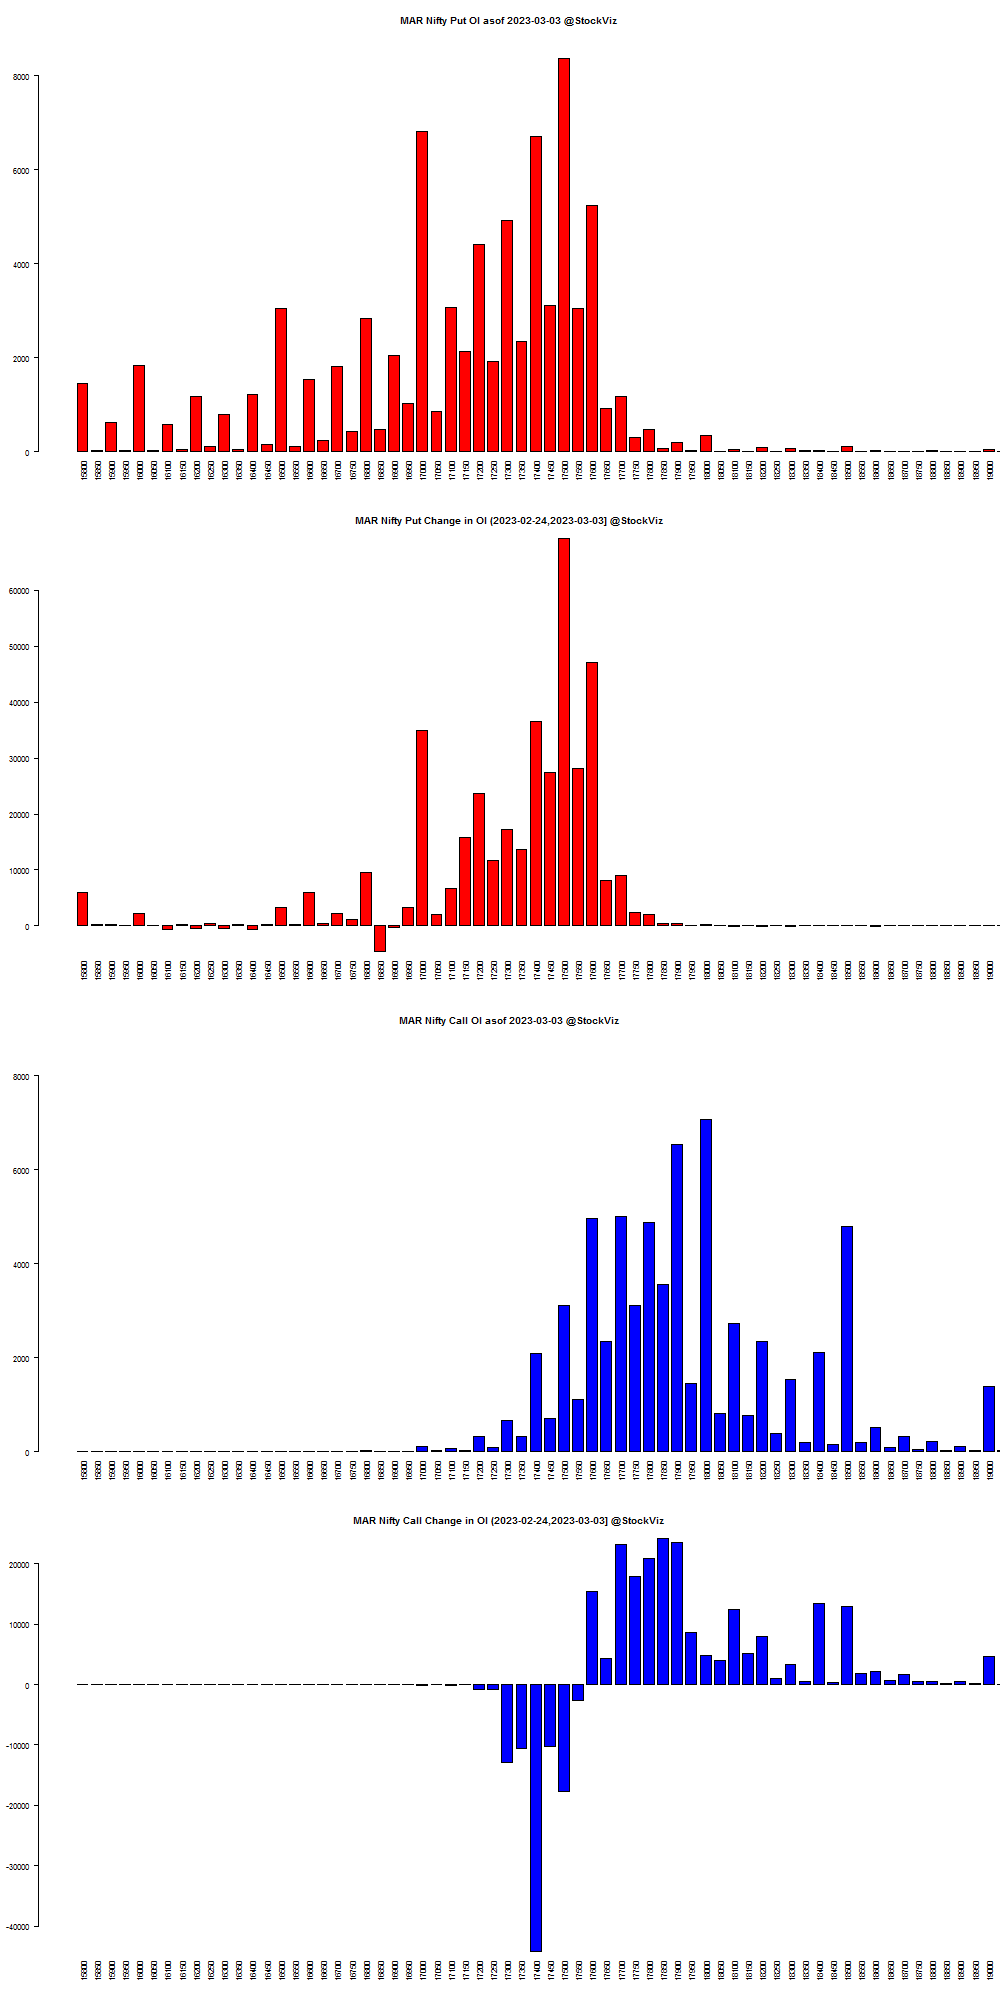
Summary: Mar NIFTY 18000 calls added 65,14,850 contracts while 17400 calls shed 44,21,500. On the Put side of the equation, the 17500 strike added 80,10,000 while the 16850’s shed 4,60,800.
MAR NIFTY OI
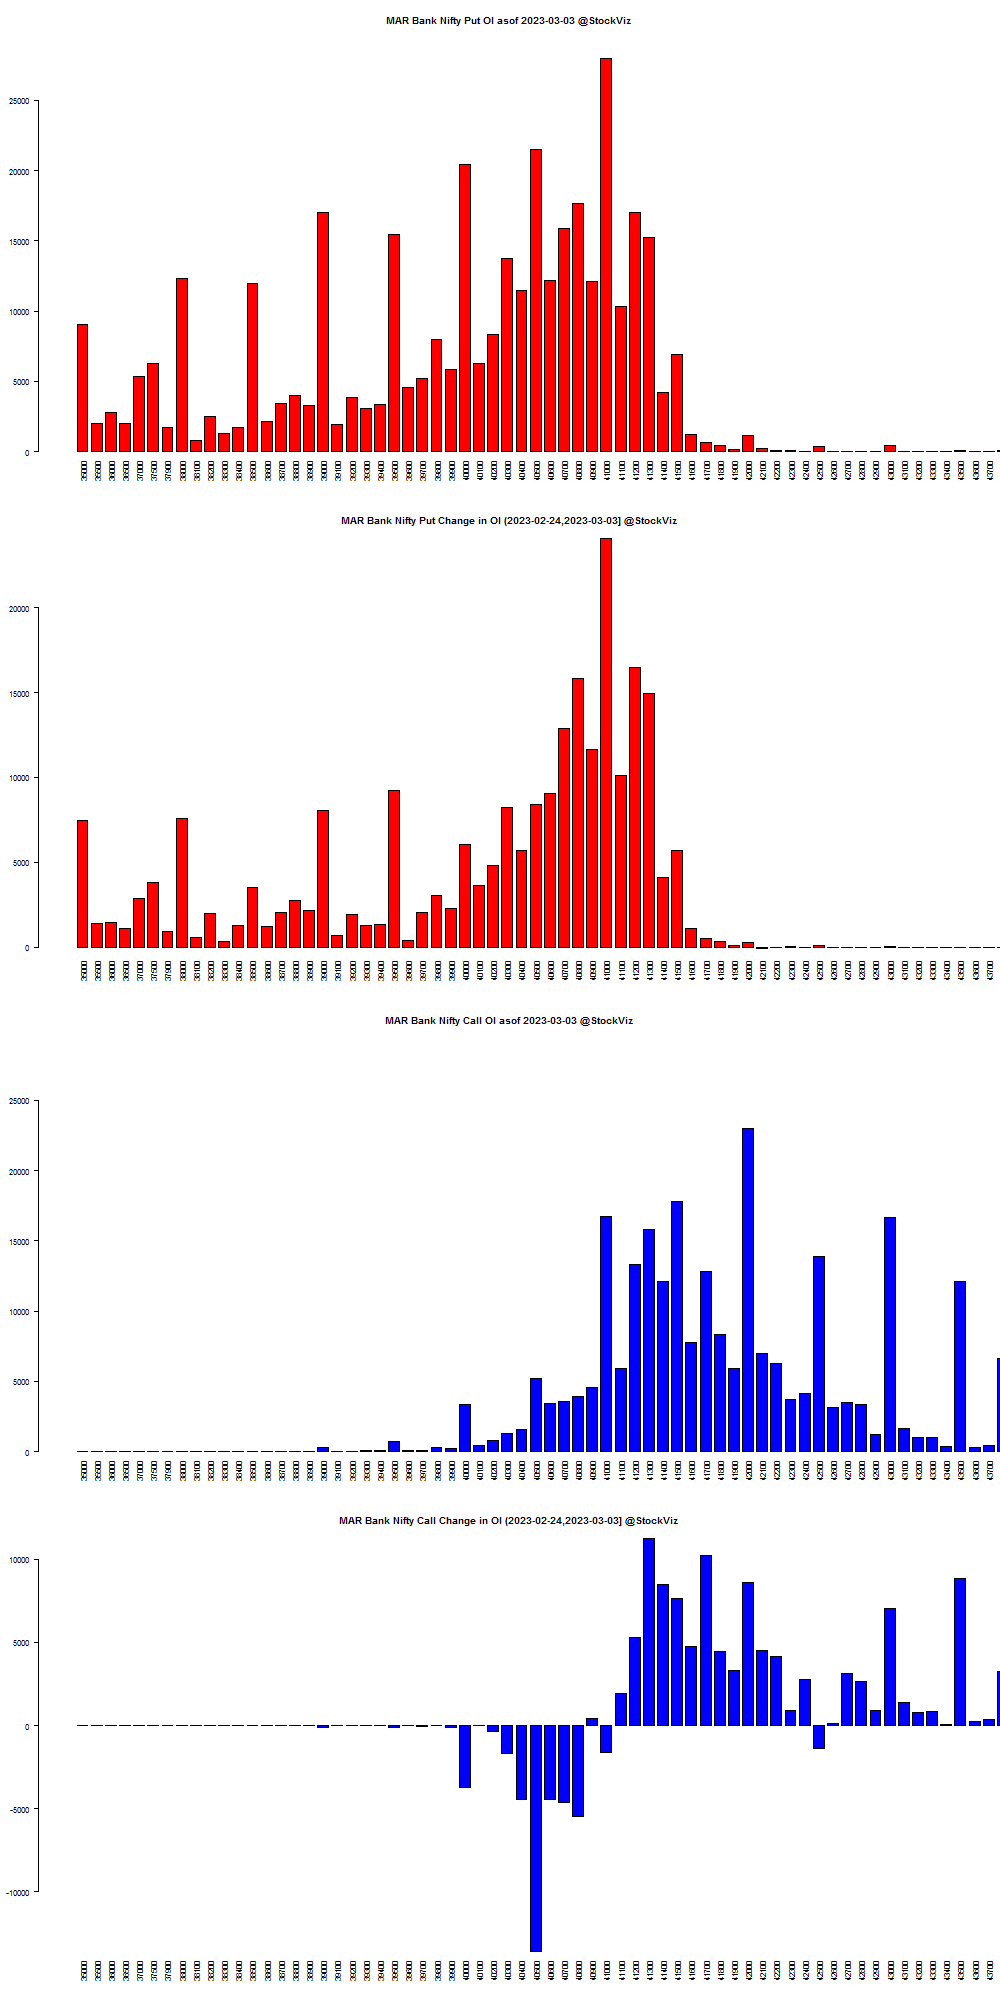
MAR BANKNIFTY OI
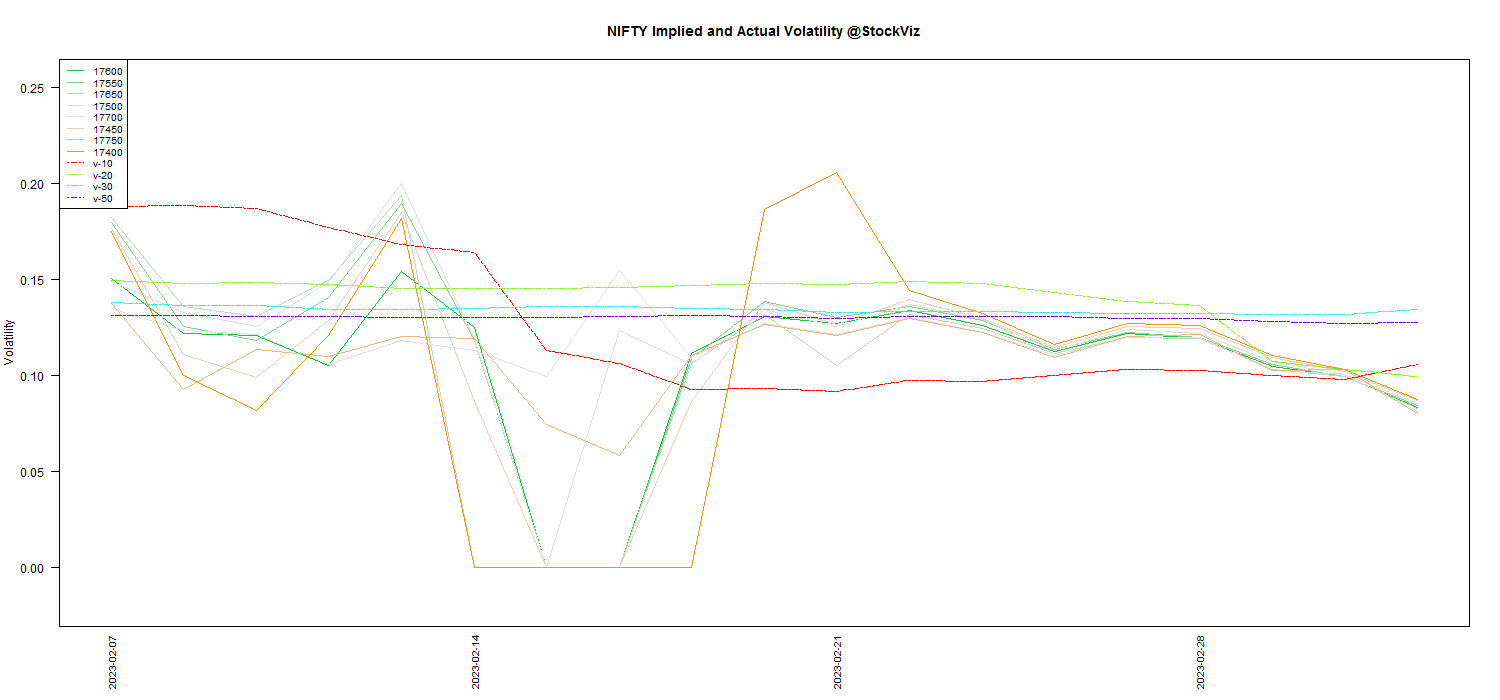
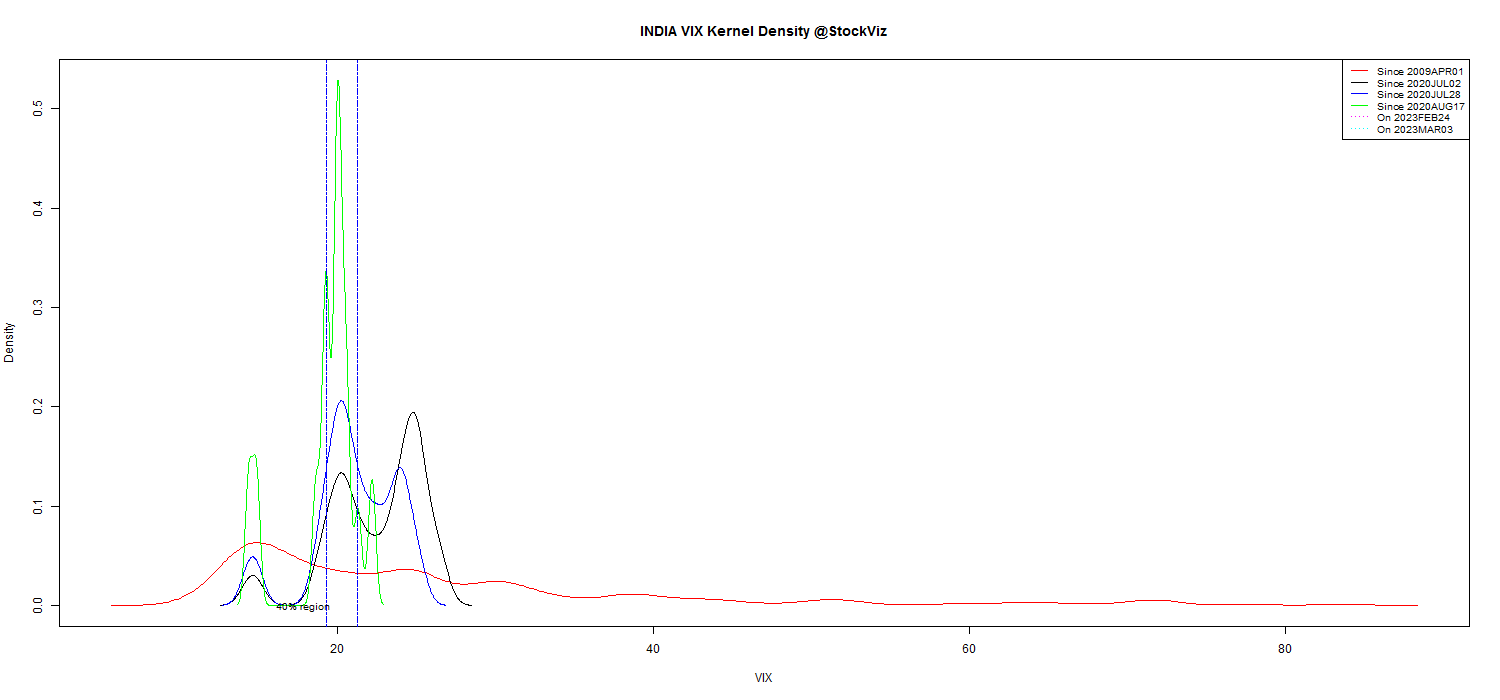
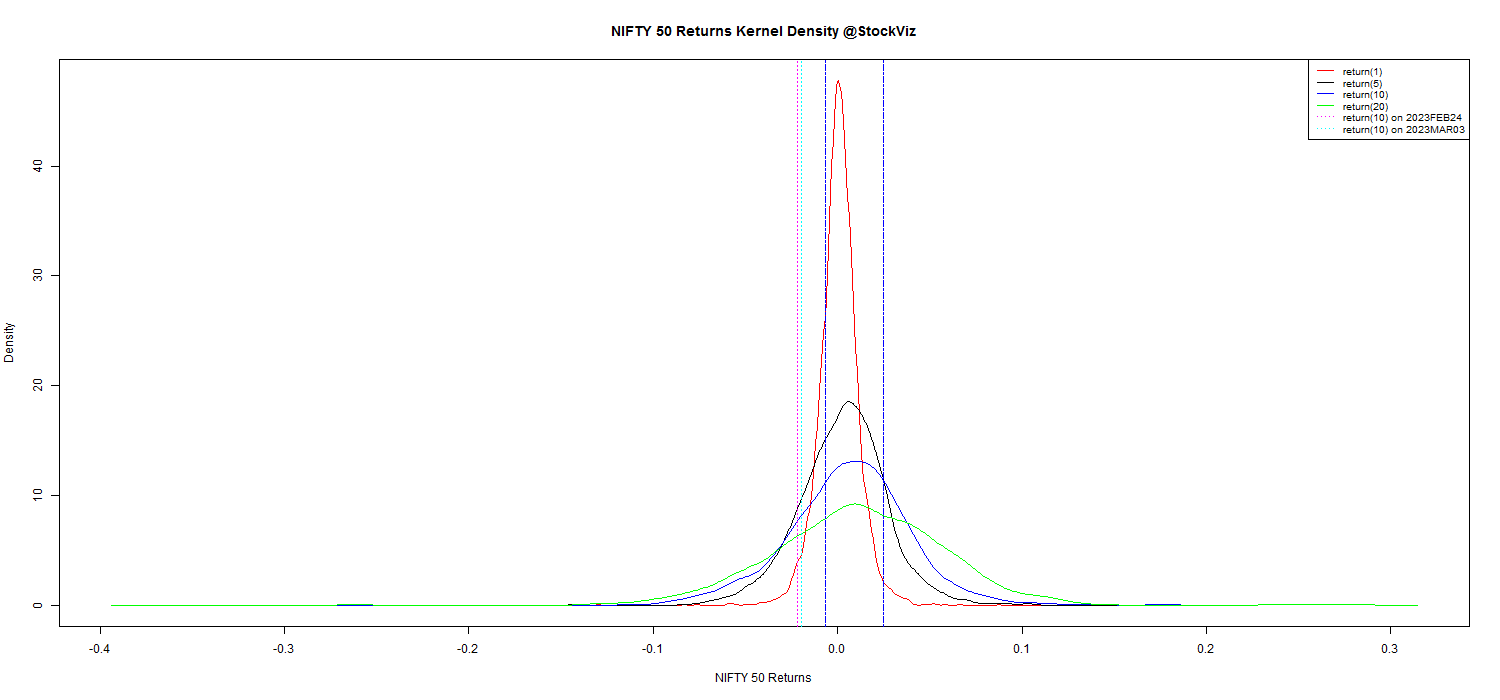
MAR NIFTY Volatility
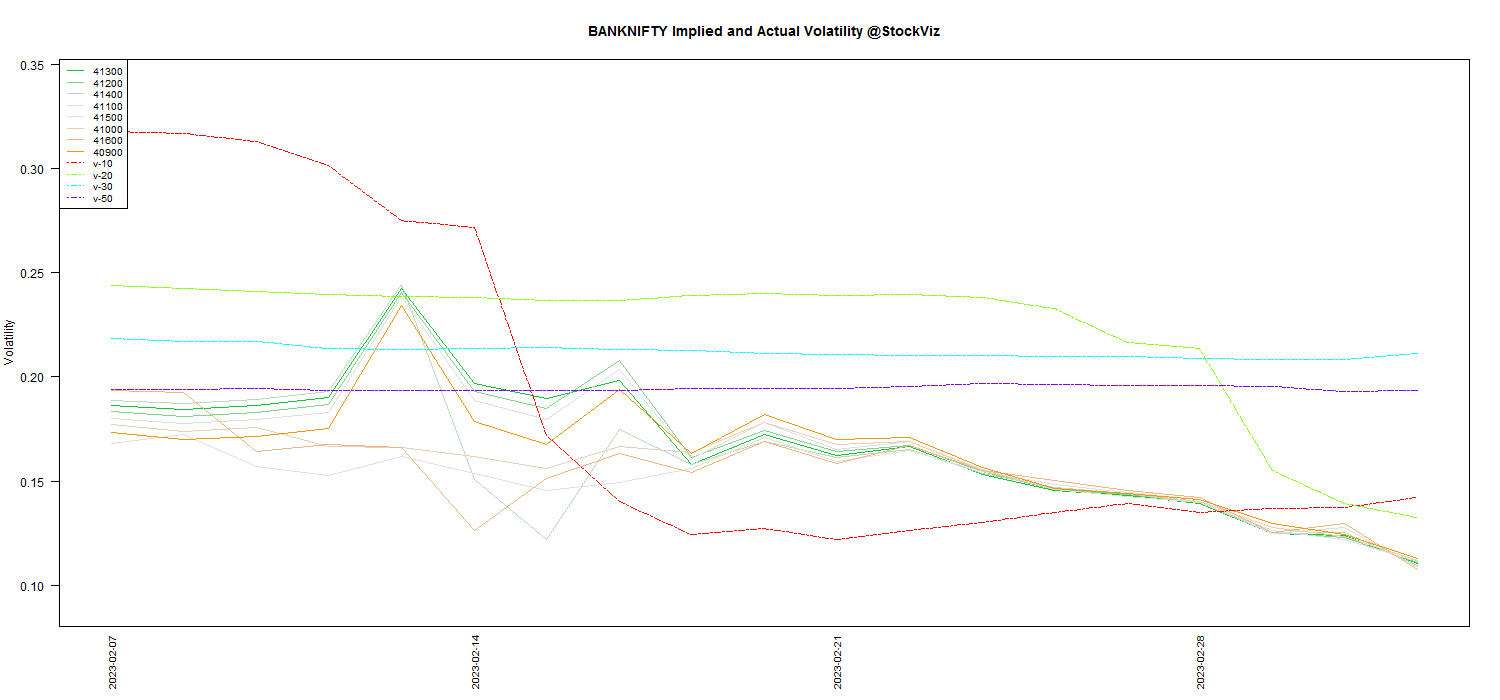
MAR BANKNIFTY Volatility
Dotted lines indicated actual underlying volatility. Solid lines are IVs.
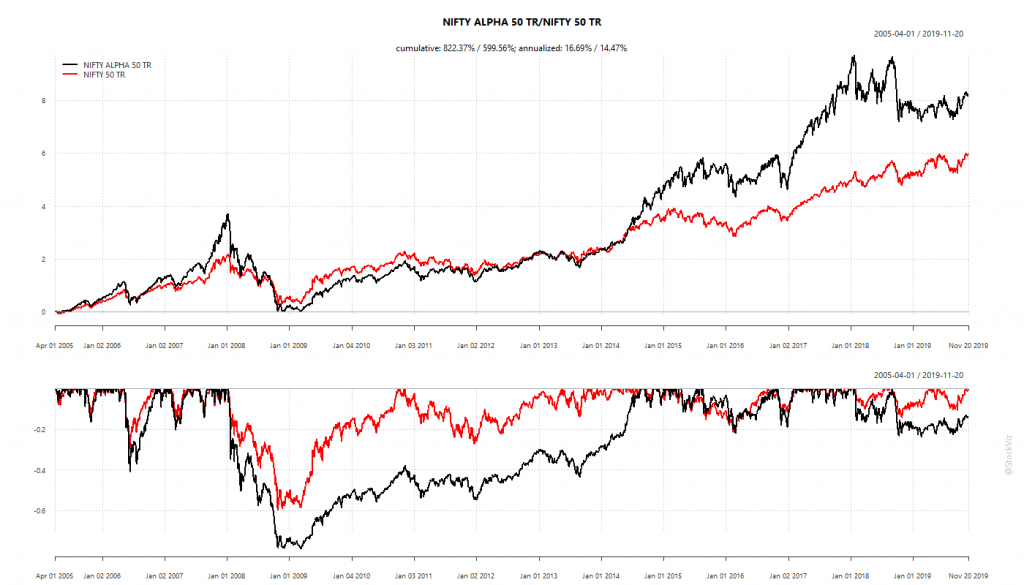
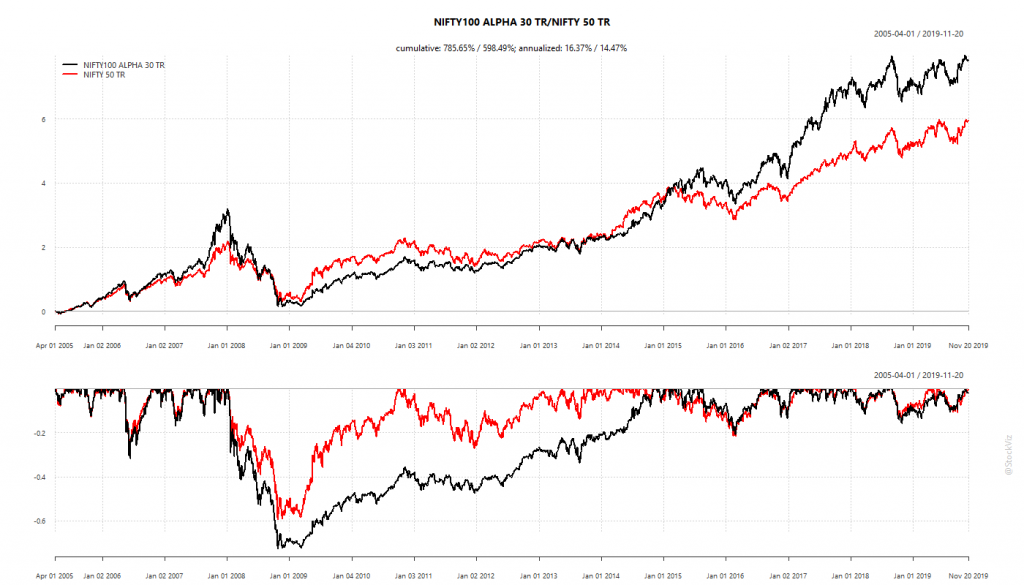
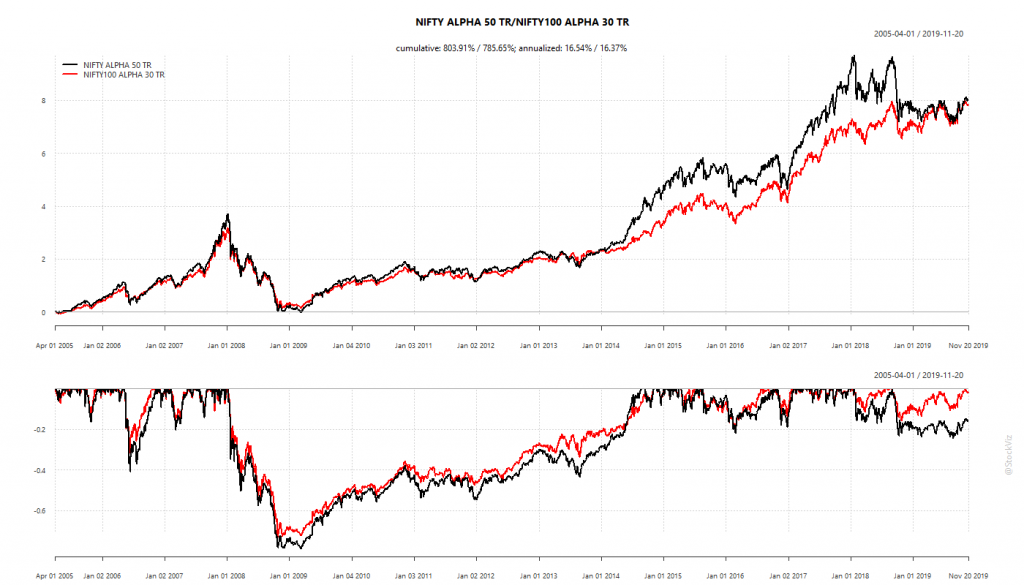
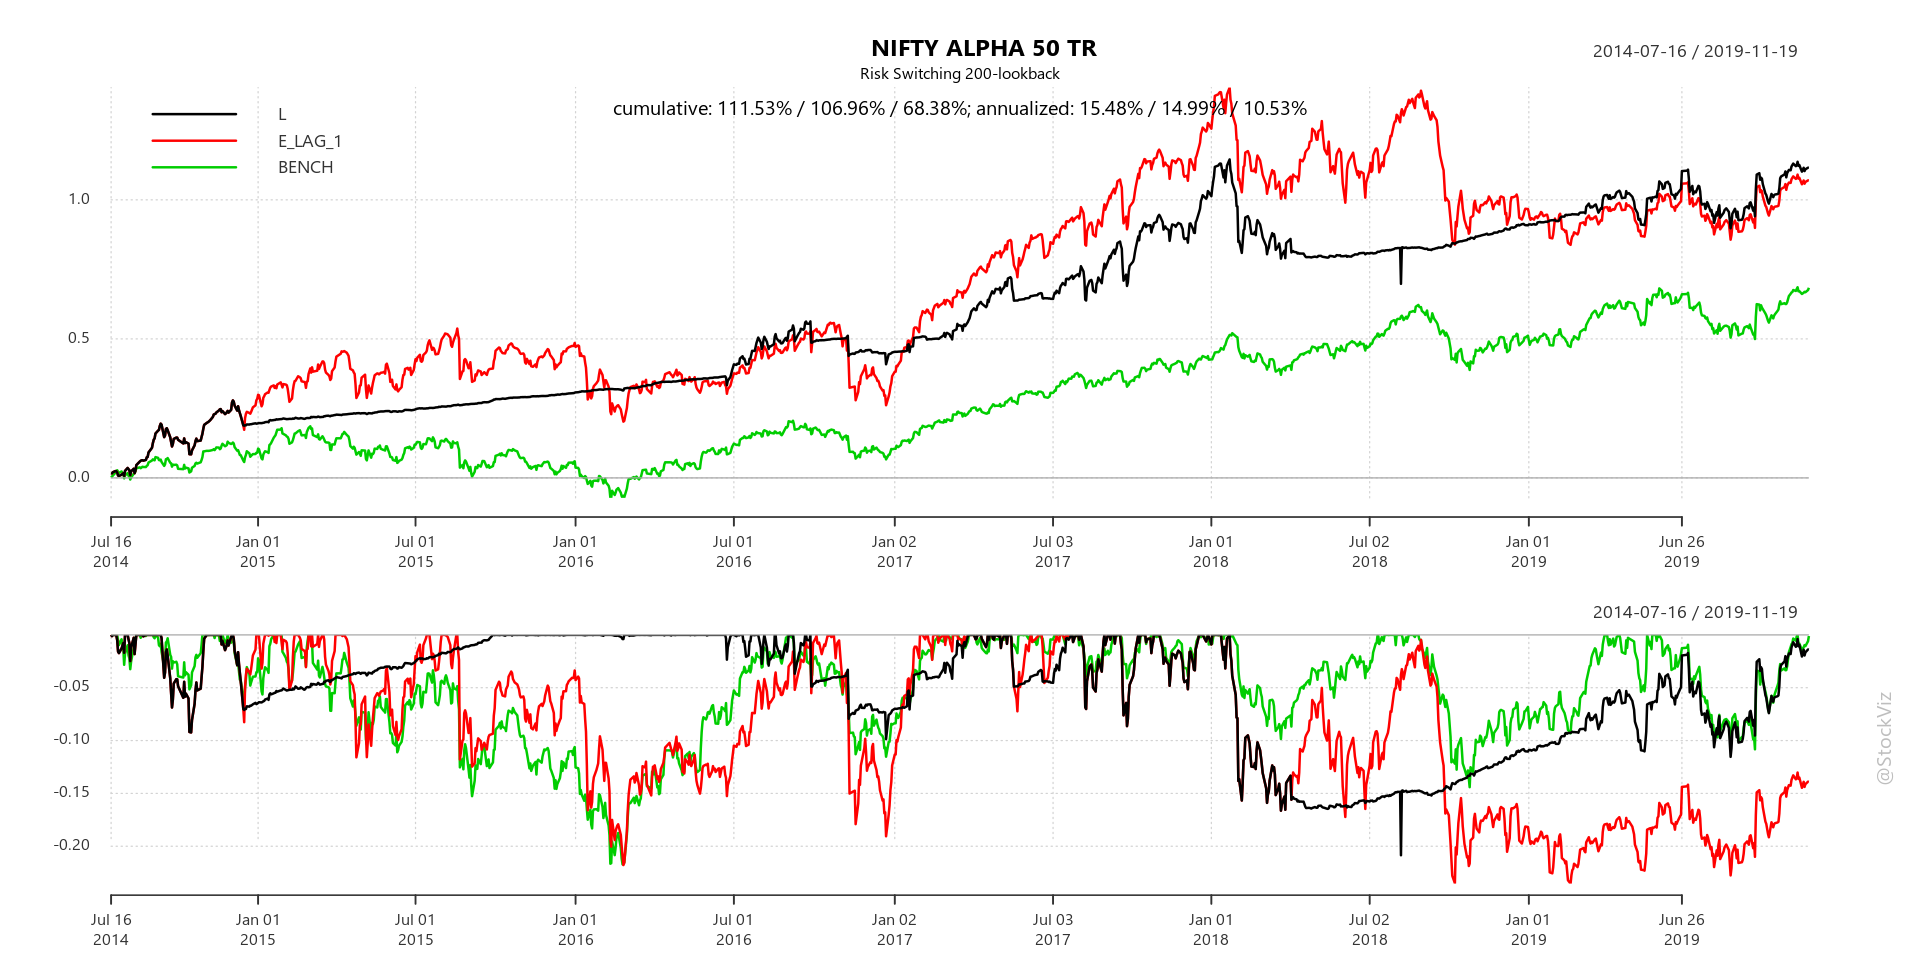
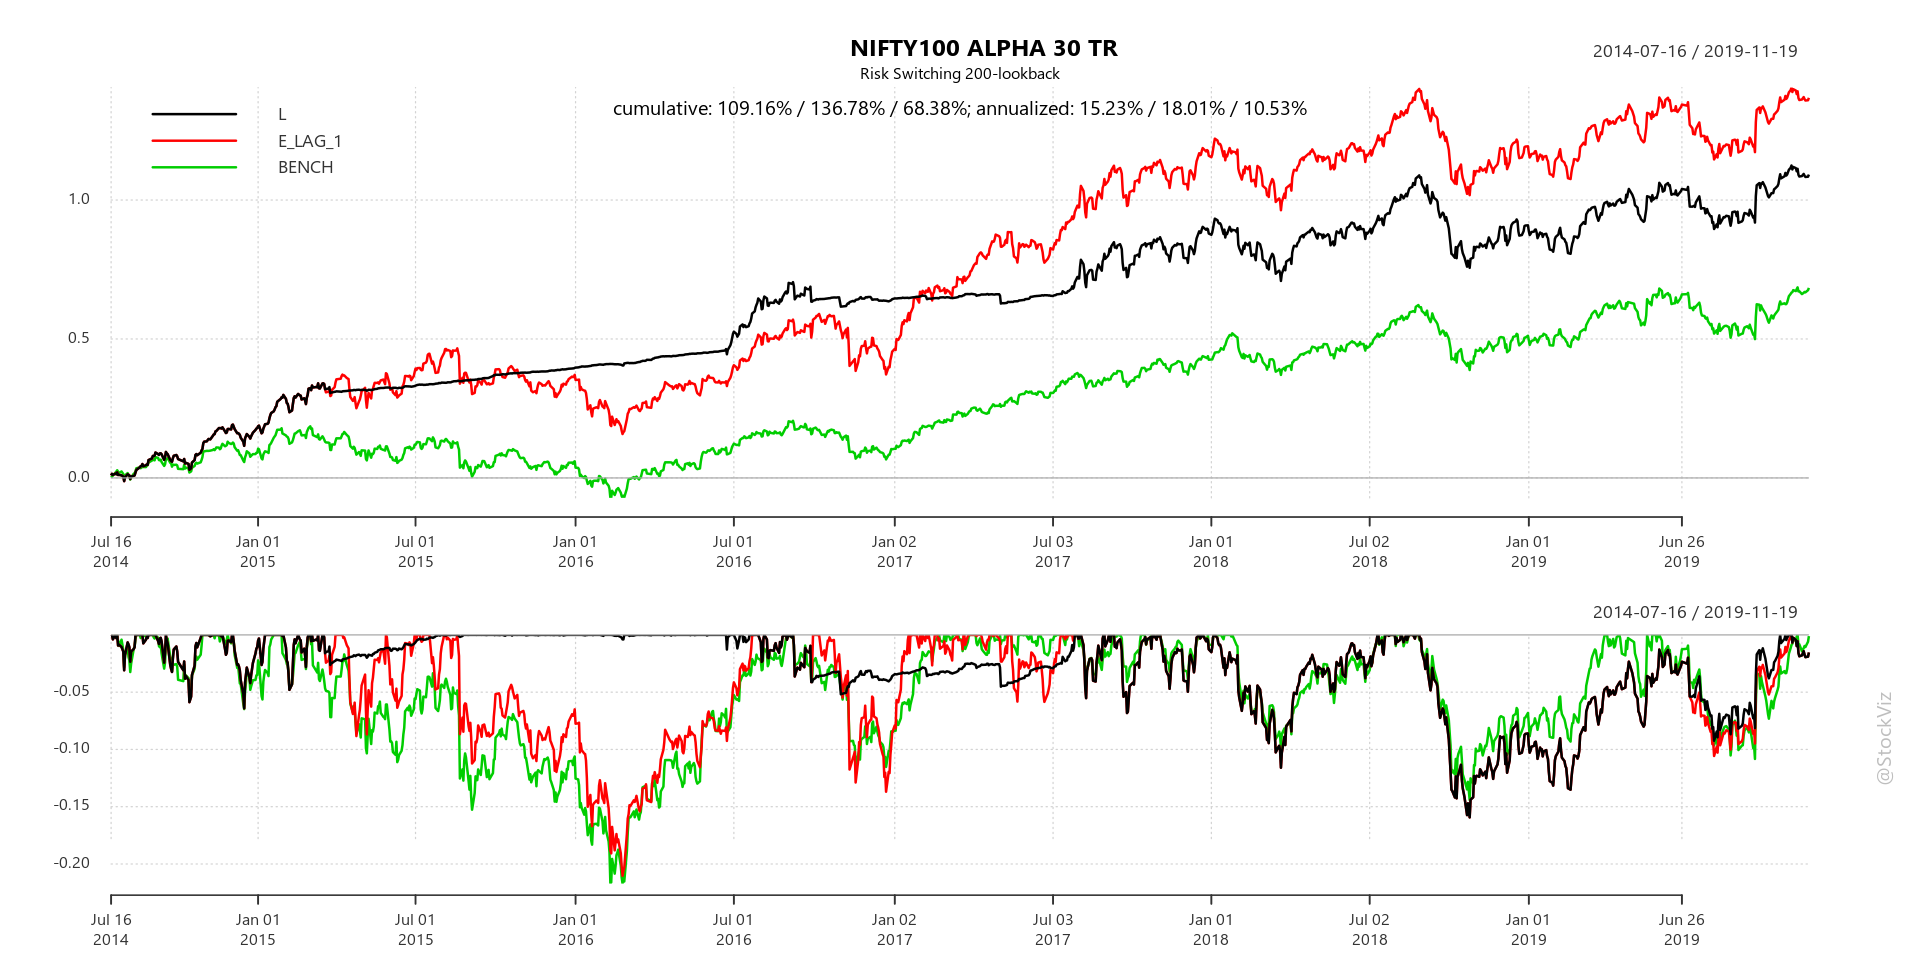
The NSE has a couple of strategy indices – the NIFTY Alpha 50 Index and the NIFTY100 Alpha 30 Index – based on historical CAPM alphas. The former selects 50 stocks from the largest 300 stocks whereas the latter selects 30 stocks from the NIFTY 100 index.
First, a look at a simple buy-and-hold strategy.
Buy-and-Hold Curves
NIFTY ALPHA 50 TR vs NIFTY 50 TRNIFTY100 ALPHA 30 TR vs NIFTY 50 TRNIFTY ALPHA 50 TR vs NIFTY100 ALPHA 30 TR
The alpha indices have out-performed the plain-vanilla NIFTY 50. However, what jumps out off the page is the sheer depth and length of the drawdows that these indices have made.
Even though they give vastly better returns than the NIFTY 50 index, the lived experience would be too painful for most investors. Is there a way to reduce these drawdowns while retaining most of the out-performance?
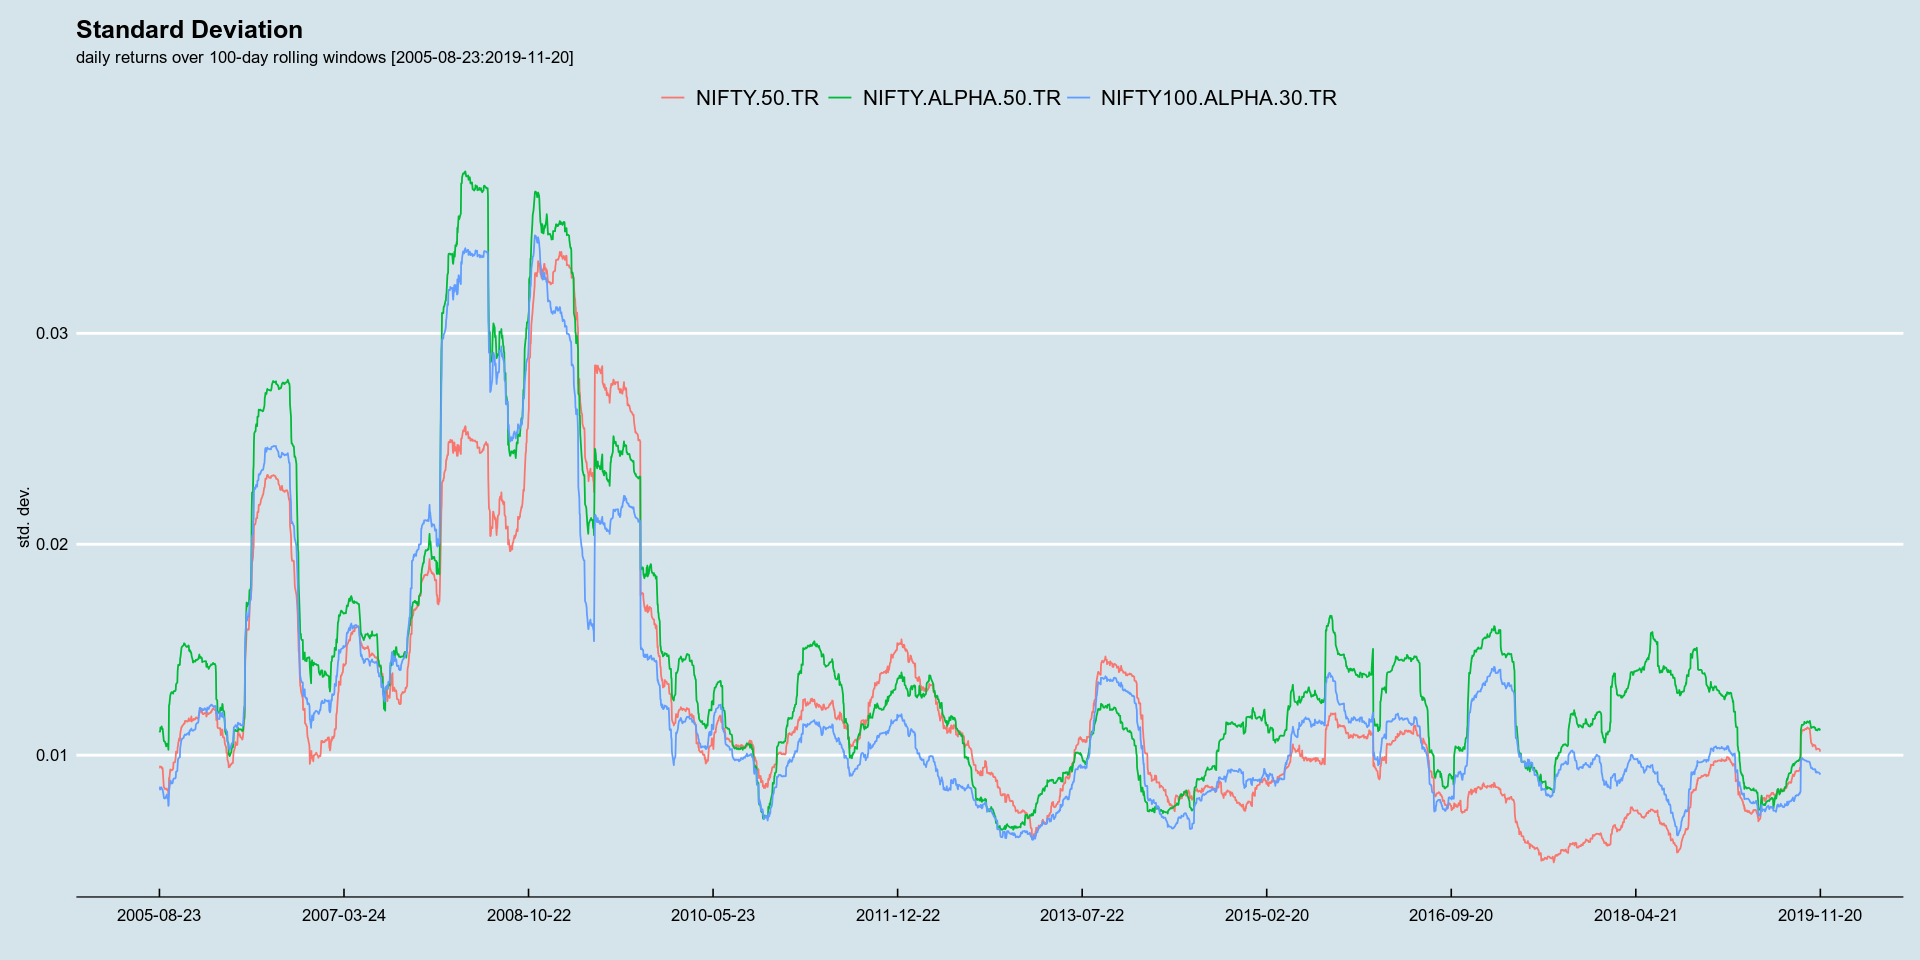
In a 2012 paper, Momentum has its moments, Barroso and Santa-Clara outline a way in which historical volatility could be used to reduce momentum crashes.
Strategy Outline
The basic idea is that momentum risk is time-varying and sticky. And, periods of high risk are followed by low returns.
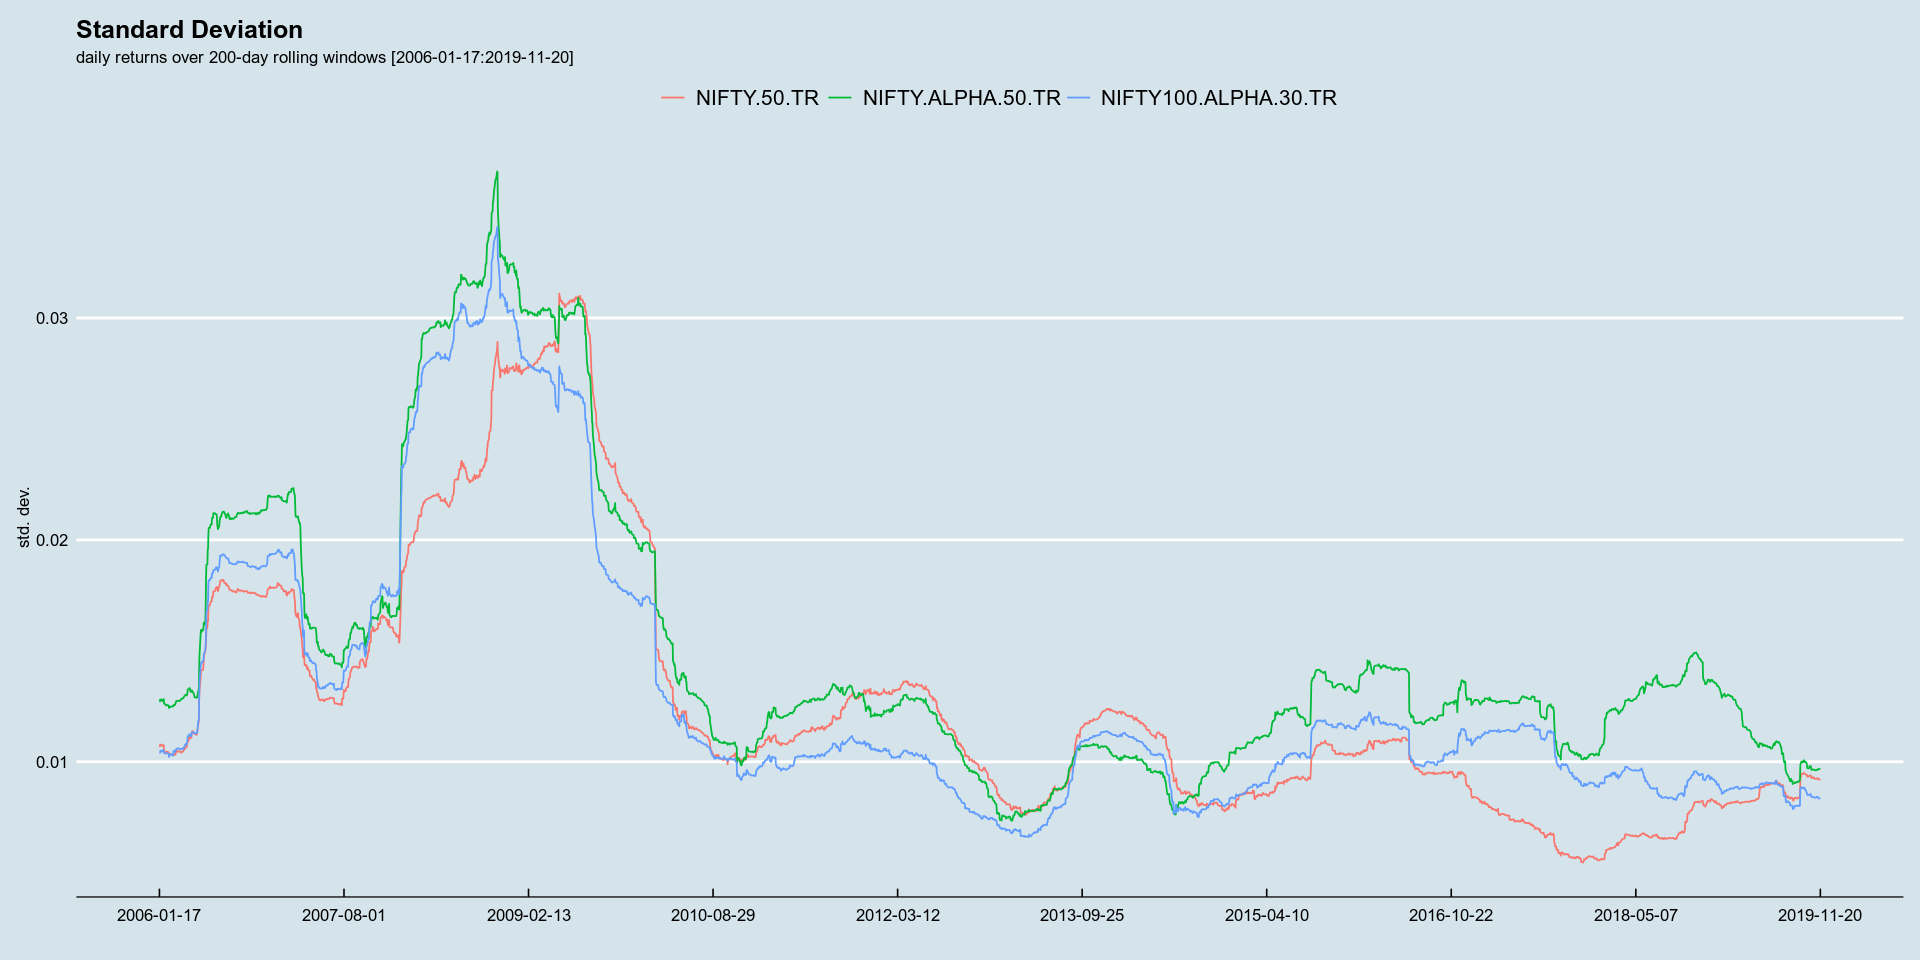
rolling 100-day sd rolling 200-day sd
To test this theory out on the Alpha indices, we first split the time series into halves. The first to “train” and the second to “test.” We need a training set because we are not sure what the appropriate look-back for calculating risk should be (we check 100- and 200-days). The test set is a check of out-of-sample behavior of the strategy.
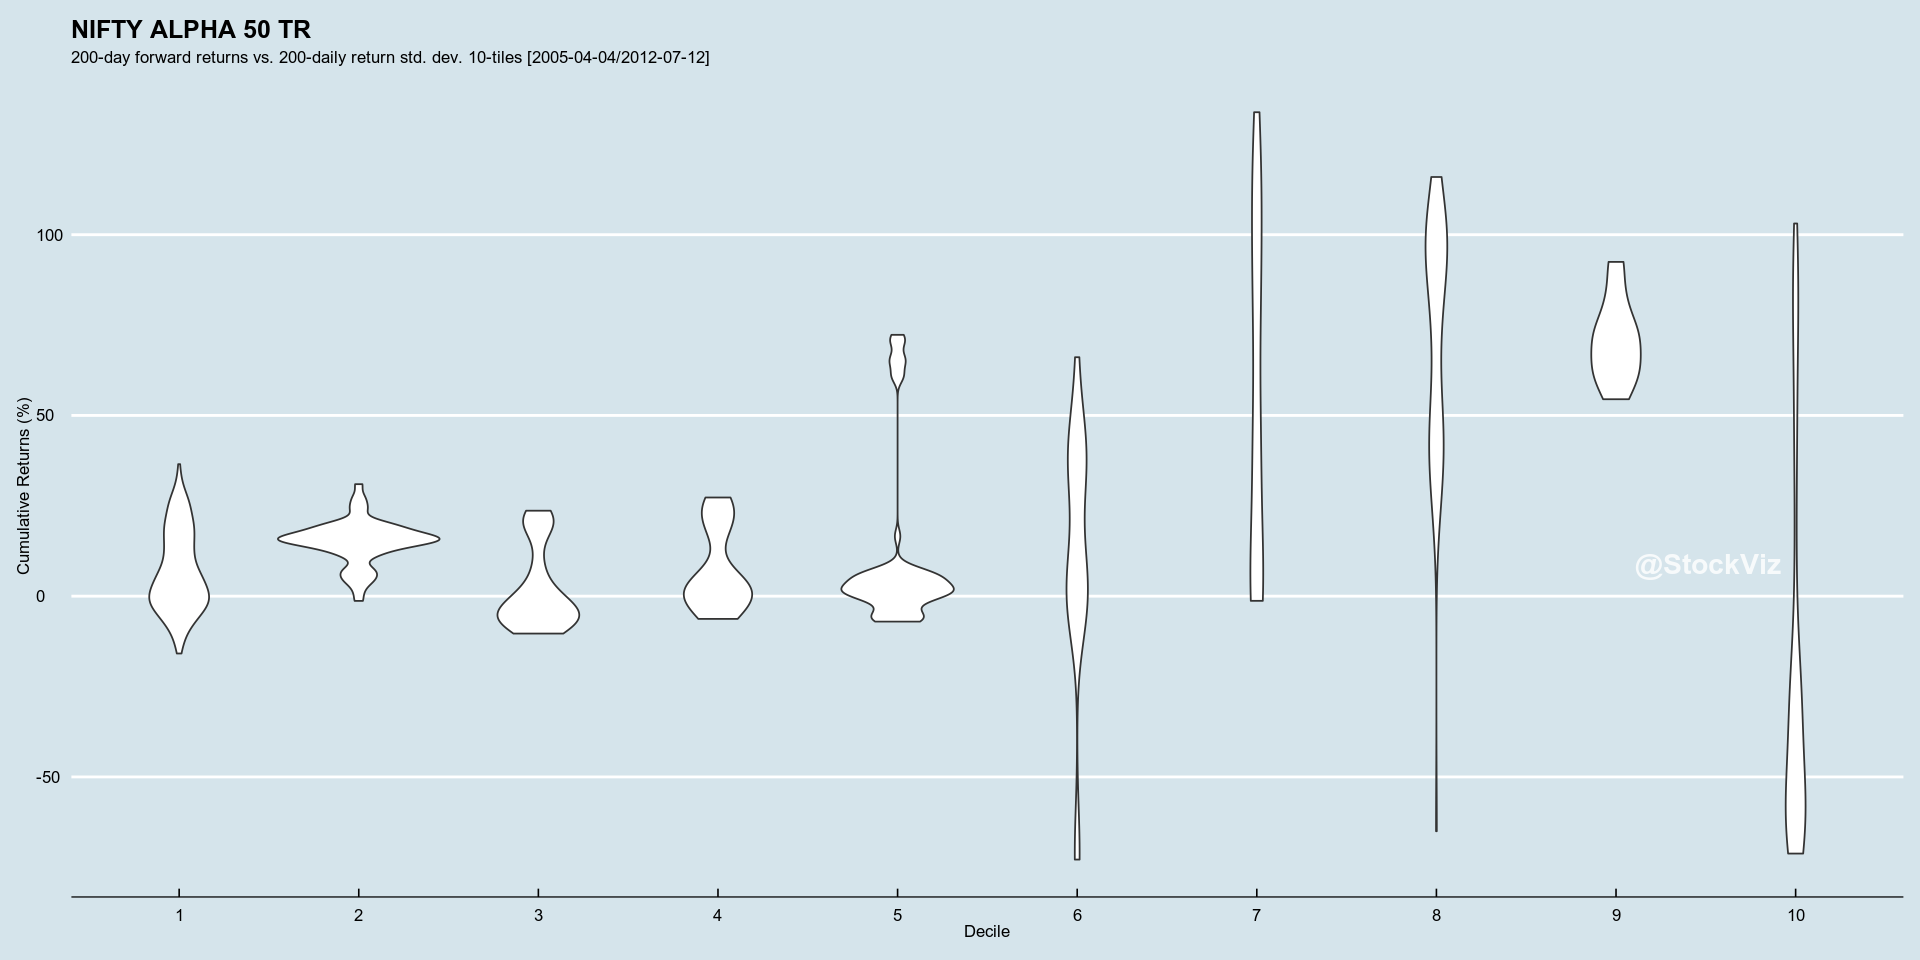
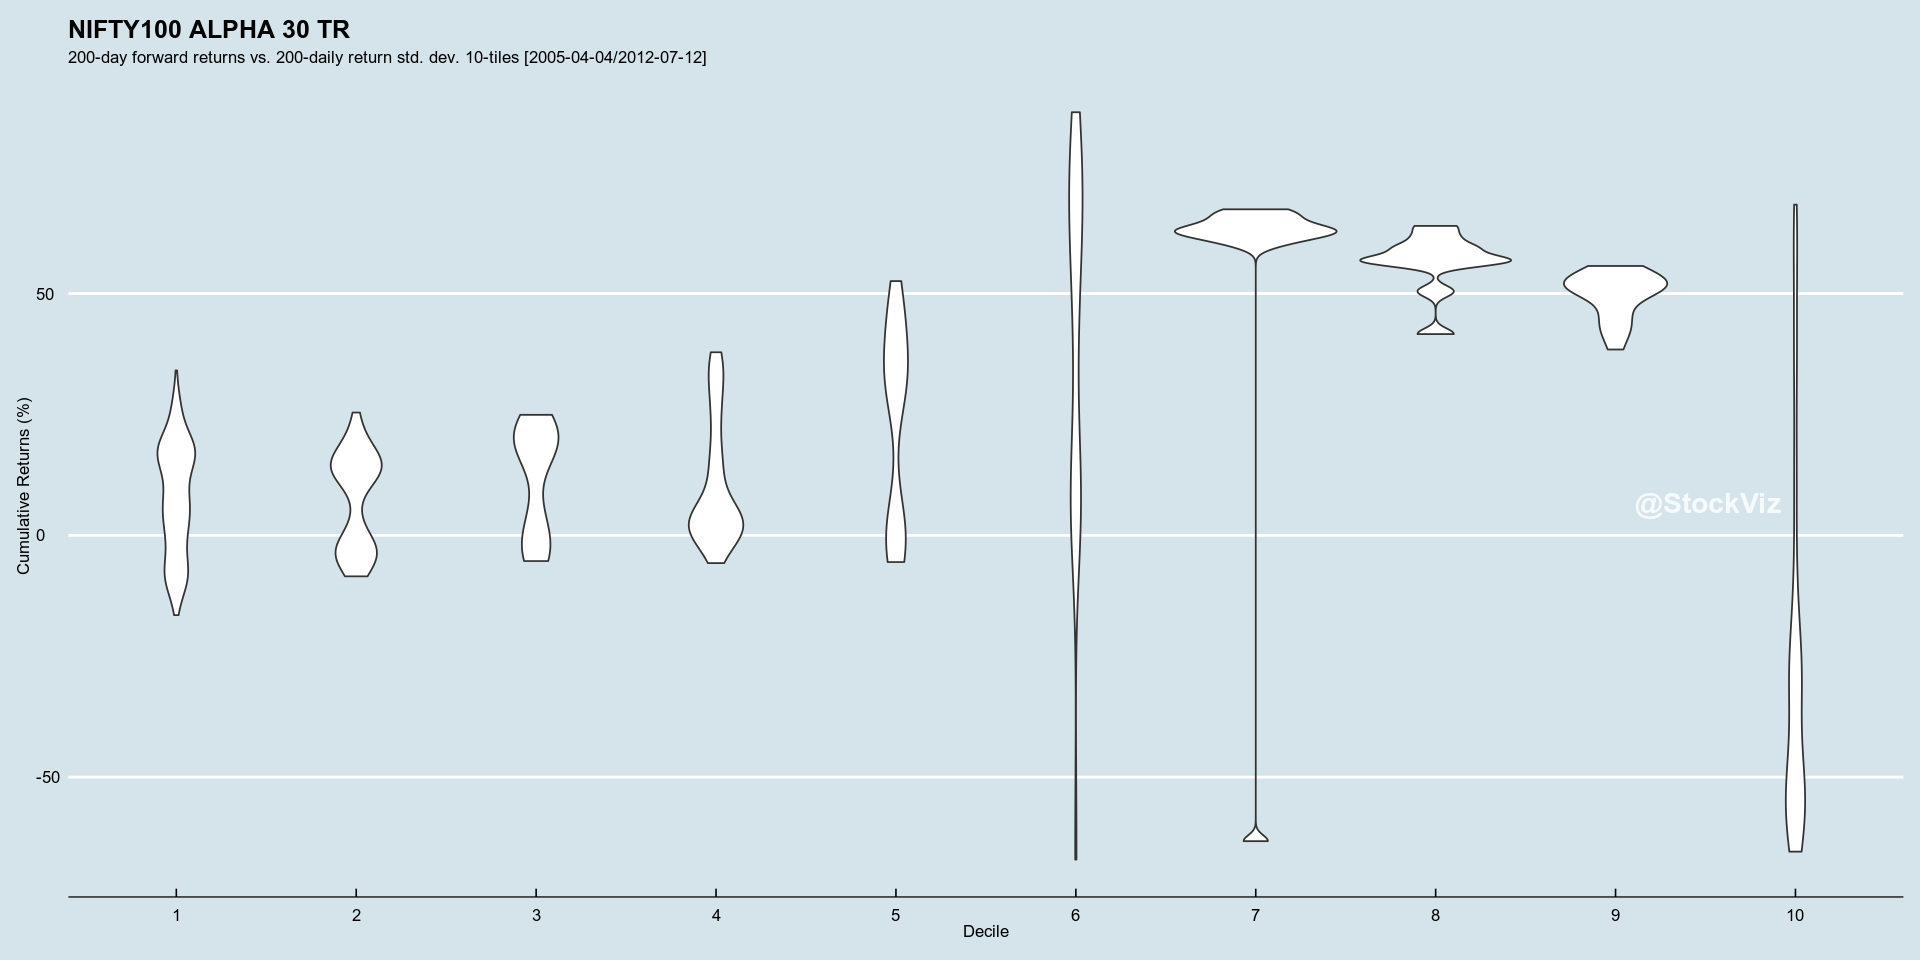
The theory laid out in the paper, that periods of high risk is followed by periods of low returns, is true. Subsequent returns when std. dev. is in the bottom deciles show large negative bias. Also, perhaps indicating a bit of mean-reversion, returns after std. dev. is in the 7-9th decile, have fat right tails.
NIFTY ALPHA 50 200-day cumulative returns by 200-day sd decile NIFTY100 ALPHA 30 200-day cumulative returns by 200-day sd decile
Train In-Sample
The next question is the appropriate lookback and deciles for calculating the std. dev. Running this on the training set, we find:
training set: NIFTY ALPHA 50 – 200 training set: NIFTY100 ALPHA 30 – 200
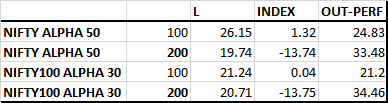
training results
A strategy that goes long Alpha when std. dev. is in the 1-5 deciles side-steps severe drawdowns in the training set. Note, however, that it under-performed buy-and-hold during the melt-up of 2007.
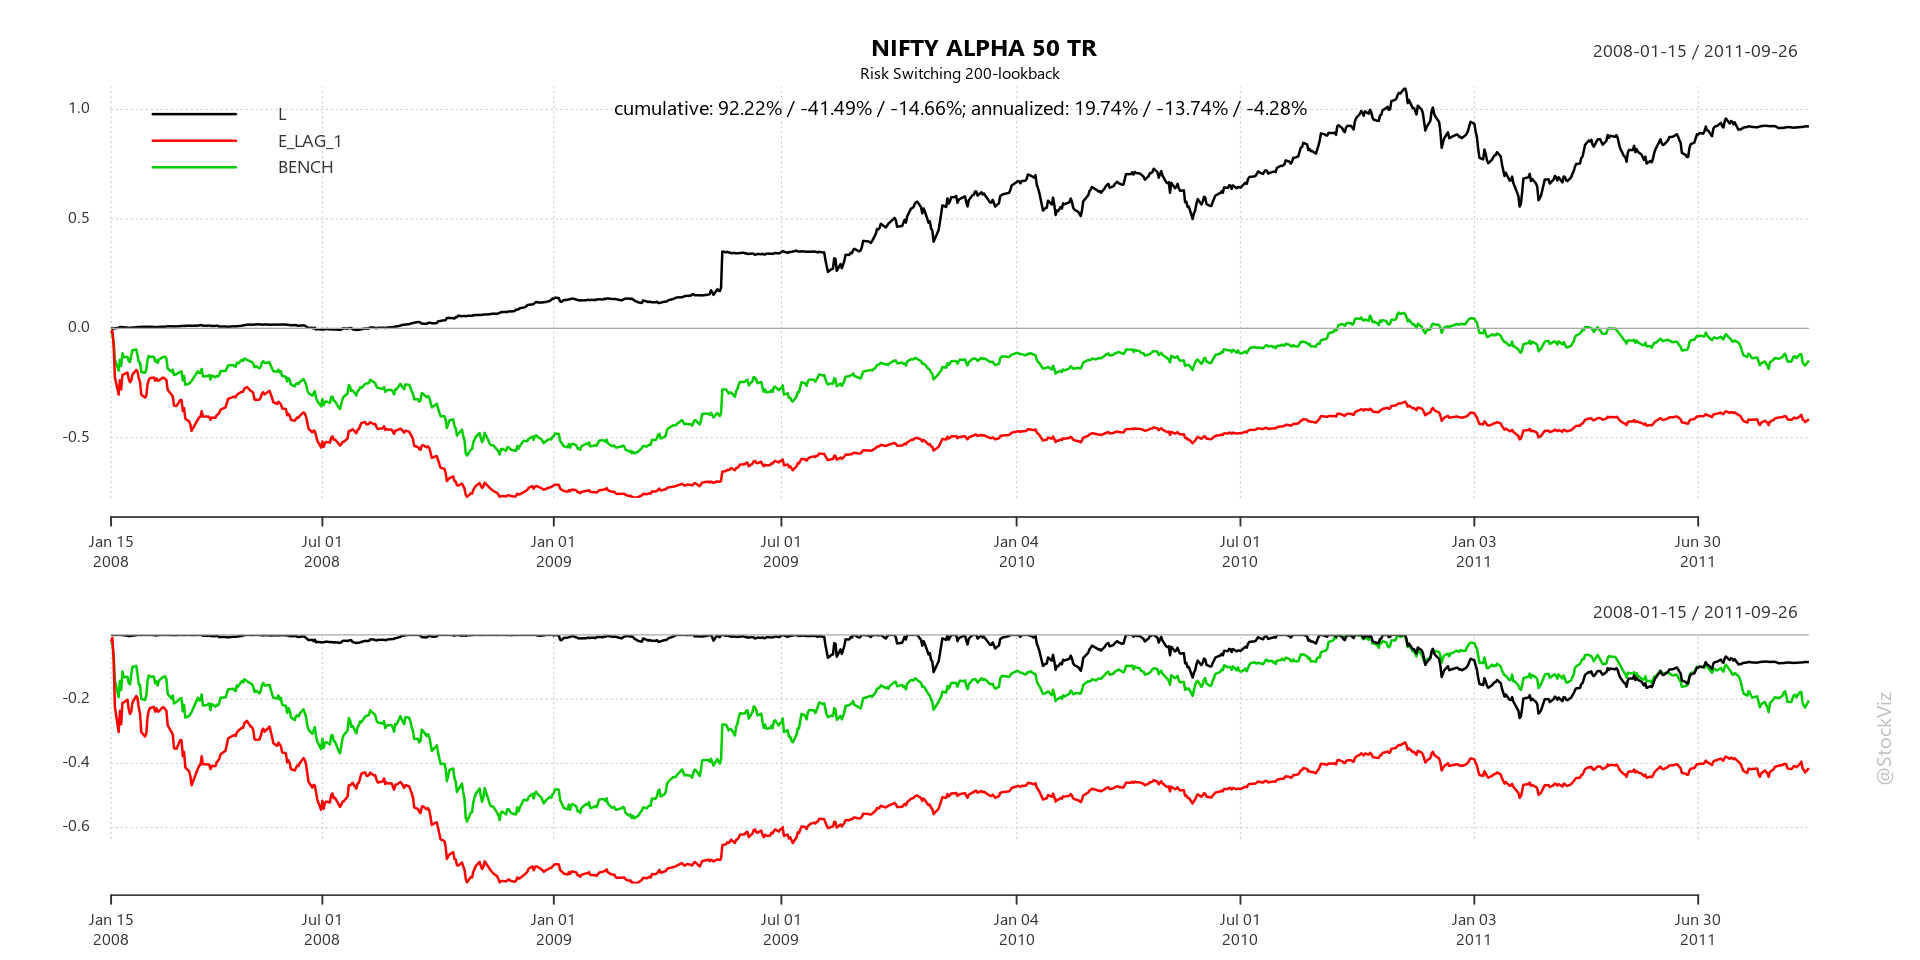
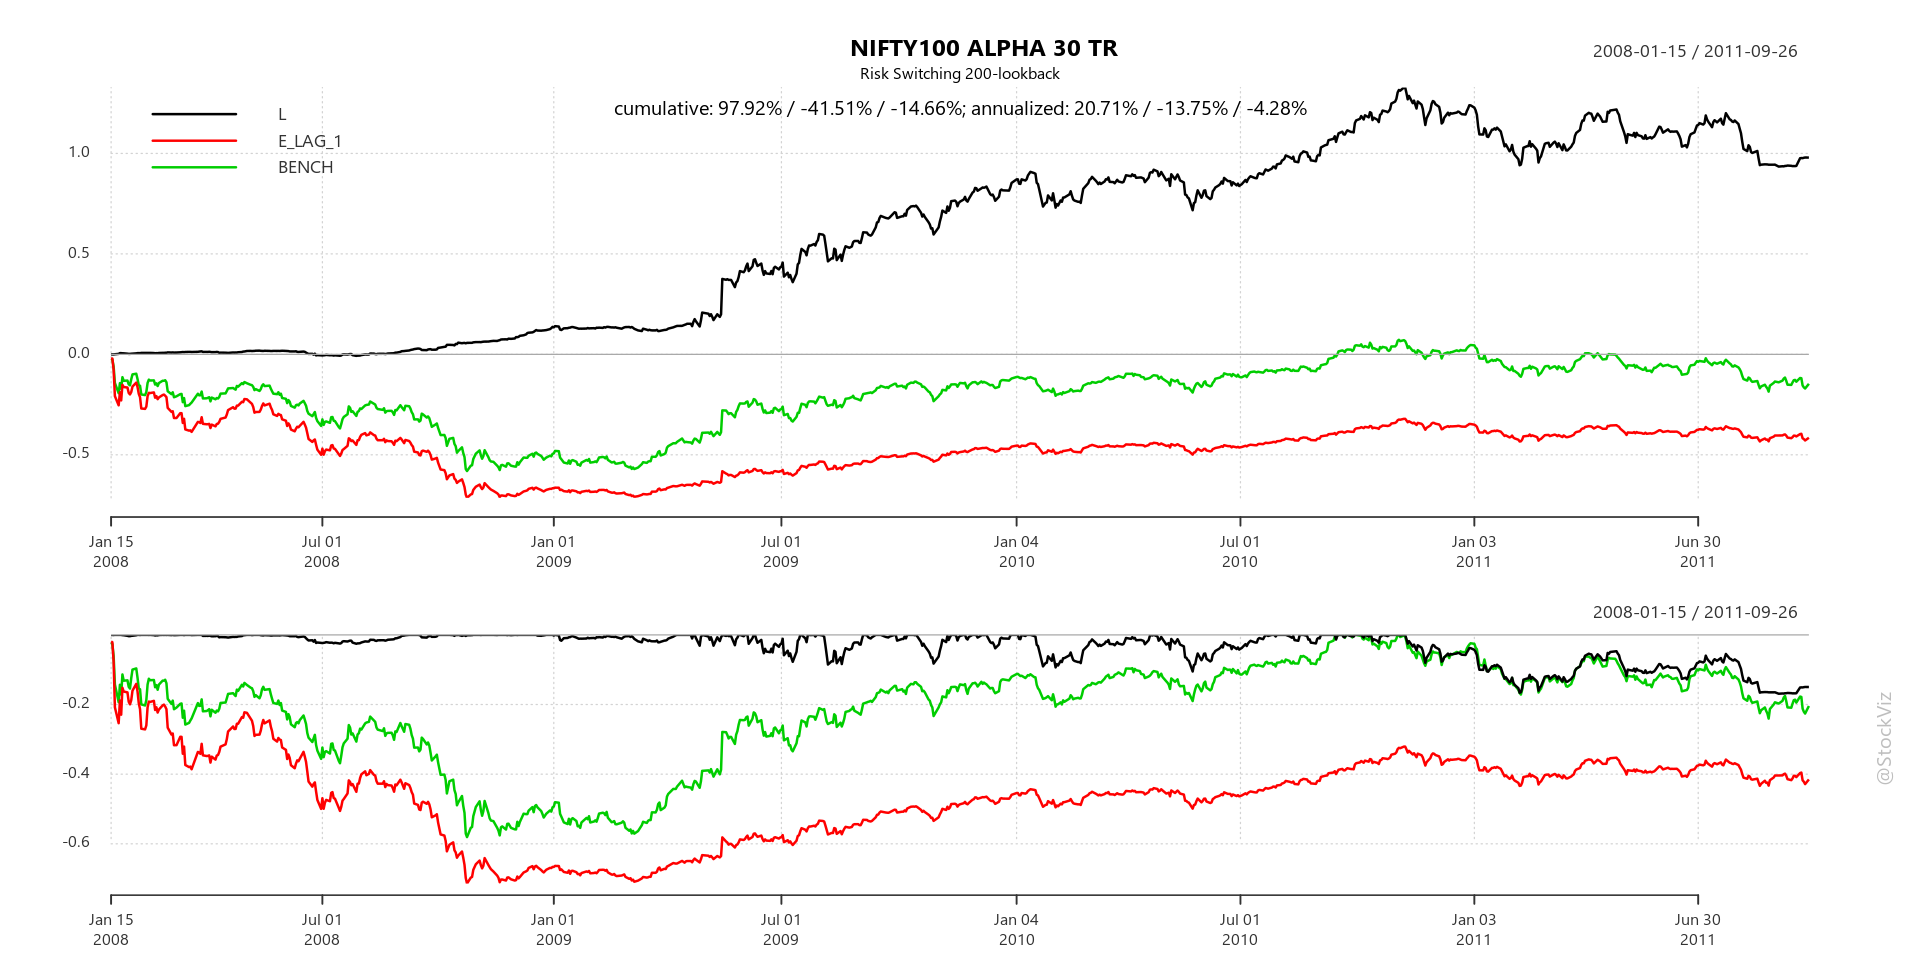
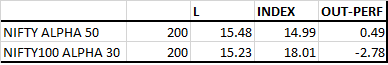
Test Out-of-Sample
Applying a 200-day lookback on both the indices over the test set, we find that the strategy continues to side-step drawdowns but no longer out-performs buy-and-hold by a large margin.
test set: NIFTY ALPHA 50 – 200 test set: NIFTY100 ALPHA 30 – 200
test results
Conclusion
Using historical volatility (std. dev.) reduces drawdown risk in Alpha indices. But it comes at the cost of reduced overall returns over buy-and-hold over certain holding periods. However, given the magnitude of the dodge in 2008 and 2016, it is well worth the effort (and cost) if it helps keep the discipline.
Check out the code for this analysis on pluto. Questions? Slack me!
There are a number of ways in which you can allocate funds (weigh) the stocks in your portfolio. The simplest of them are equal-weight and market-cap weight.
In an equal-weight portfolio, all stocks get the same allocation. If you have 20 stocks, then each stock would have a 5% weight in the portfolio. So the WAVG capitalization of these portfolios end up skewing towards mid/small caps within the portfolio.
In a cap-weight portfolio, each stock gets an allocation based on its market-capitalization. So large-cap stocks get a large weight and smaller-cap stocks get a smaller weight.
The advantage of a cap-weight portfolio is that unless you want to change the constituents, you don’t have to do anything. The individual weights will be always tracking their corresponding market-caps. But in an equal-weight portfolio, you need to rebalance once a month/quarter to bring back all the constituents to their original weights. You will be selling your winners to add to your losers.
Needless to say, the all-in cost of maintaining an equal-weight portfolio will be more than that of a cap-weigh portfolio. Is it worth it?
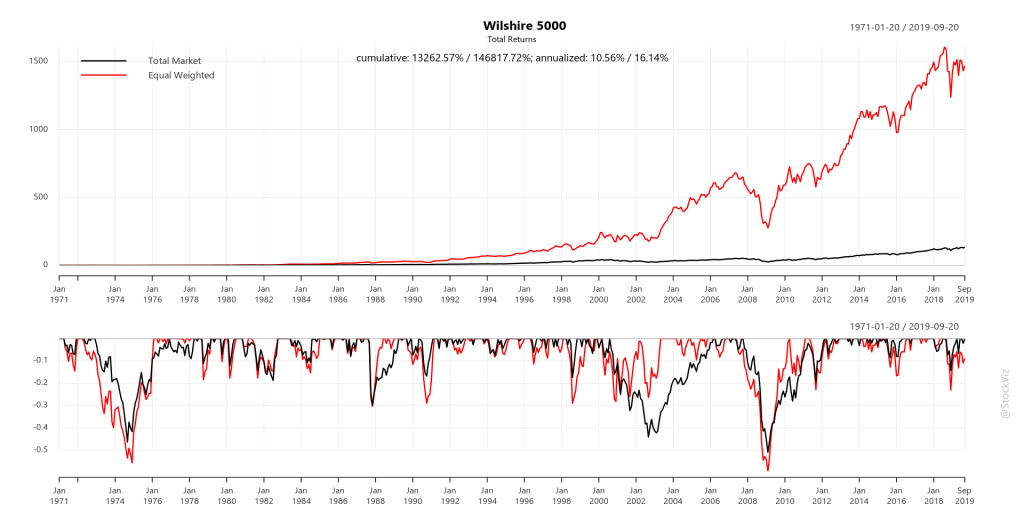
The American Experience
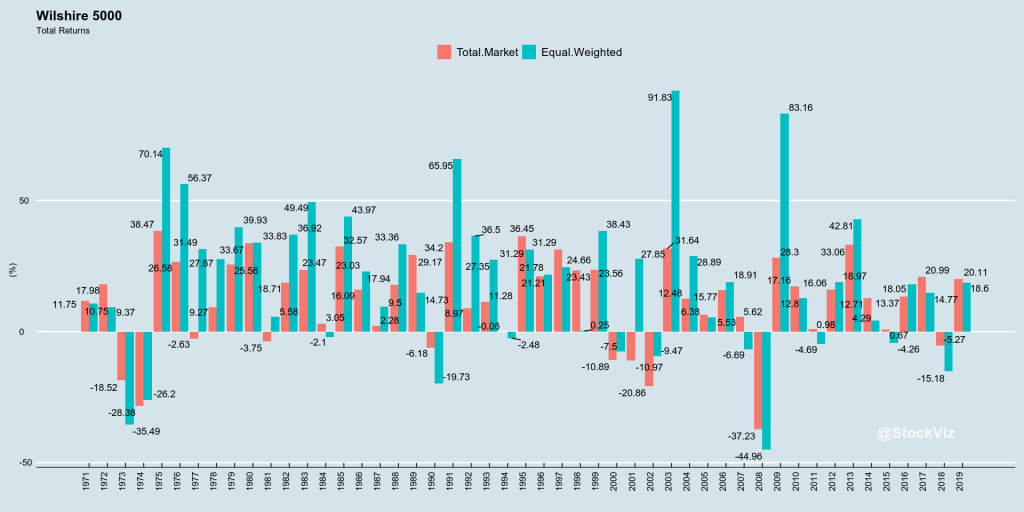
For the US markets, lucky for us, Wilshire Indices has index data covering both the market-cap and equal-weight versions of the same portfolio starting from 1970. And the over-all out-performance of the equal-weight portfolio looks spectacular.
Cap-weight vs. Equal-weight
Whenever you see out-performance like this, you have to keep in mind that it is usually a combination of investor behavior and investment risk.
The reason why an investment strategy out-performs could be because it is prone to long draw-downs followed by large, but short-lived, upswings. Investors flood into the strategy during the upswing, only to exit during the soul-crushing drawdown. Happens in value and momentum investing a lot.
The second reason why something works is because of higher volatility. Stocks are more volatile than bonds so over a long enough period of time, they out-perform them.
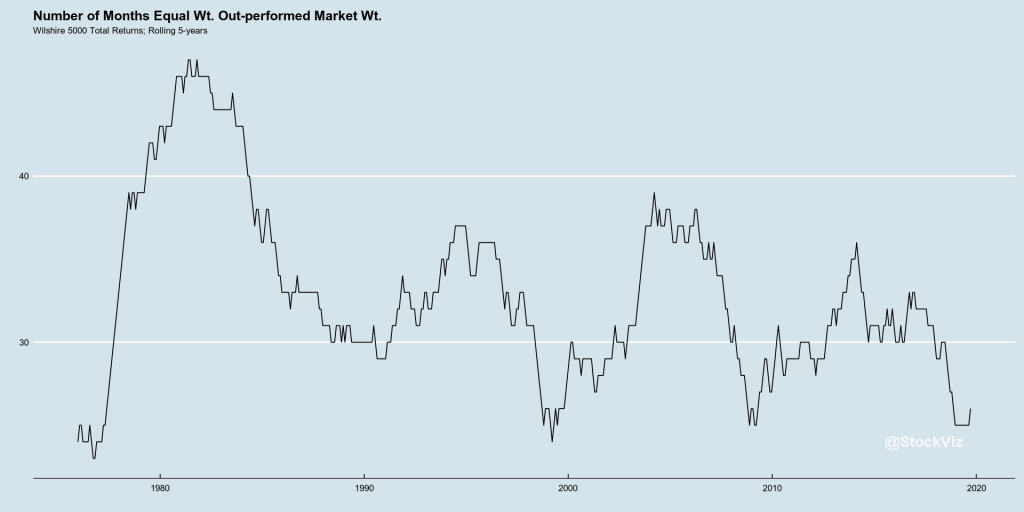
To visualize if investor behavior is driving out-performance, you can look for the swings in annual returns and periods for which the strategy under-performs its benchmark.
Large swings imply difficulty of staying investedLong periods of under-performance imply difficulty of staying invested
The equal-weighted index also has a larger standard-deviation (a measure of volatility) ~6% compared to ~4.4% of the market-cap index.
In short, equal-weighted portfolios are more volatile and there are significant periods where they under-perform their cap-weighted cousins in the short-term. This results in a larger probability of adverse investor behavior, partly explaining the out-performance over a longer period of time.
However, we don’t live in the 70’s anymore. The market structure has evolved. Costs have come down drastically and more investors are aware of the equal-weight strategy. If you think liquidity is thin in small-cap stocks today, it was impossible to trade them 20 years ago unless your uncle ran a brokerage firm. So some of the earlier-period excess returns are only theoretical – you could not implement this strategy even if you knew about it.
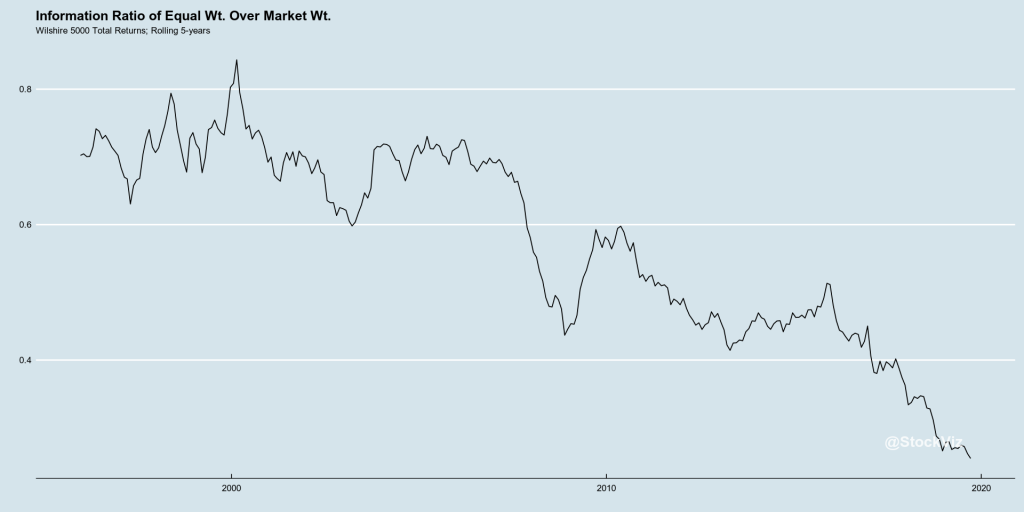
So, is it still a free-lunch? One way to visualize this is to plot the Information Ratio of the equal-weight returns over that of market-cap returns.
No longer a free lunch!
Equal-weight, as a strategy, has been losing its mojo and maybe, its best days are behind it. Excess returns could be entirely explained by higher risk.
The Indian Experience
It maybe too early for a large commitment to equal-weight portfolios in India.
First, India has a Securities Transaction Tax of 0.1% on the total notional amount traded. So, a market-cap weight portfolio that is rebalanced twice a year will have a far lower cost than an equal-weight portfolio that is rebalanced every month.
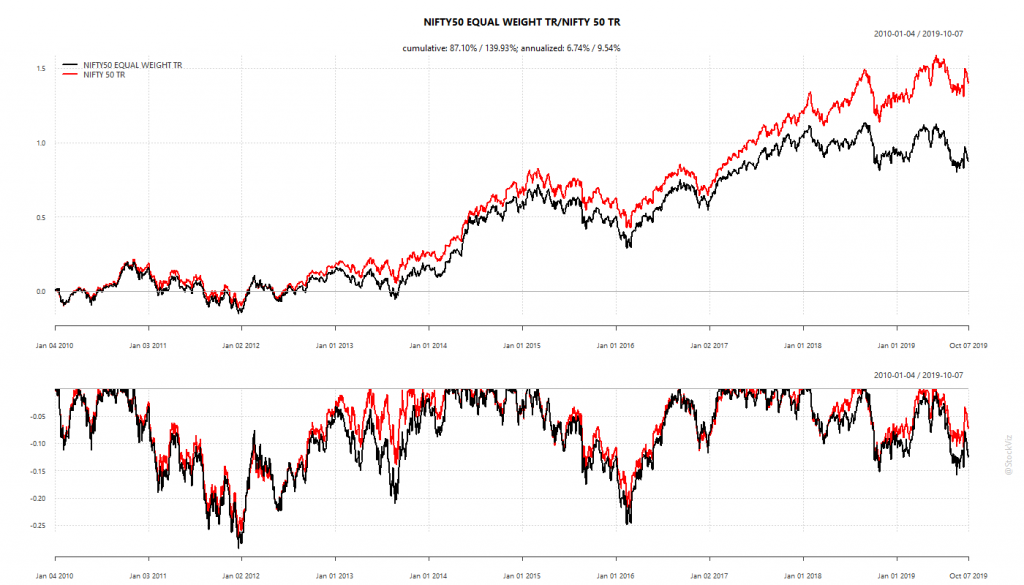
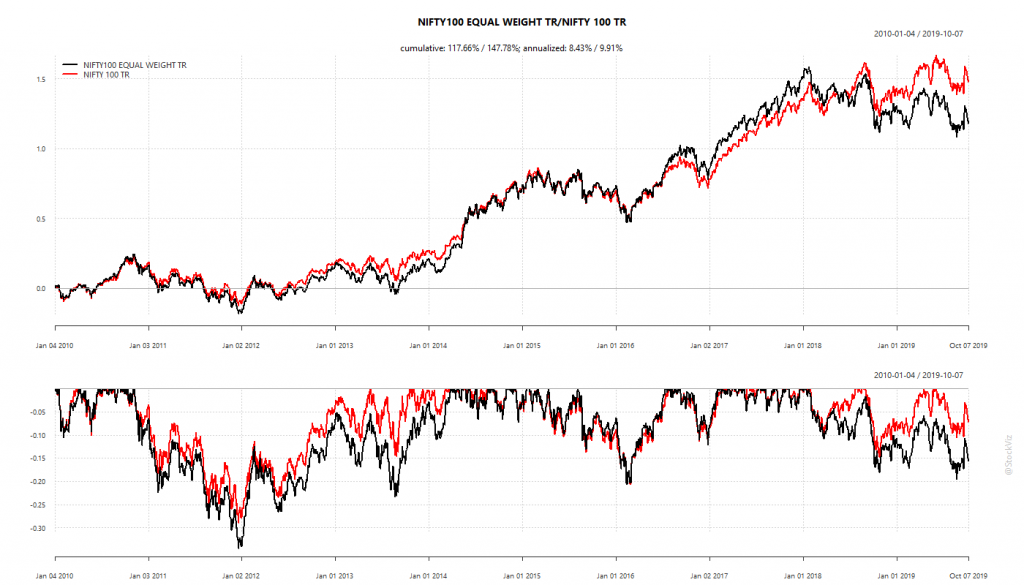
Second, there is no liquidity beyond the top 70-100 names by market-cap. So one cannot create an equal-weight version of the NIFTY 500 index. An equal-weighted NIFTY 50 is probably the only version that makes sense if you want to reduce impact costs. NIFTY 100 is the second-best option.
If you go with NIFTY 50, an equal weight portfolio of 50 stocks means than each stock has a 2% weight. Since you are constantly selling winners and buying losers, low dispersion in returns between their returns will have a big impact on the relative performance of the equal-weighted portfolio over its cap-weighted cousin.
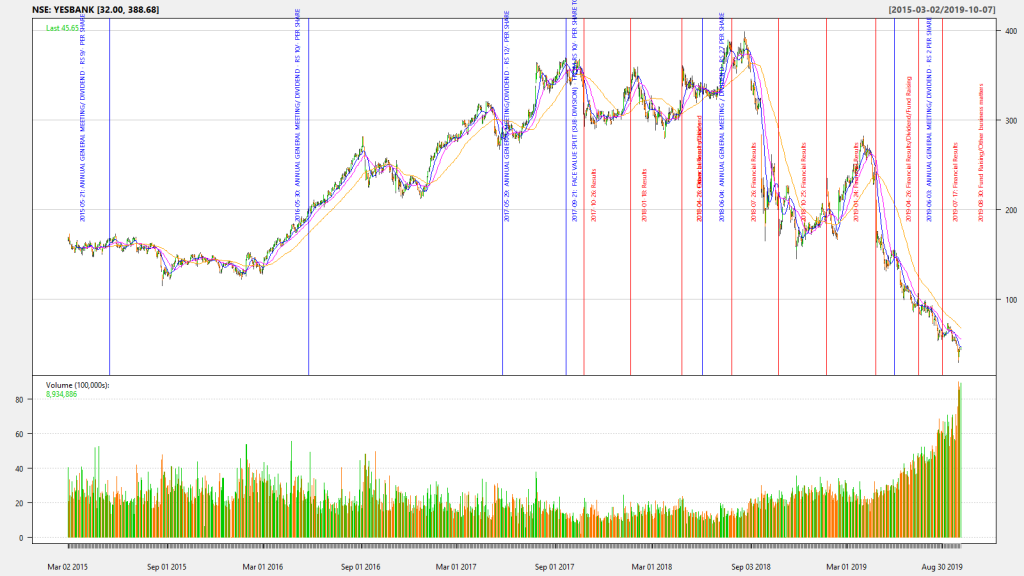
For example, YESBANK, at its peak, had a 1.74% weightage in the NIFTY 50. And its recent troubles have brought it down to about 0.18%. In the equal-weighted NIFTY 50, this would have been a constant 2% through-out. Not exactly participating fully in the up-side but doubling down on the down-side.
Price chart of YESBANK since it was added to NIFTY 50 in March 2015
YESBANK wouldn’t have been a big problem if we were equal-weighting the NIFTY 500. But it is a problem with NIFTY 50.
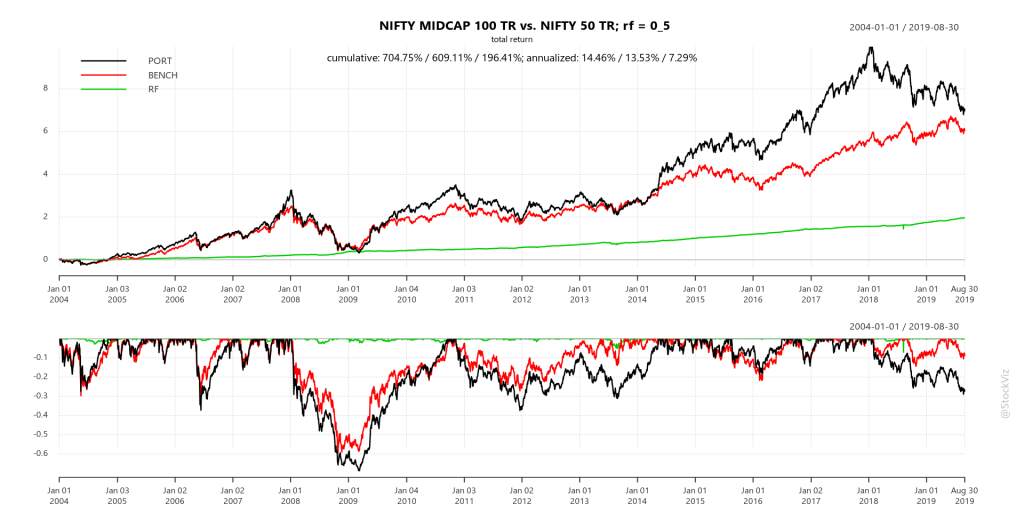
It is generally believed that mid-caps give better returns than large-caps. But if you compare their historical returns, the difference is minuscule.
Is the pain worth the gain?
But mid-caps have often inflicted a lot of pain on their investors – spending most of their time in drawdowns. There is no diversification benefit because both of them play in the same circus. If you are a buy-and-holder, why bother with mid-caps at all?
Check out the notebook on pluto. You can play around with it once you login with your github account.
Here’s something to keep in mind while using historical index returns to draw conclusions about the future: the composition of the index keeps changing. The shifting effects of industry dynamics and market cycles should not be ignored.
NIFTY 50 in 2009:
NIFTY 50 in 2019 (10 years later):
Banks and financials now have a bigger impact on index performance. If you are looking for a more diversified exposure, the NEXT 50 is a better option: