We are often told that missing the 10-biggest days in the market leads to sub-par returns. While it is certainly true, what is often not said is that those really big days occur around really bad days. Welcome to tail-risk.
The average daily return of the NIFTY 50 is 0.06%. The worst daily return is ~ -13% and the best is ~18%. Welcome to tail-risk.
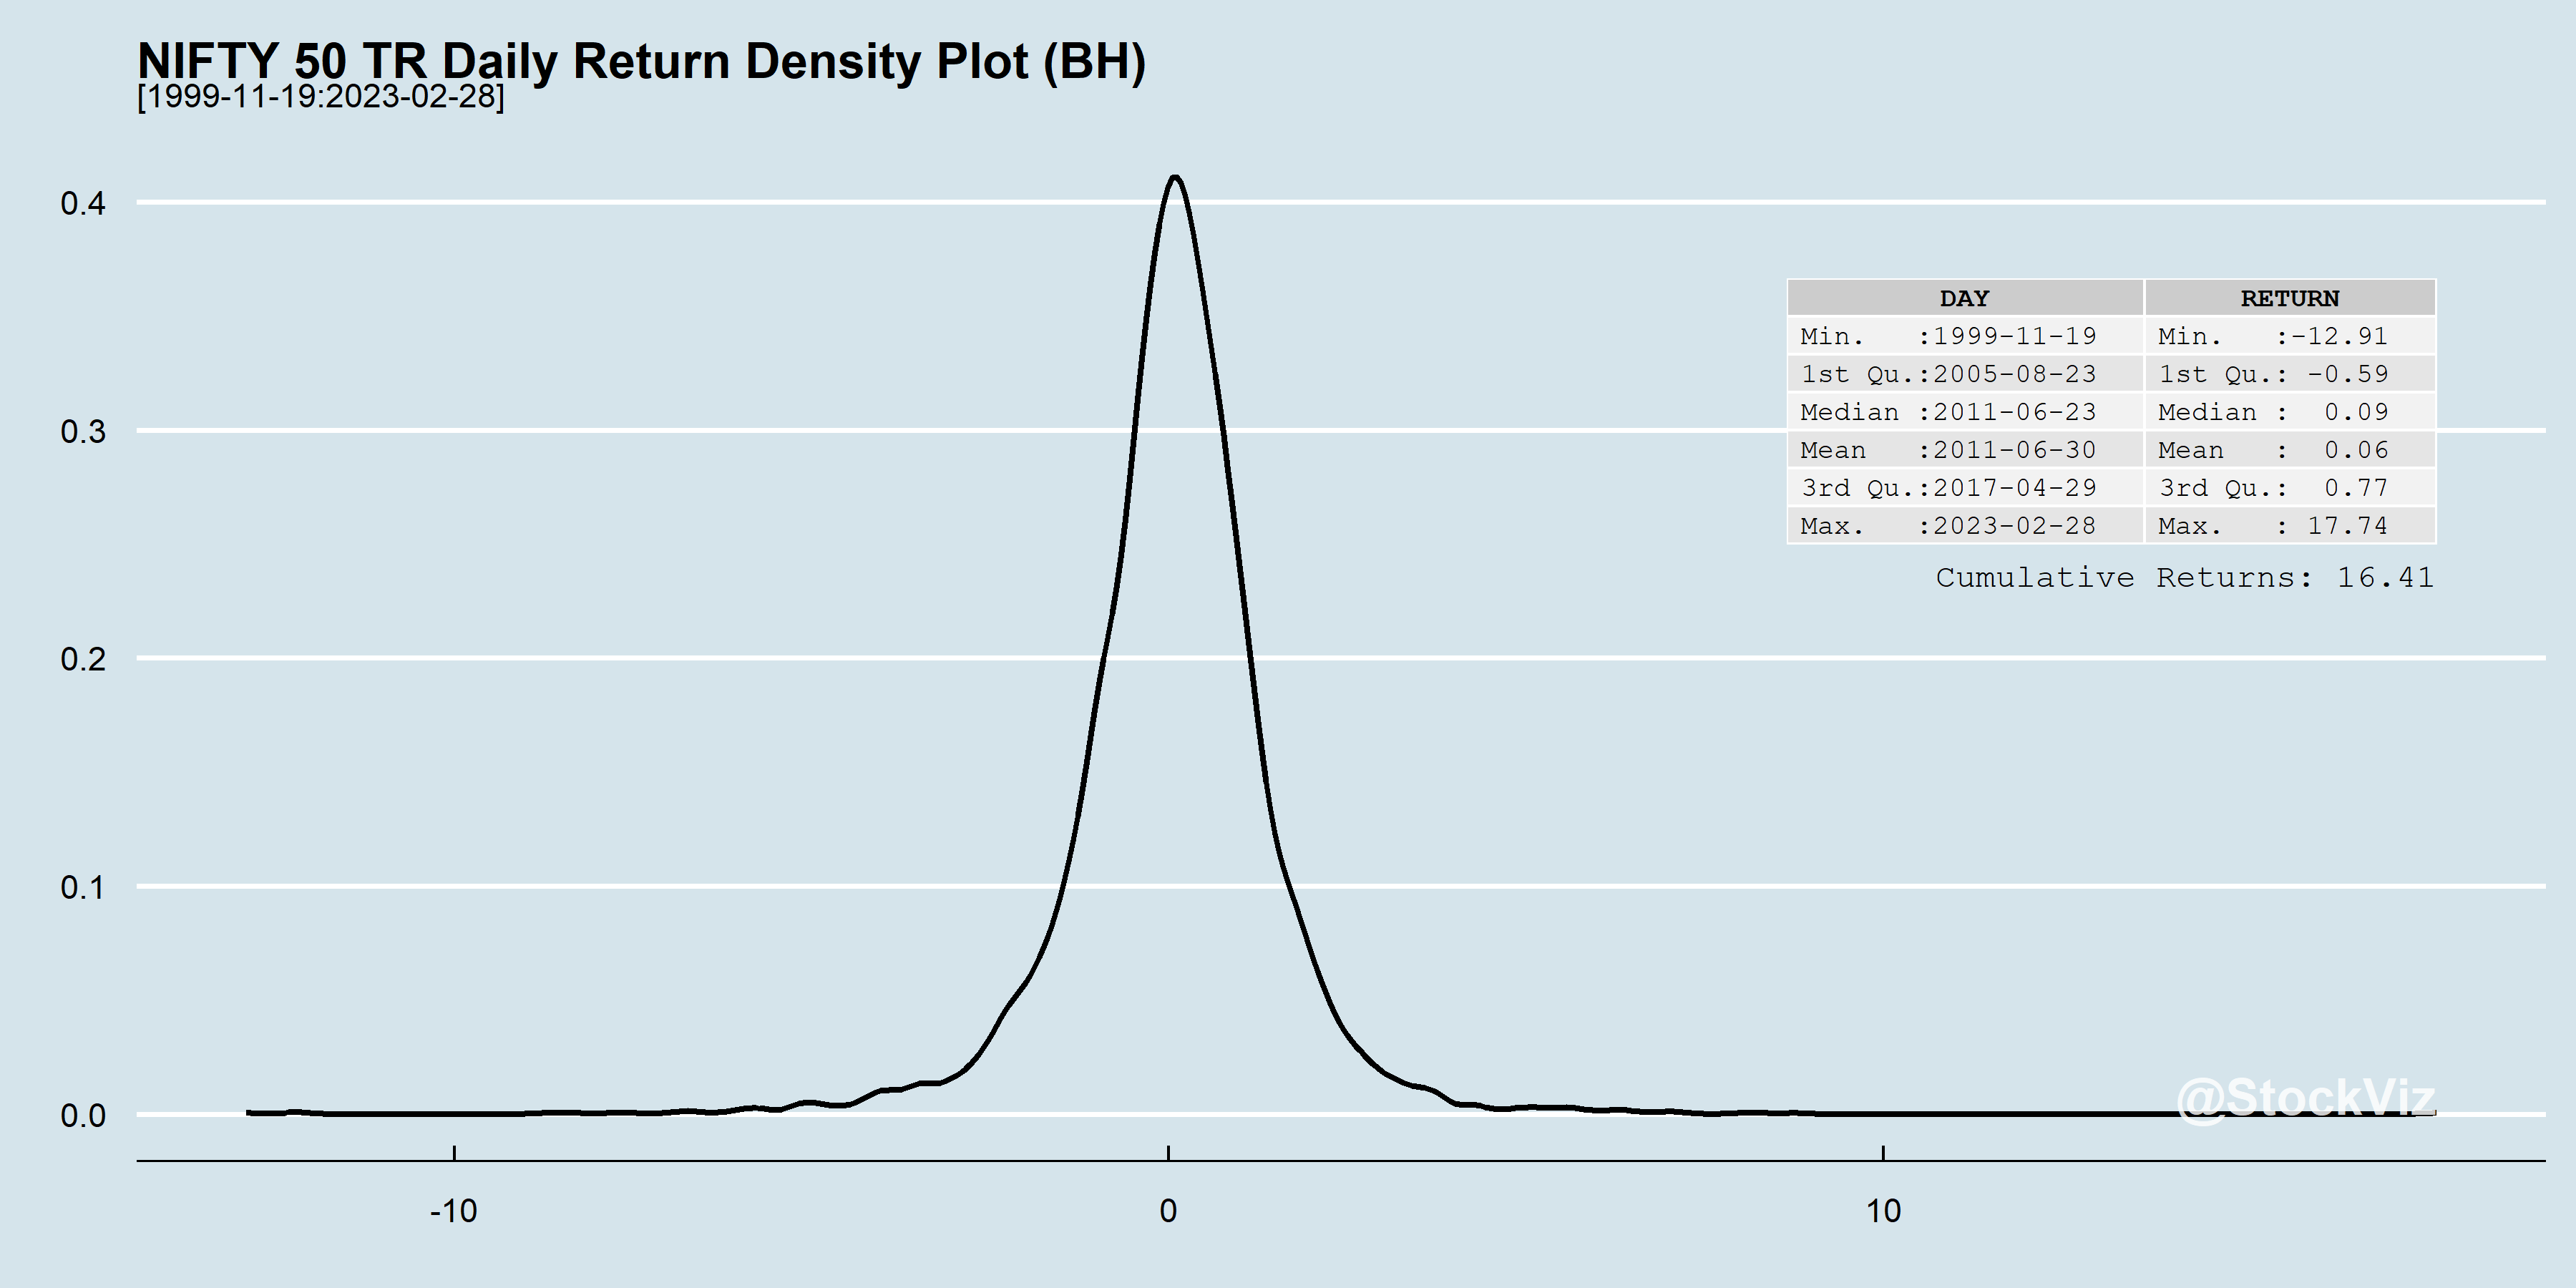
In any given year, there are a lot of days when returns fall out of 1, 2 or even 3 standard deviations (σs), Up and Down.
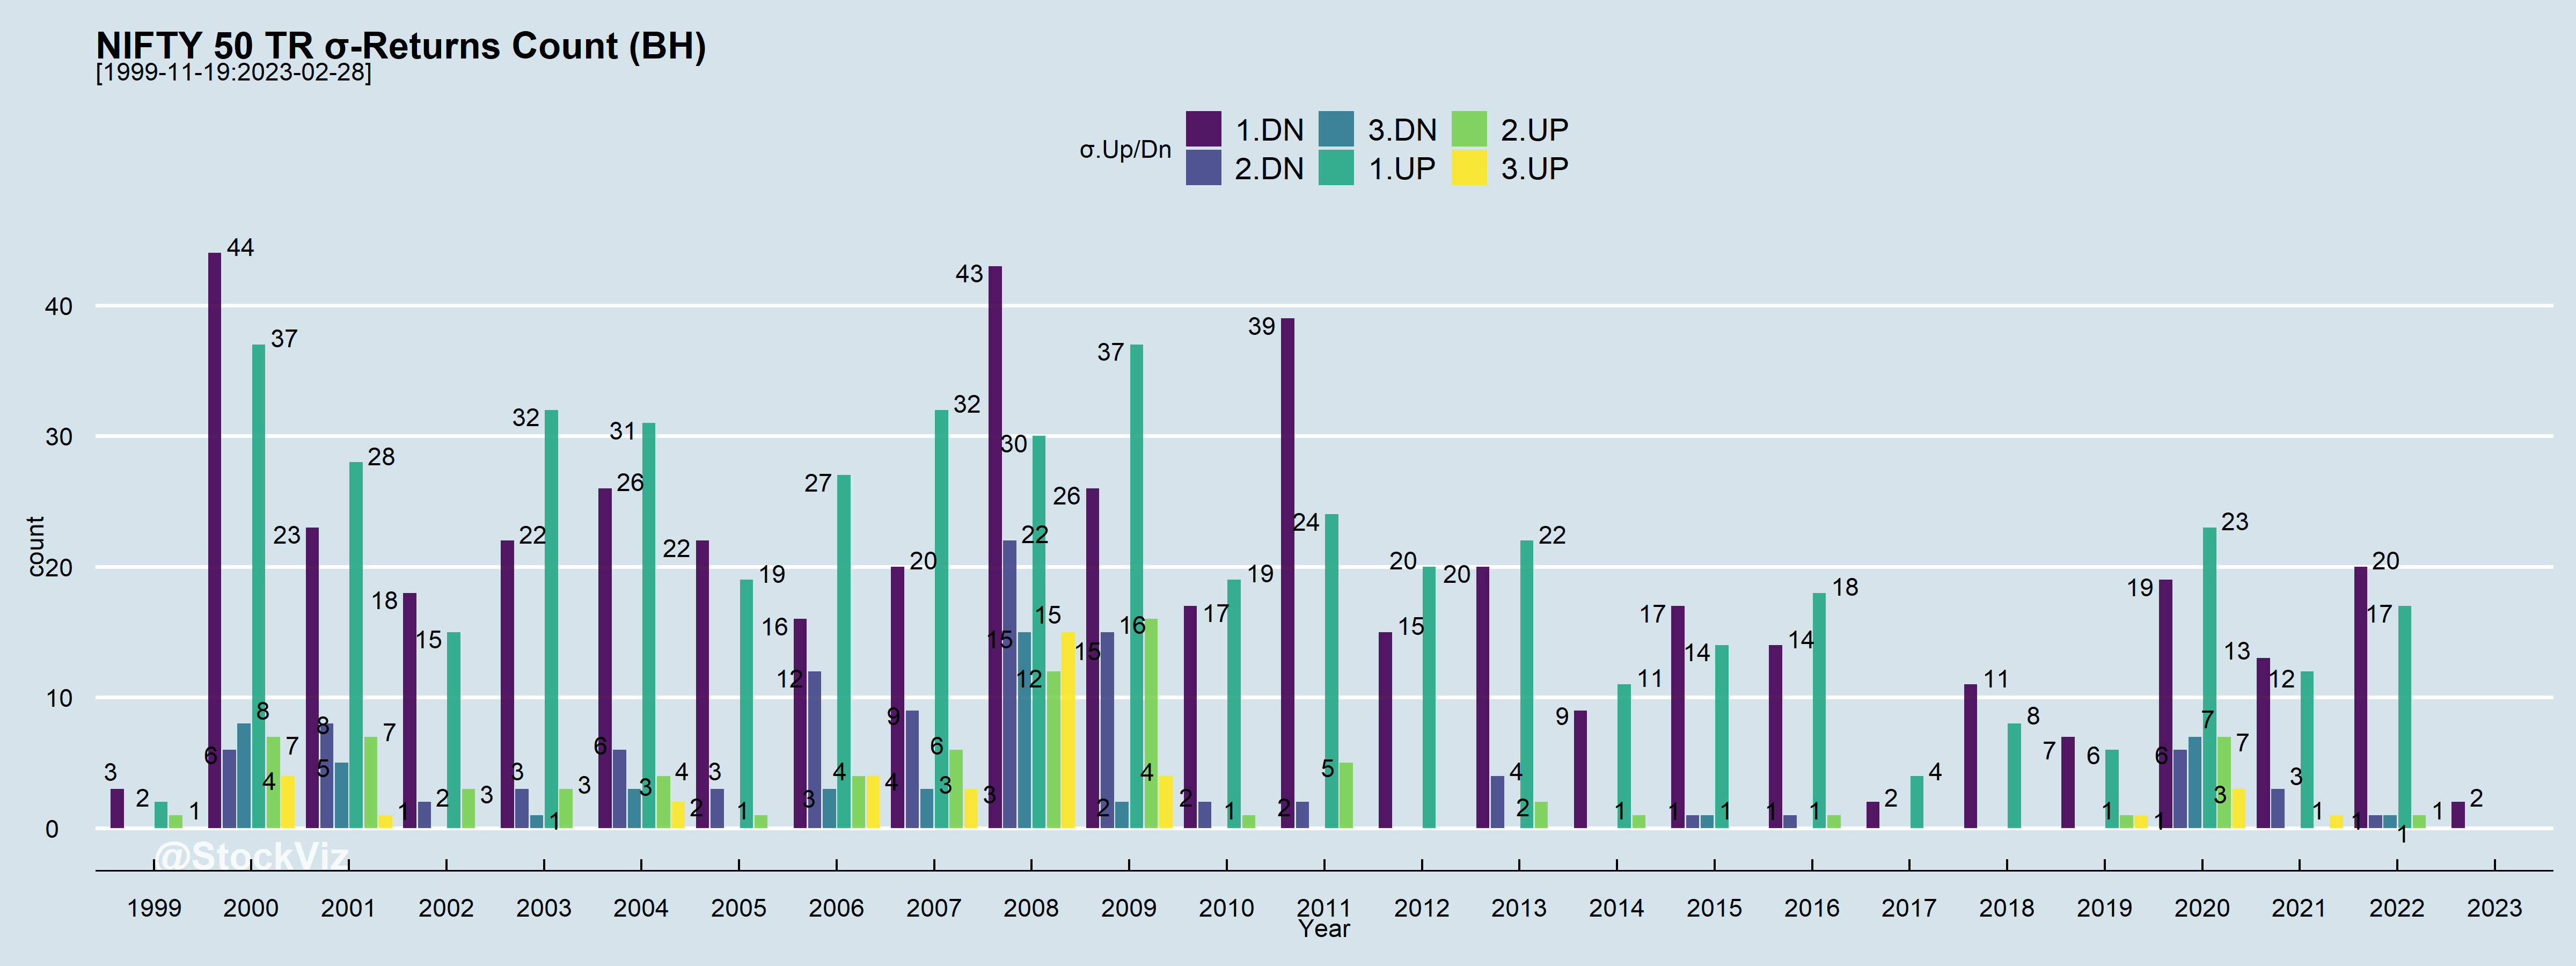
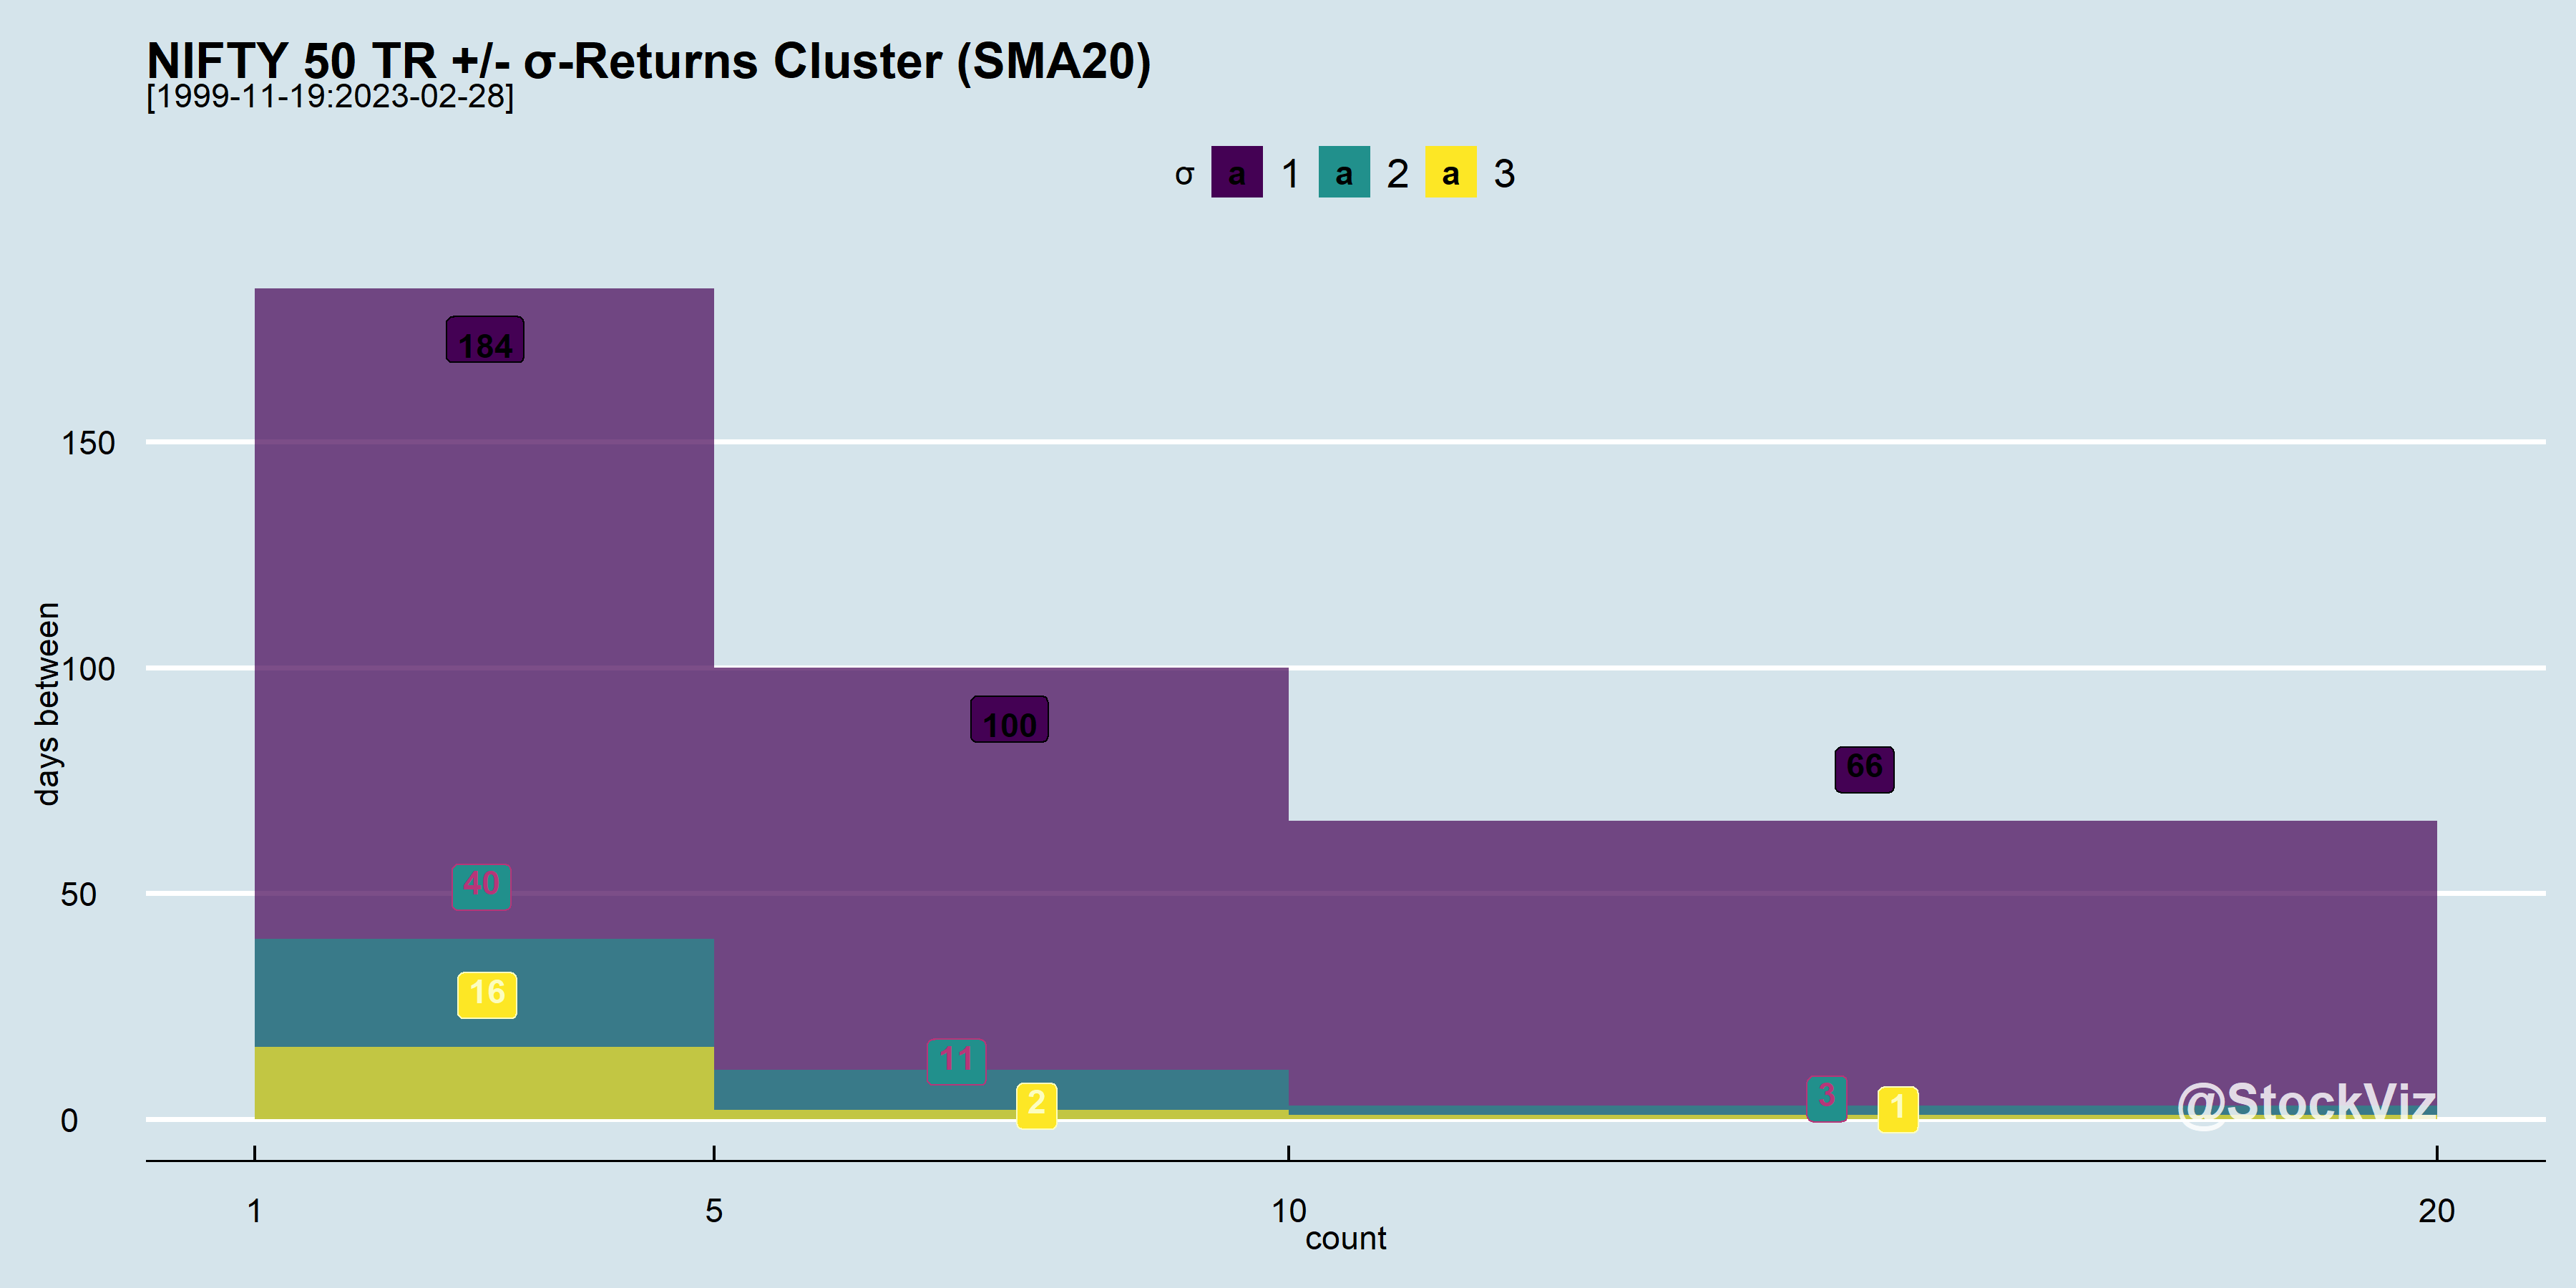
And these σ moves tend to happen close to each other. i.e., volatility clusters.
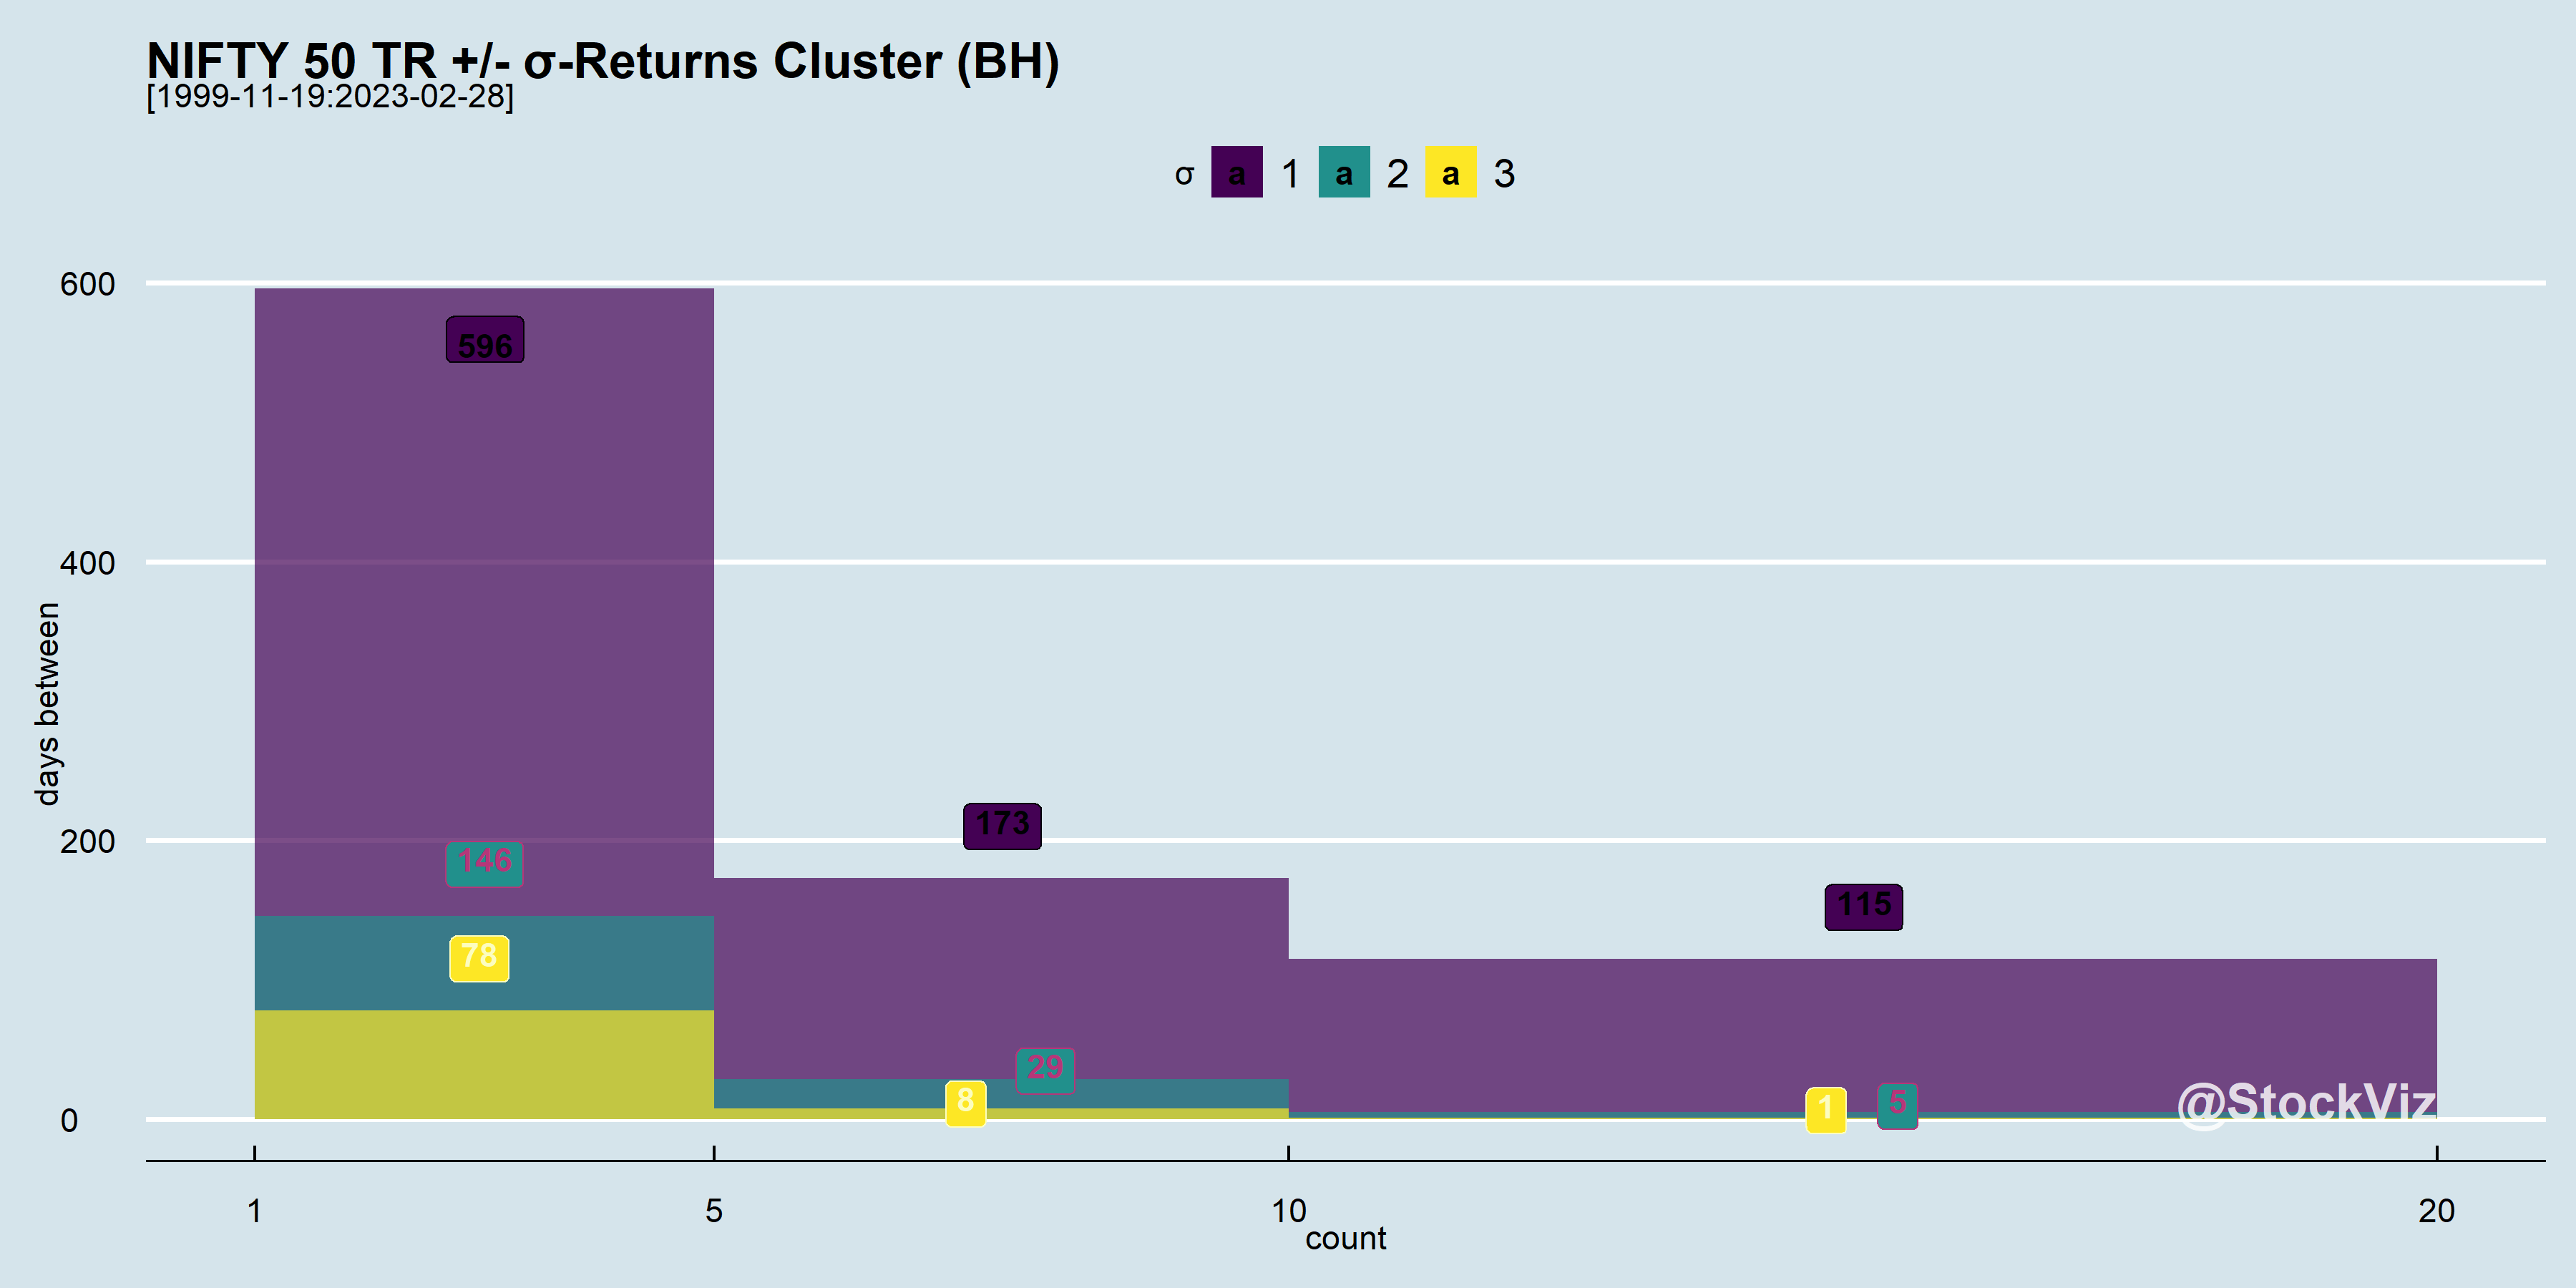
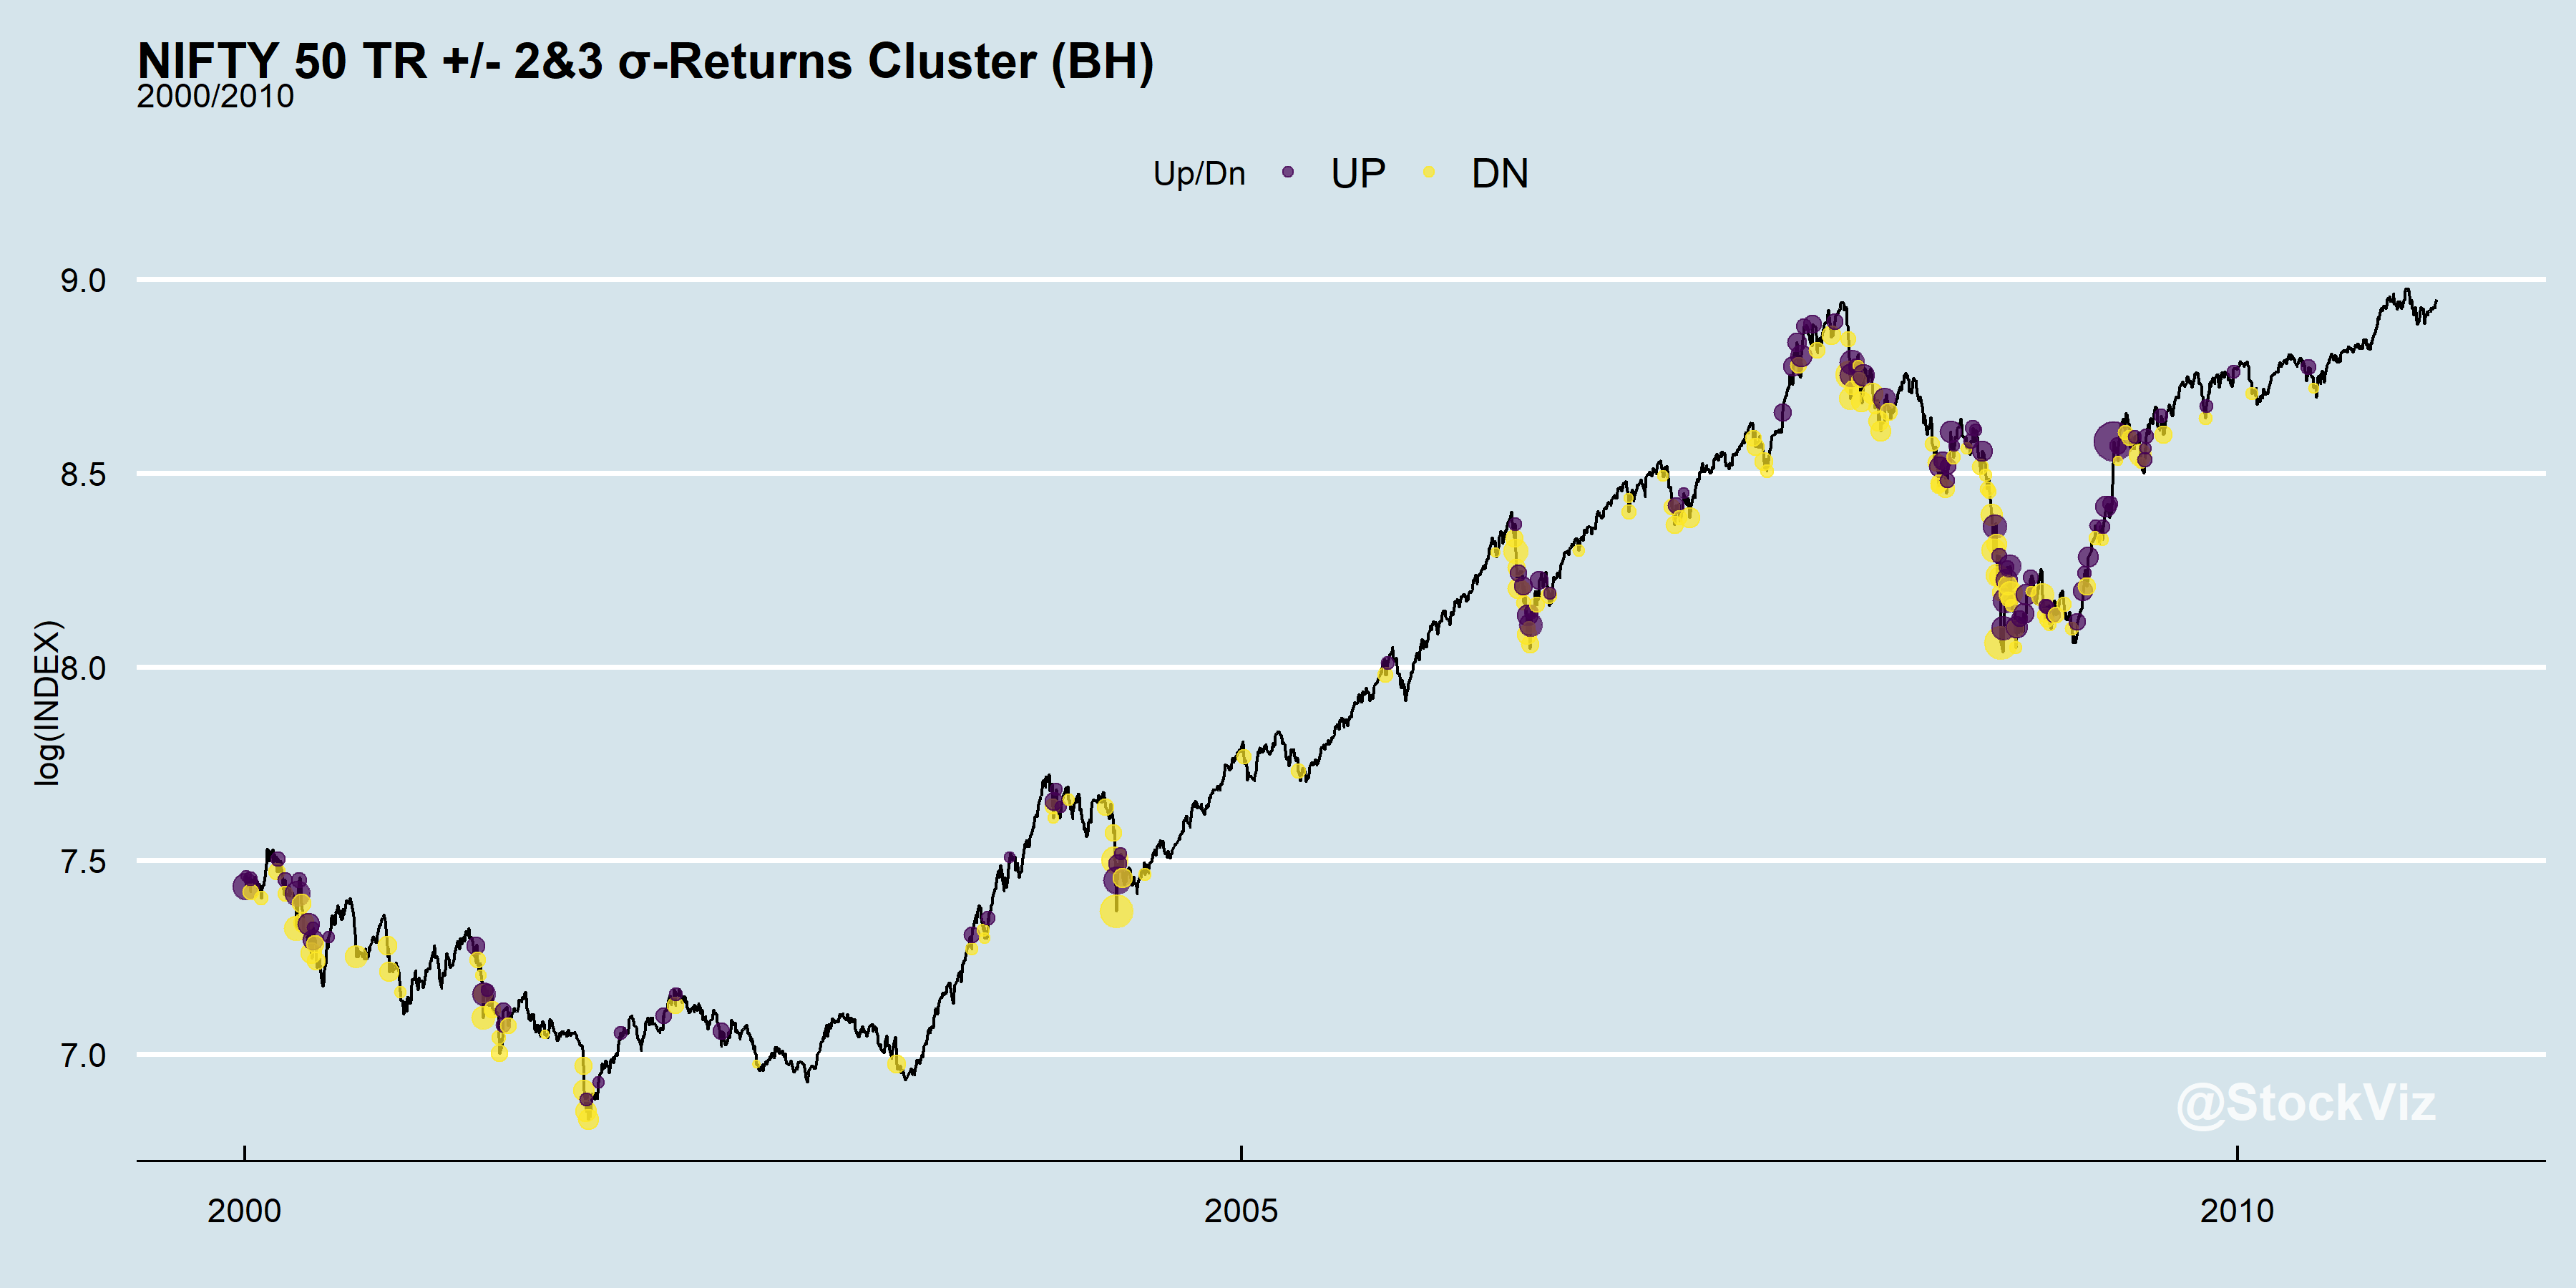
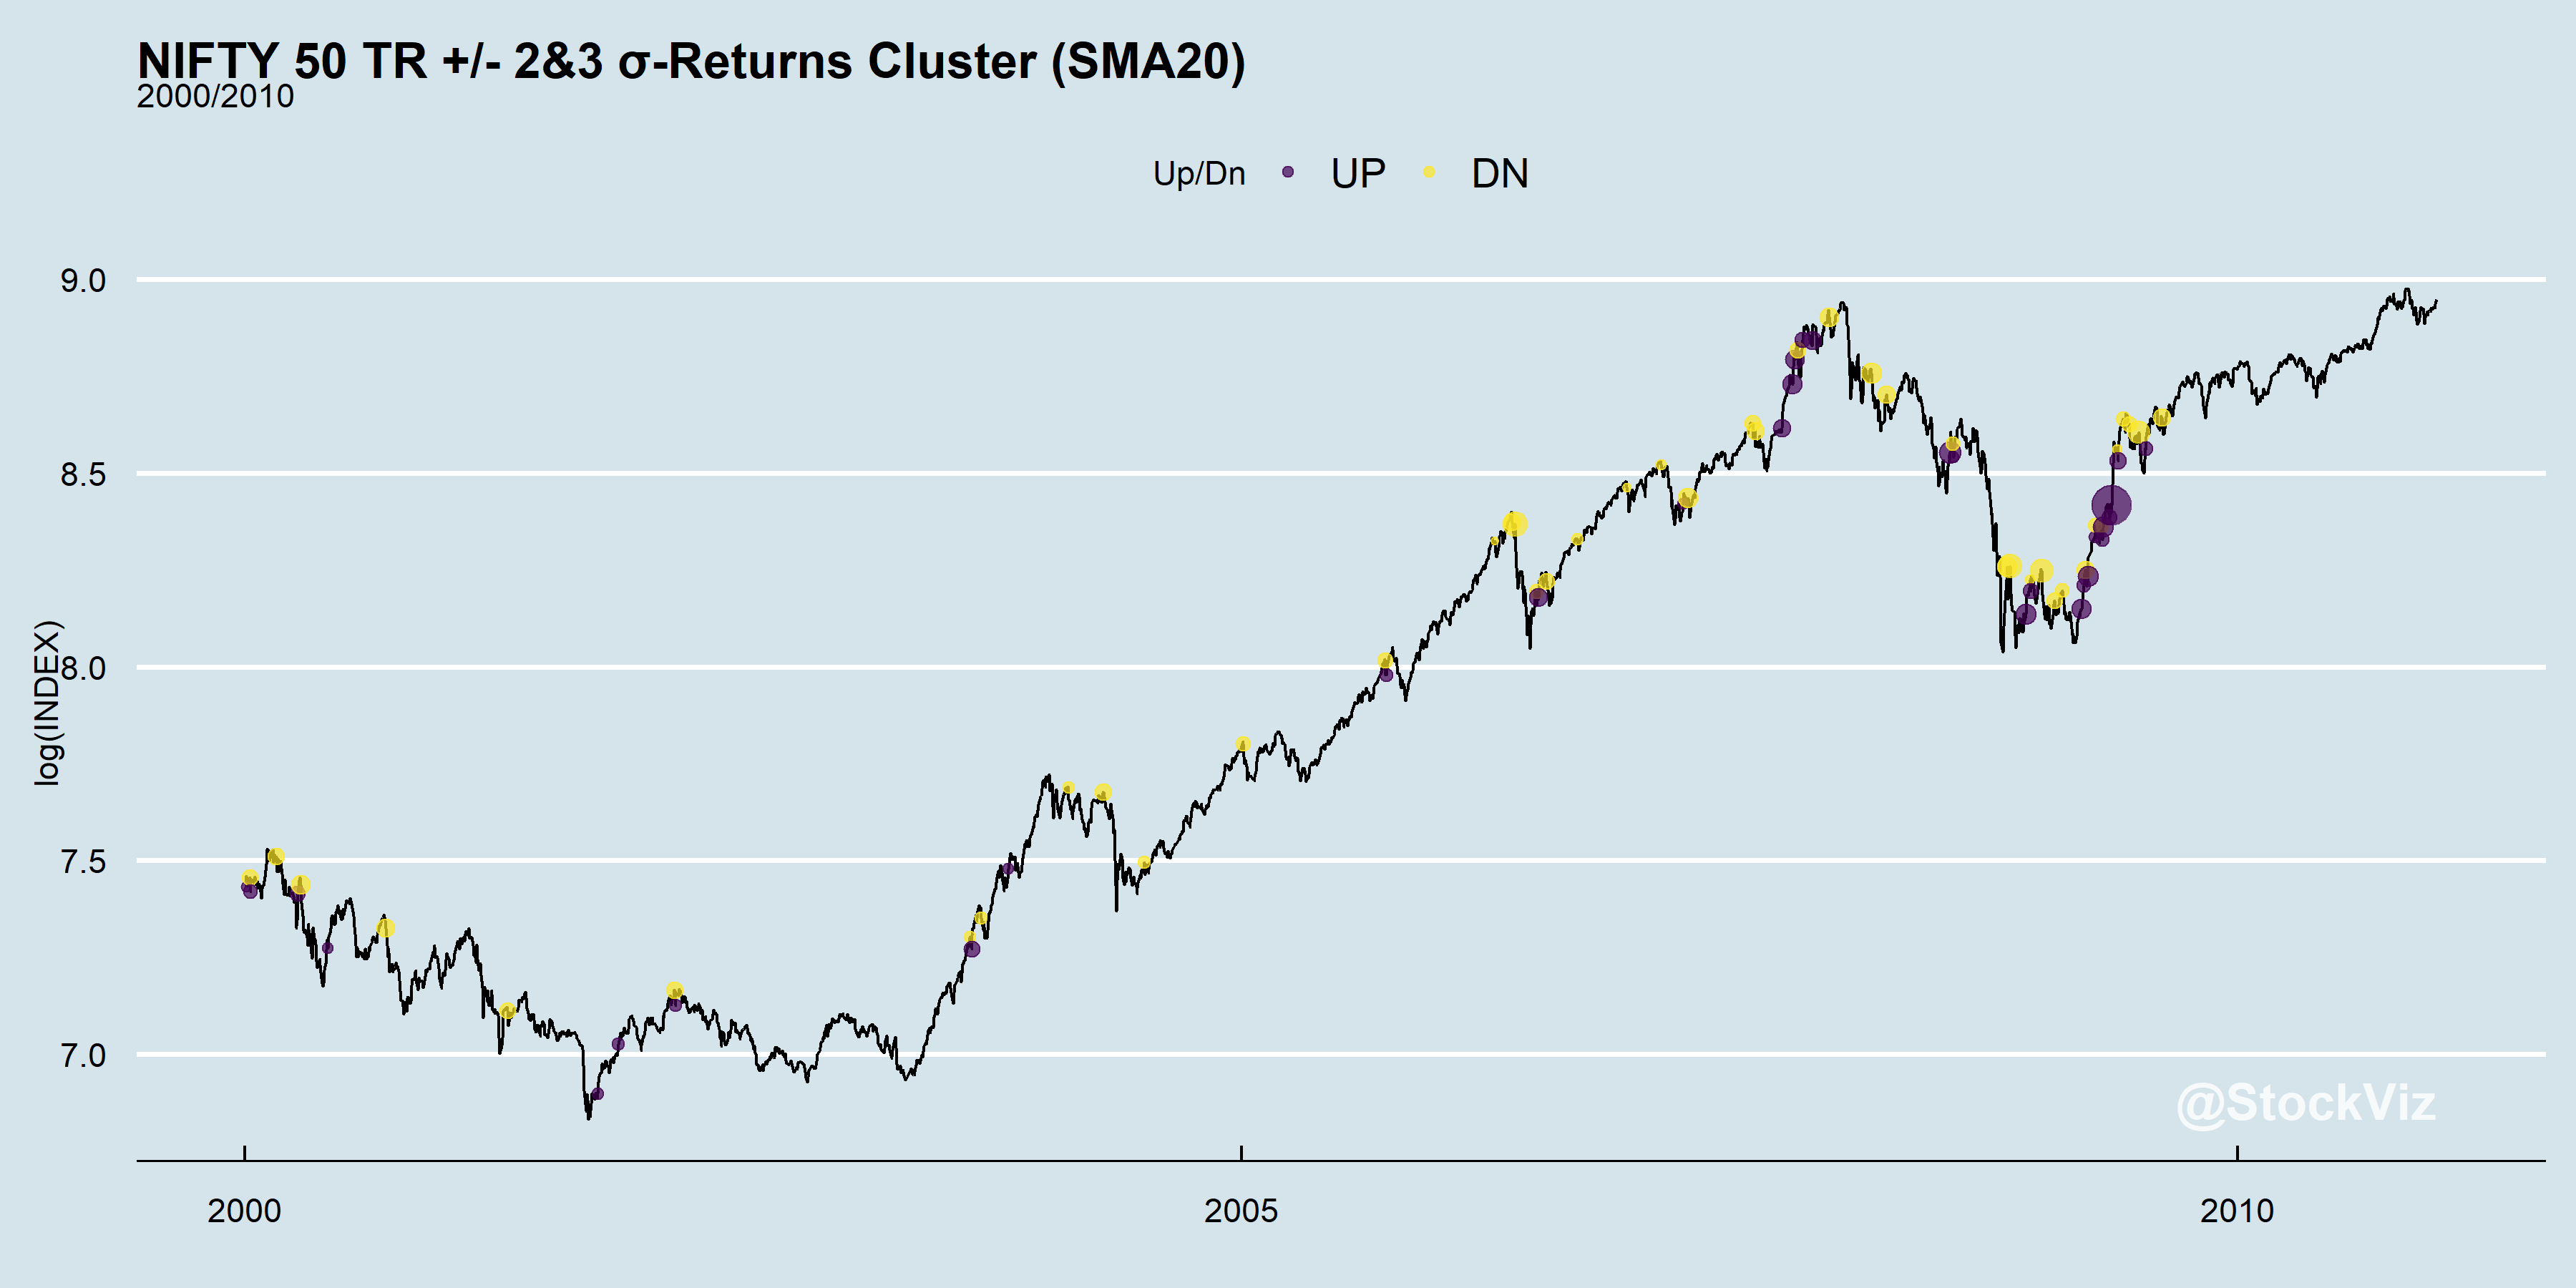
What the histogram above is showing is that most of the 3σ moves have happened within 5 days of each other! Let’s zoom in on a 10-year period of the index and mark the outliers on it:
Now, lets pick a very simple actively managed strategy that tries to side-step the –σ moves. The details of the strategy itself is unimportant. Suffice to say that it creates excess returns compared to buy & hold.
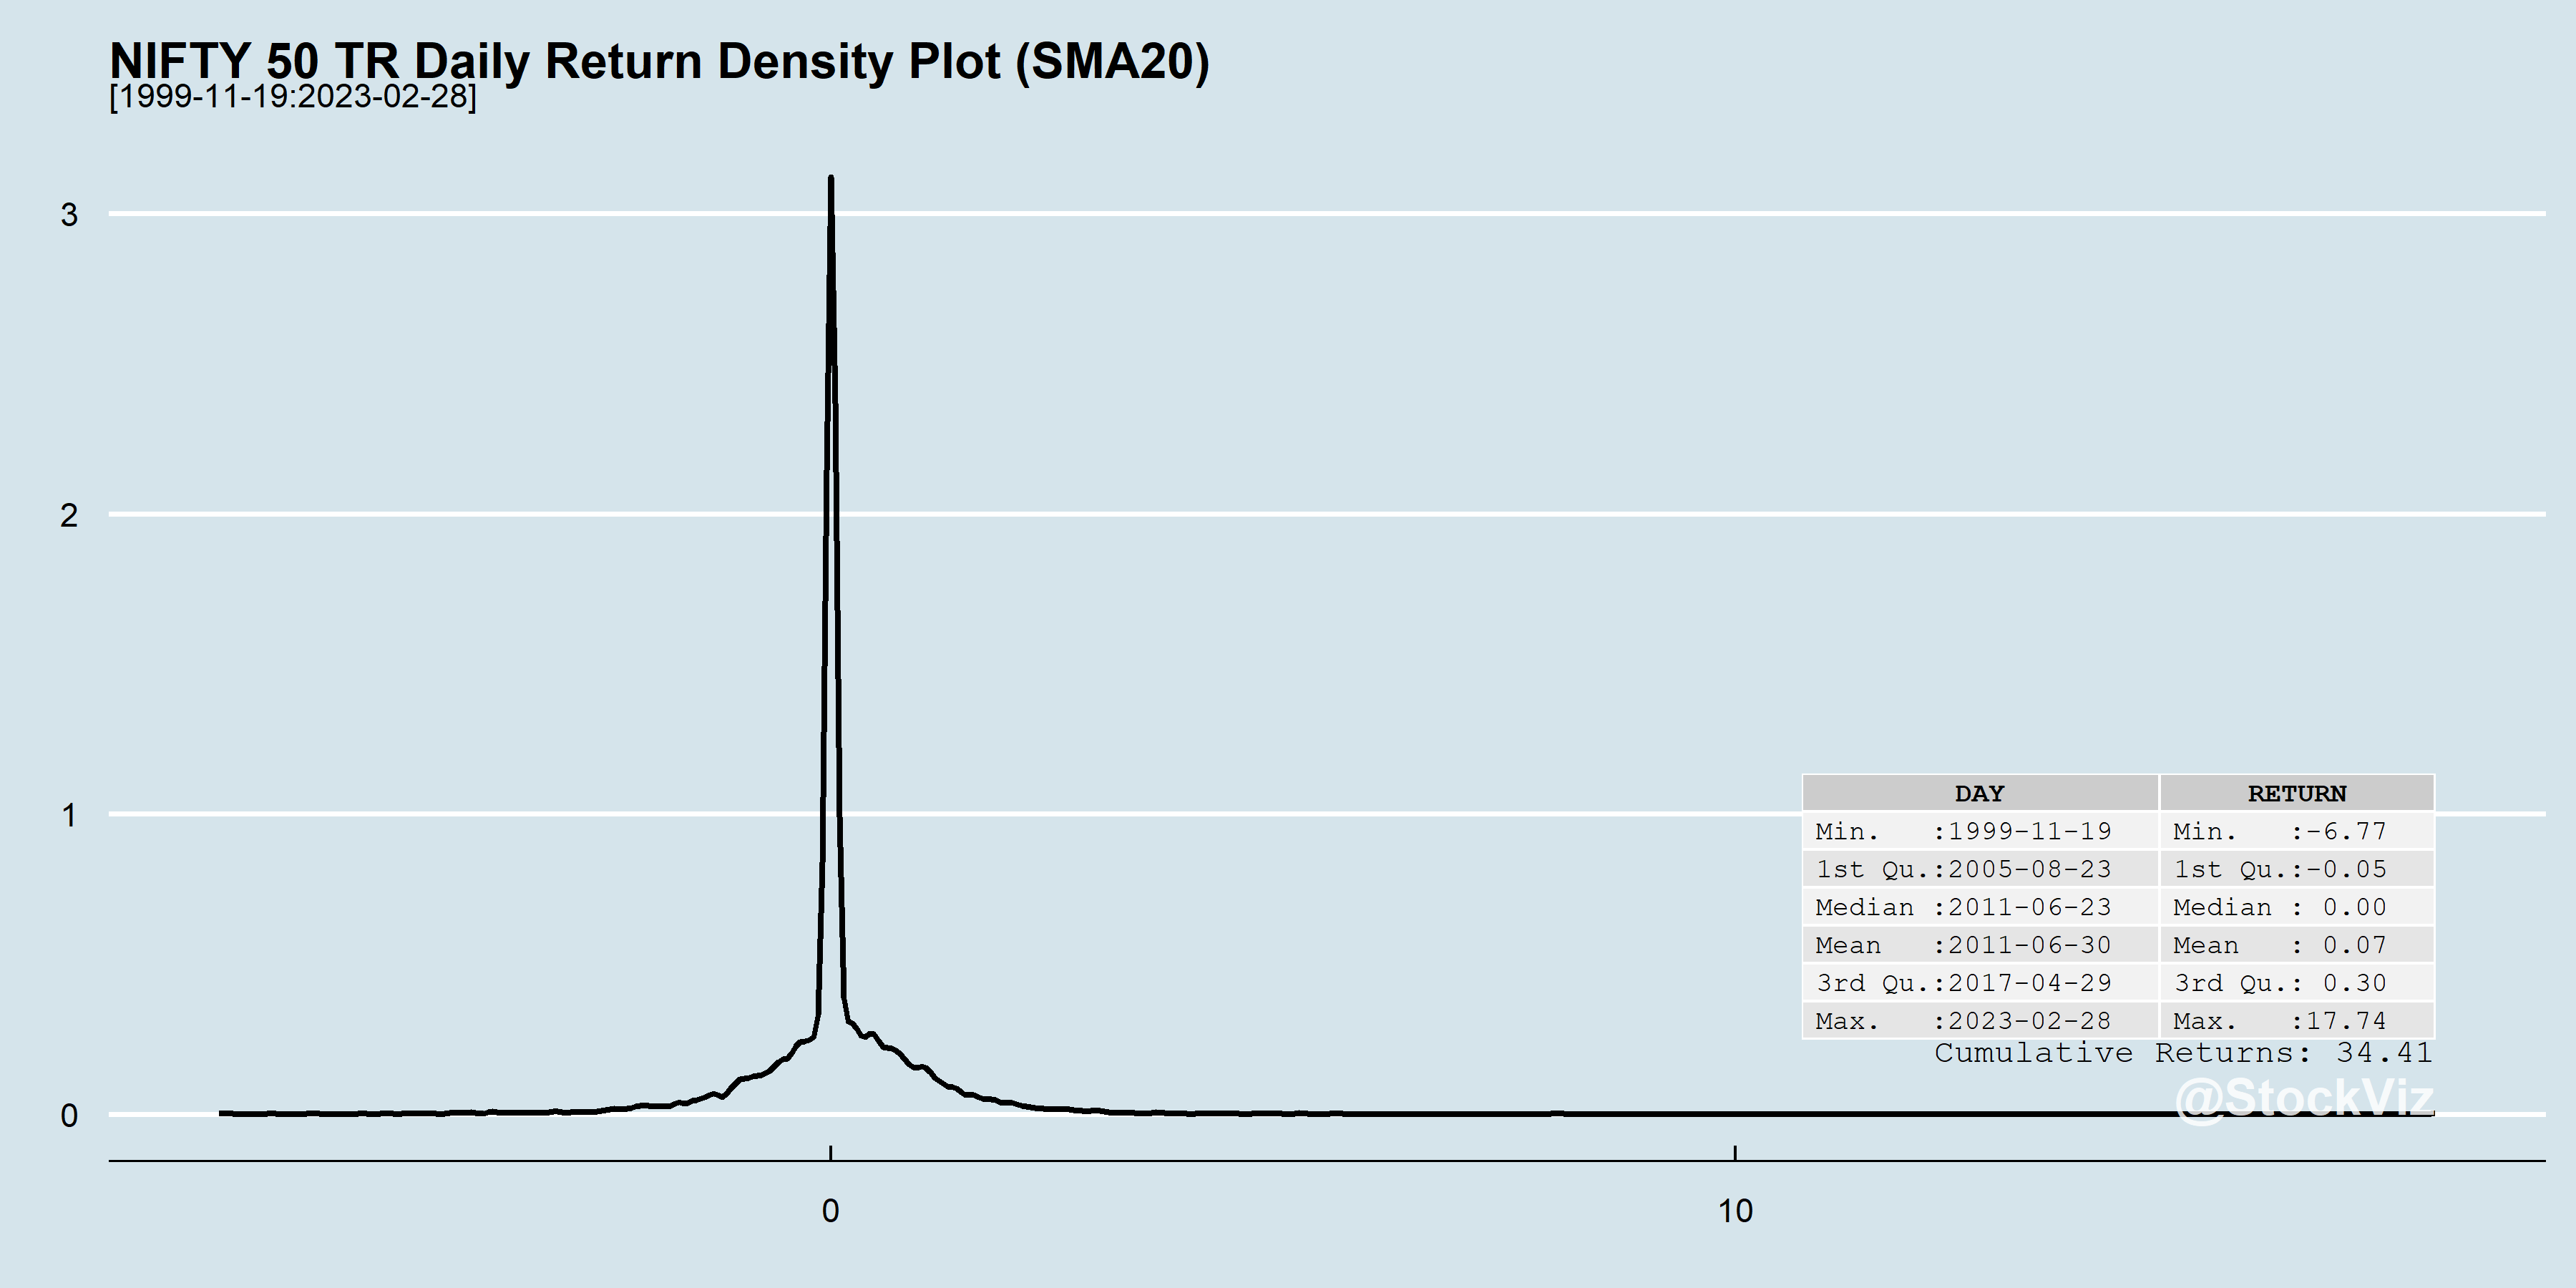
The average daily return of this strategy is 0.07%. The worst daily return is ~ -7% and the best is ~18%. At least some of the left-tail has been clipped but at what cost?
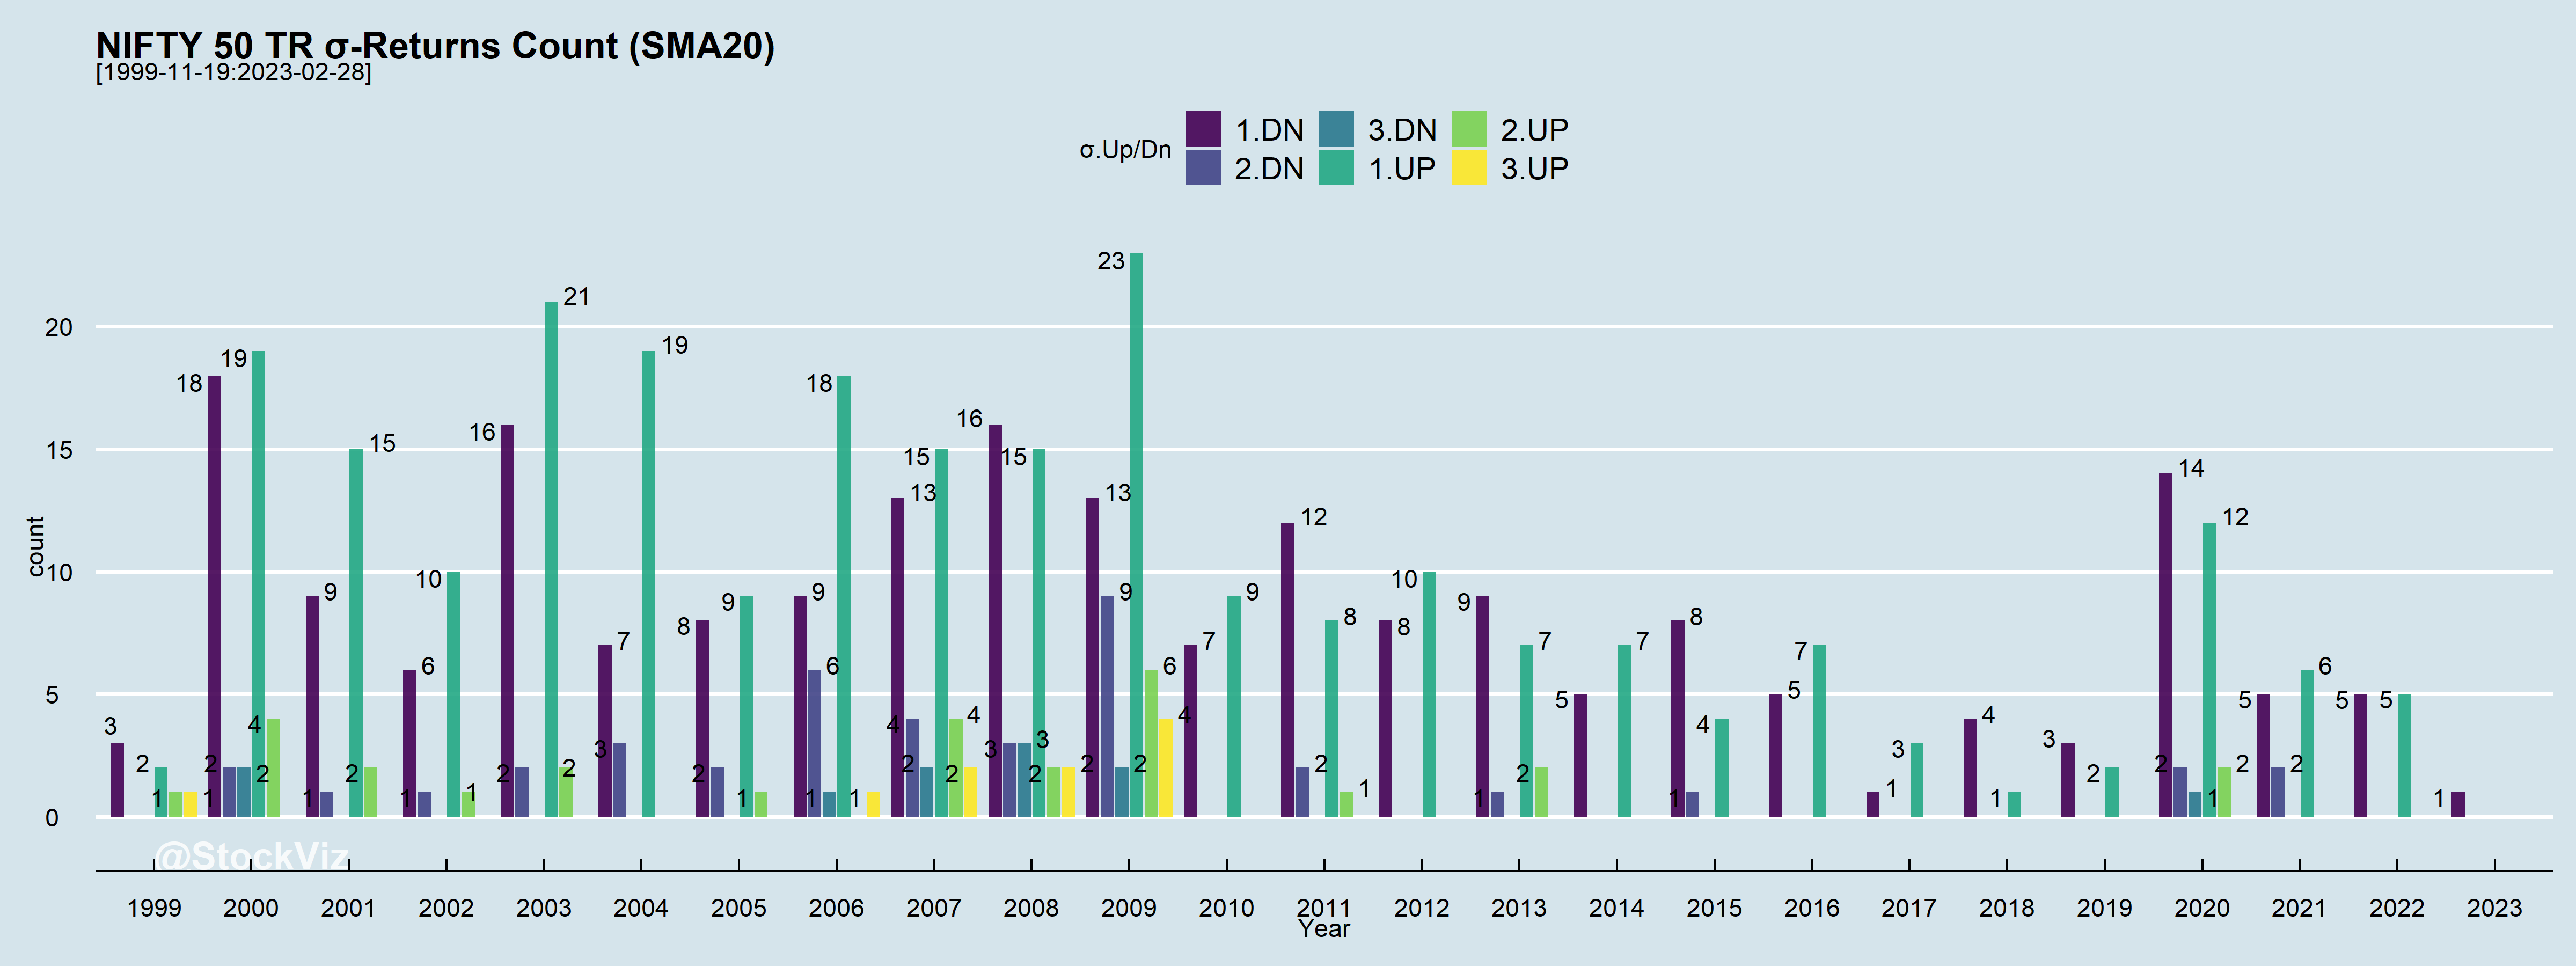
Notice how both the number of large Up and Down days are lower here compared to buy & hold?
Outliers still cluster but there a lot less of them.
This is the nature of market volatility. Investors have to either commit to buy & hold and catch all the moves or commit to an actively managed strategy knowing that while trying to side-step –σ moves, some +σ moves will also be sacrificed. It is the FOMO that keeps investors switching between the two, resulting in sub-par returns.