Tag: technical analysis

Analysis: TCS

Today’s pick is [stockquote]TCS[/stockquote]. The stock has made a 29% since the 1020 levels of October 2011.

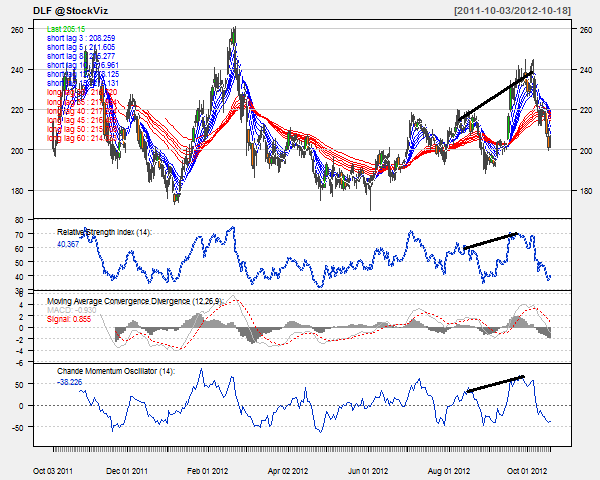
The up-trend since last year saw a tip-off near 1440 levels recently; this can act as a near-term resistance level for the stock. Although the stock has seen two major corrections in the last year, it is still trading above the near-term support of 1290 (long-term resistance) levels and above the long-term support of 1070 levels.

image

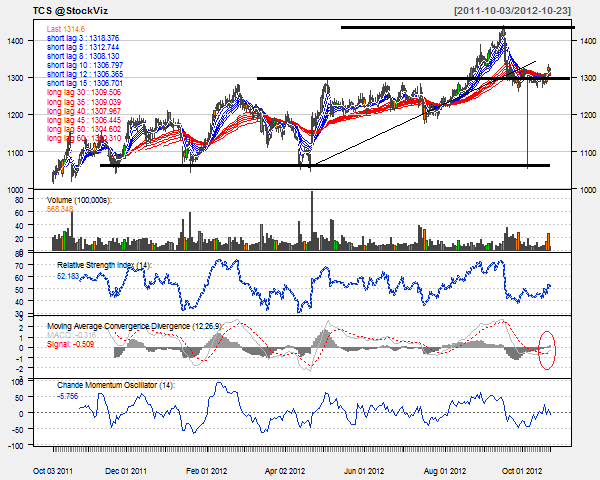
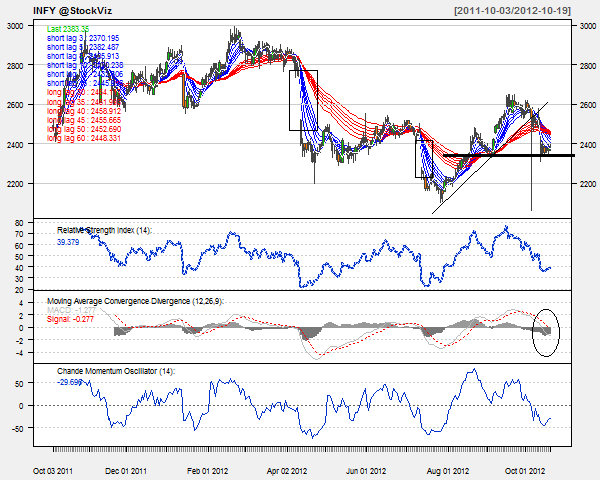
Oscillators RSI and CMO are at currently at 52 and -6. At this mid-level RSI, the stock has still got around 20 points to reach oversold levels. The current CMO level is also not suggesting any imminent move.

The MACD line just penetrated the signal line from below and the histogram levels are on a rise as well. Both these signal are giving a slight signal of a short-term up-trend for the stock.

The GMMA chart currently is not saying anything. Both the long and short-term set of lines are running very close to each other. A departure from the current scenario, either up or down will decide upon the future of the stock.

image

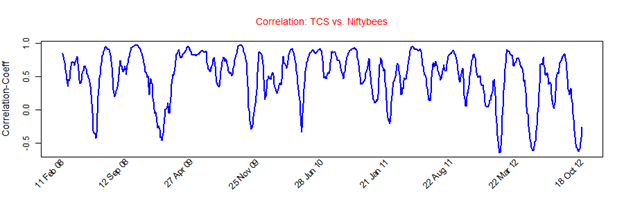
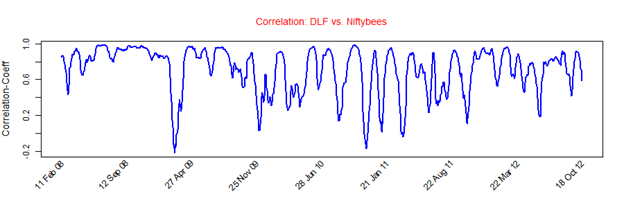
TCS’s average correlation of 0.50 with the Niftybees is positive but not very strong. At this level the movements of the stock will not be able to replicate the same magnitude as Niftybees. [stockquote]NIFTYBEES[/stockquote]

image

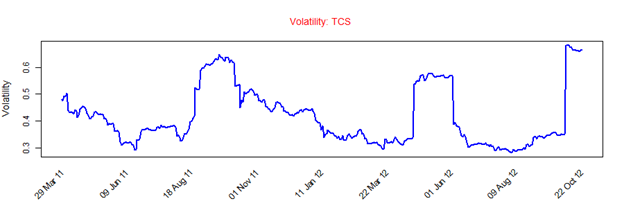
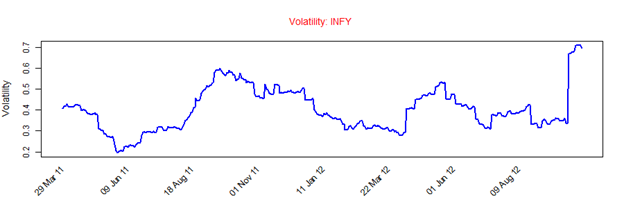
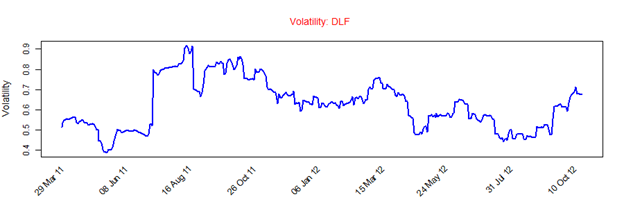
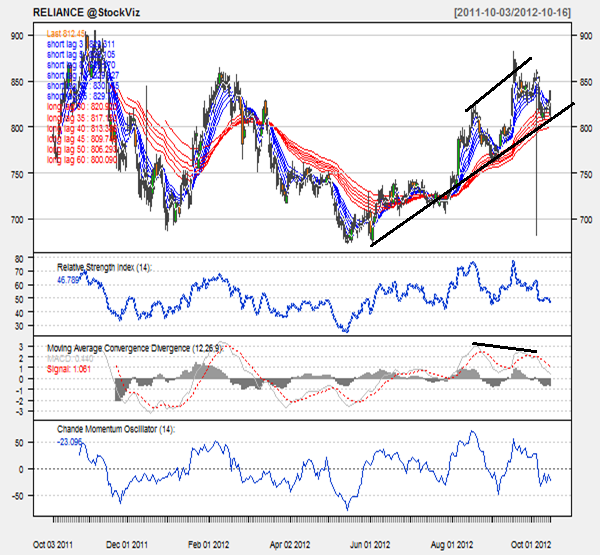
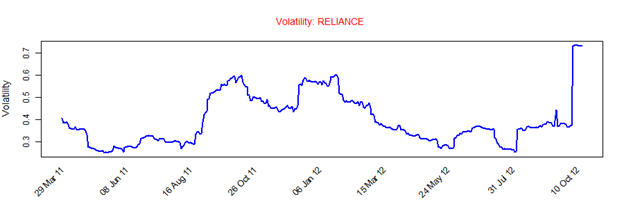
TCS has a historical volatility in the range of 0.2 to 0.7. The current high volatility is a result of the EMKAY trades and it should not be a cause of concern.

Looking at these technicals, it appears that the stock is presently trendless. A short-term hold is suggested. The long-term outlook of the scrip will be decided by how long-term lines of GMMA unravel themselves in the coming days.

Enhanced by Zemanta

Momentum and fades

There are two kinds of moves in the market: defined and undefined. The defined moves have a reason attached to them. It can be a news about the company, a new product launch, a good earning postings or a good news for the industry itself. The undefined moves are… well.. they are just undefined.These undefined moves happen usually because of their momentum. A series of up-days keep pushing the stock up everyday.

The stock rises until it has the momentum going on its side, and once it stops, this is how it falls.

image

image

image

The trend can be your friend… until the momentum ends.

When you go chasing momentum, don’t forget your faithful friend: the trailing stop loss. Unlike the usual stop-loss that you might set while placing your trades, these stop losses are calculated using highs and lows of a defined period and keep your losses at a minimum based on the recent highs.These are best suited for momentum scrips since they are not set to a particular price, unlike the normal stop losses, and automatically locks-in a profit once the momentum fades.

So, next time you want to trade with a momentum stock, be sure to have a trailing stop loss in place. This will be useful not only in minimizing your losses, but also in securing the profits that you have made over the holding period if used properly.

Login to StockViz by clicking on image and go Pro!

Analysis: INFY

Today’s pick is [stockquote]INFY[/stockquote]. Even though the stock has experienced a high of 3000 and a low of 2150 during the last 12 months, it is still trading at roughly the same price as it was a year ago.

The stock has seen two drastic gap downs over the last 7 months. The up-trend since mid-July saw a tip-off near 2600 levels which might act as a near-term resistance level.

Looking at the chart for the last 2 months, a head and shoulder top might seem to be in formation if the current up-trend stalls and take a turn around 2450 levels on higher volumes.

image

Oscillators RSI and CMO are at currently at 39 and -30. At this level of RSI, the stock has still got around 15 points to reach oversold levels. The CMO will also take time to reach the oversold side. These technicals are not giving out any signal currently.

MACD line and signal line are closing in towards each other and histogram levels are dropping off as well. The behavior of histogram (a decreasing slope) can act as an early signal of the imminent short-term up-trend.

The GMMA chart for the long term signal is suggesting a change in direction (uptrend since July) for the scrip. The short term lines are moving up again suggesting an up-trend after the last fall. A penetration of the short term lines with good volumes can bring about the up-trend for the stock.

image

Infosys’s average correlation of 0.53 with the Niftybees is positive but not very strong. At this level the movements of the stock will not be of the same magnitude as Niftybees. [stockquote]NIFTYBEES[/stockquote]

image

Infosys has a historical volatility in the range of 0.2 to 0.6. The current volatility is is a result of the EMKAY trades and it should not be a cause of concern.

Looking at these technicals, it appears that the stock is presently nearing oversold territory. A short term buy would be a good idea but for the long term you might want to wait and watch until those long term lines of GMMA dis-entangle themselves to take a stand.

Enhanced by Zemanta

Analysis: DLF

Today’s pick is [stockquote]DLF[/stockquote]. Even though the stock experienced a strong uptrend around June, it is still trading at roughly the same price as it was a year ago. 

image

Oscillators RSI and CMO are at currently at 40 and -39. At this level of RSI, the stock is at oversold levels (according to the historical RSI levels). The CMO is closing in towards the oversold side. Both the technicals are showing a buy signal.

MACD line and signal line are drifting apart from each other and histogram levels are fairly stagnant. The behavior of histogram (a decreasing slope) can act as an early signal of the imminent short-term up-trend.

The GMMA chart is just too messy. The long-term lines are moving close to each other (signaling a probable change of previous trend) and the decreasing separation in the short term lines suggest that the traders should be on a lookout for a spike in volatility in the near-term.

image

DLF’s average correlation of 0.71 with the Niftybees proves to be a strong and positive correlation. At this level the movements of the stock will be of the similar magnitude as Niftybees. [stockquote]NIFTYBEES[/stockquote]

image

DLF has a historical volatility in the range of 0.4 to 0.9. The volatility is currently in the middle range and currently should not be a matter of concern to the traders.

Looking at these technicals, it appears that the stock is presently nearing oversold territory. A short term buy would be a good idea but for the long term you might want to be on your back foot. Resistance levels are around Rs. 240 (Rs. 260 long-term) and a very strong support is visible around 180 levels.

Enhanced by Zemanta

Analysis: RELIANCE

This week’s pick is [stockquote]RELIANCE[/stockquote]. Trading at around the same price as an year ago, the stock has made a meager return of 3% over the last 12 month period. The stock is in constant uptrend since May, with a few small corrections in between after it found the support at 670 levels.

Untitled

Oscillators like RSI and CMO are at currently at 47 and -23. At this level of RSI, the uptrend has no potential stops in the very near future. And looking at the previous highs of RSI, the stock can see an up-move till RSI reaches close to 75. The CMO as well is in the middle, and moving close to the -50 levels. If it gets too close to -50, it will signal a buy.

MACD line and signal line are drifting apart from each other and histogram levels are stagnant, but a higher high in the prices with lower highs in the MACD line is a divergence. This behavior can be suggesting the imminent change in the direction of the prices.

Looking at GMMA for a medium to long term outlook is not giving a lot of indication. The long term lines are moving close to each other (signaling a probable change of previous trend). The decreasing separation in the short term lines also suggests a lookout period for the near term.

image

Reliance’s average correlation of 0.73 with the Niftybees suggests that the correlation is quite strong and positive, and the movements will be of the similar magnitude as Niftybees. [stockquote]NIFTYBEES[/stockquote]

image

Reliance has volatility in the range of 0.2 to 0.6 for the most part, which is not a very big range. The volatility is currently at sky high levels of beyond 0.7, higher compared to the recent past. A constant eye is required on the scrip in case it makes a sudden move.

The up-trend is quite prominent. Looking at these technical, a short term buy is good but for the long term you might want to be cautious as the stock can check for the resistance levels at Rs. 900.

Enhanced by Zemanta