Tag: technical analysis

Technical Analysis of the Financial Markets: Ch 7

This is a review of the 7th chapter of John J. Murphy’s Technical Analysis of the Financial Markets.

Volume and Open Interest

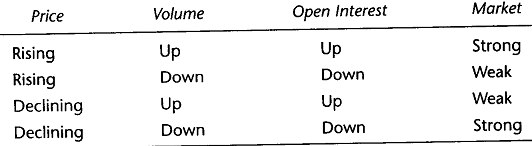
Volume and Open Interest (OI for short) are used as confirming indicators. OI is simply the total number of outstanding contracts at the end of each day in the options/futures market. This handy table explains how OI changes:


image

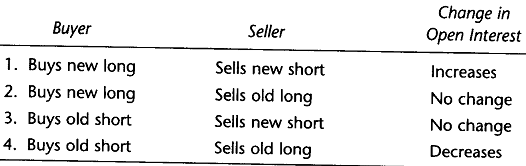
(In #3 for example, the seller is initiating a new short where as the buyer is covering an old long.)


General rules

image

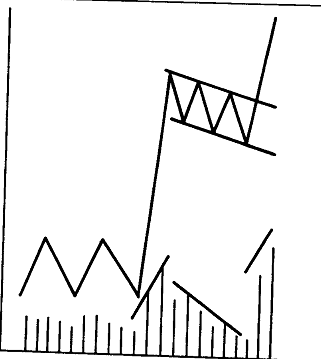
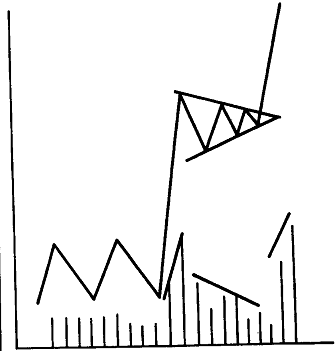
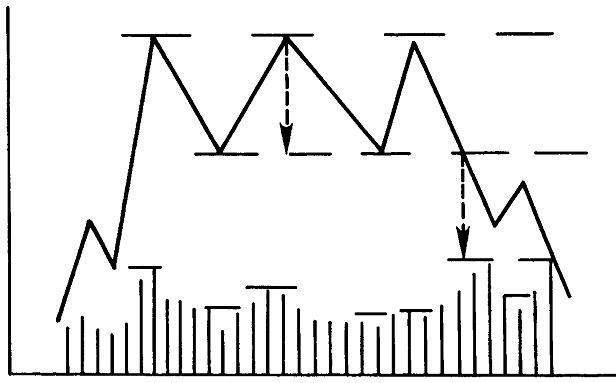
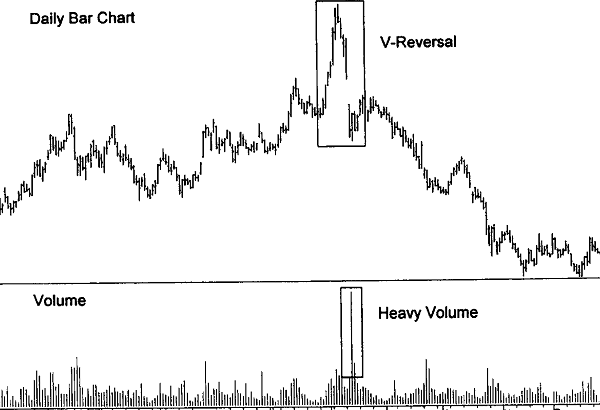
Simply put: volume should increase in the direction of the existing price trend. For example, in an uptrend, if a penetration of a previous high occurs on diminishing volume, the divergence should alert the trader. As a rule, all breakouts should occur on high volume.

On the other hand, if Open interest is

  1. Rising in an uptrend, it is bullish (new money is entering the market)
  2. Declining in an uptrend, it is bearish (short covering rally)
  3. Rising in a downtrend, it is bearish (new money is entering the market)
  4. Declining in a downtrend, it is bullish (longs are getting liquidated)

On Balance Volume (OBV)

OBV is used to bring out the trend in volume. OBV is calculated by adding (subtracting) each day’s volume to a running cumulative total when the security’s price closes higher (lower). As a general rule: OBV should follow the same direction as the price trend. The Money Flow Index is a variation of OBV that is weighted by the price.

Put/Call Ratios

Monitoring the volume in calls (bulls) vs. puts (bears) allows us to gauge the degree of bullishness/bearishness i.e., when option traders are bullish, Put/Call ratios fall and v.v. It is usually used as a contrary indicator. A very high ratio signals an oversold market. A very low ratio warns of an overbought market.

Up Next: Chapter 9 – Moving Averages


Technical Analysis of the Financial Markets: Ch 6

This is a review of the 6th chapter of John J. Murphy’s Technical Analysis of the Financial Markets.

Continuation Patterns

Continuation patterns are shorter terms patterns that indicate that a current price action is nothing more than a pause in an existing trend and that the previous trend will resume later.

Triangle

There are three types of triangles:

  1. Symmetrical (coil): Formed out of two trendlines where the upper one descending and the lower line ascending.
  2. Ascending: Formed out of a rising lower line and a flat upper line.
  3. Descending: Formed out of a flat lower line and a descending upper line

image

image

image


The Broadening Formation (Megaphone Top)

imageIt looks like a triangle turned backwards and represents an out-of-control market. Volume tends to increase along with the wider price swings.


Flags and Pennants

Flags and Pennants represent brief pauses in a one-directional market and they need to be preceded by sharp, straight line moves.

image

A flag should slope against the trend and volume should dry up during the formation and build again during the breakout. The flag usually forms during the mid-point of the move.

A Pennant represents a small symmetrical triangle. imageVolume should be light during its formation. The move after the pennant should duplicate the move before its formation.

Both patterns are short-term and should be completed within 1-3 weeks with volumes drying up during their formation.

The Wedge

The wedge formation is very similar to a symmetrical triangle, except that it has a prominent slant. A falling wedge is considered bullish whereas a rising wedge is considered bearish.

image

image

The Rectangle (Trading Range)

It usually just represents a consolidation area after which the previous trend resumes. A decisive close outside the upper/lower boundary signals a completion.

The Measured Move (Swing)image

It describes the movement of a stock when a major advance or decline is divided into two equal and parallel moves. The moves should be fairly orderly and well defined.


The Continuation Head & Shoulders

The price action looks similar to a Rectangular pattern except that the middle trough, in an uptrend, tends to be lower than the other two shoulders. In a downtrend, the middle peak exceeds the other two peaks.

image

image


Next: Chapter 7 – Volume & Open Interest

Technical Analysis of the Financial Markets: Ch 5

This is a review of the fifth chapter of John J. Murphy’s Technical Analysis of the Financial Markets.

Triple Tops and Bottoms

imageTriple Tops, as the name indicates, are identified as three peaks at the same level. Volume decreases with each successive peak at the top and should increase at the breakdown point.

Return moves to the lower lines are not uncommon.

Double Tops and Bottomsimage

This pattern has two peaks (A&C) at about the same levels. The pattern is complete once the middle trough (B) is broken on a closing basis. Volume is lighter on the 2nd peak (C) and increases on the breakdown (D).


Saucers and Spikes

The saucer pattern shows a gradual turn from down to sideways to up and take a long time to form. Spikes are the most difficult to predict and usually occur when the markets are so overextended on one side that a piece of news or event triggers a sudden movement to the other side.

imageimage

Next: Chapter 6 – Continuation Patterns

Technical Analysis of the Financial Markets: Ch 5

This is a review of the fifth chapter of John J. Murphy’s Technical Analysis of the Financial Markets.

The Head & Shoulders Reversal Pattern

image

The basic ingredients are:

  1. A prior uptrend
  2. A left shoulder (A) followed by a corrective dip (B)
  3. A rally into a high on light volume (C)
  4. A decline (D) that moves below (A)
  5. A third rally (E) that fails to reach (C)
  6. A close below the neckline (F)
  7. A return move back to the neckline (G) followed by new lows.

Once prices move through a neckline and completed the h&s pattern, they should not re-cross the neckline again. A decisive penetration of the neckline might indicate a false alarm.

The inverse head & shoulders is pretty much the inverse of the image above.

Next up: Triple Tops & Bottoms

Technical Analysis of the Financial Markets: Ch 5

This is a review of the fifth chapter of John J. Murphy’s Technical Analysis of the Financial Markets.

Major Reversal Patterns

The 5 most commonly used reversal patterns are:

  1. Head & Shoulders
  2. Triple Tops & Bottoms
  3. Double Tops & Bottoms
  4. Spike (or V) Tops & Bottoms
  5. Rounding (or Saucer)

Things to keep in mind while looking at reversal patterns:

  1. A prior trend should exist (the market should have something to reverse)
  2. The first sign of impending reversal is the breaking of a trendline
  3. The larger the pattern, the greater the impending move
  4. Topping patterns are usually steeper and more volatile than bottoms
  5. Bottoms have smaller price ranges and take longer to build
  6. Volume is more important on the upside

We will examine each of the 5 patterns above in subsequent posts.