Tag: technical analysis

Analysis: DRREDDY (RDY)

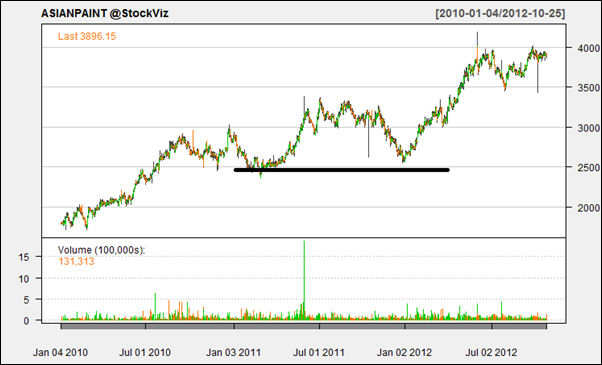
Today’s pick is [stockquote]DRREDDY[/stockquote]. The last year saw the stock trading in a 1500 to 1800 range and the stock is in an up-trend since July lows. In the last three month period, the stock was up 5.5% vs. the Nifty’s 8.3%. The stock is approaching 52-week resistance at 1815 levels, after bouncing off the support at 1500 levels.

image

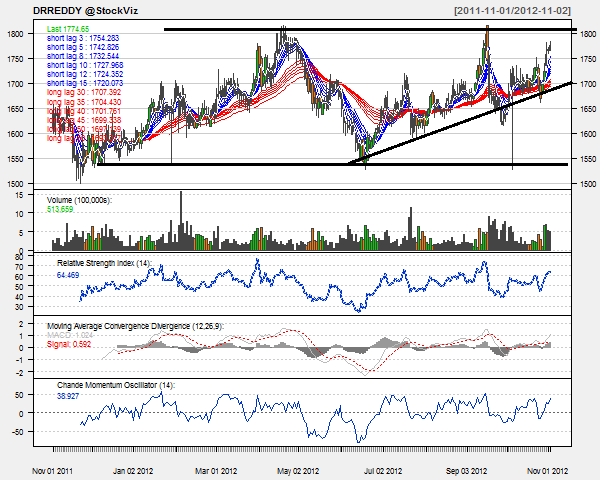
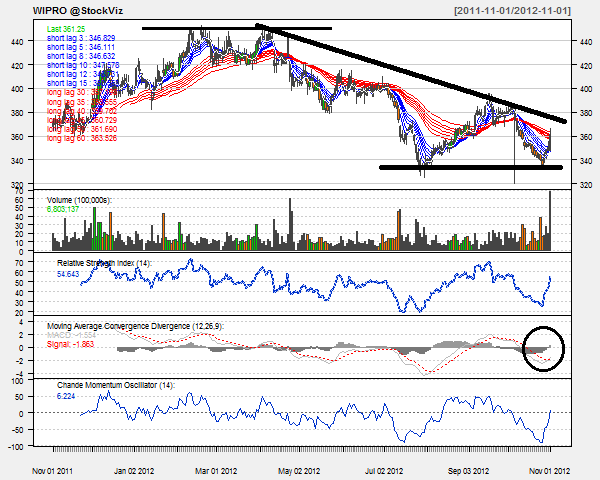
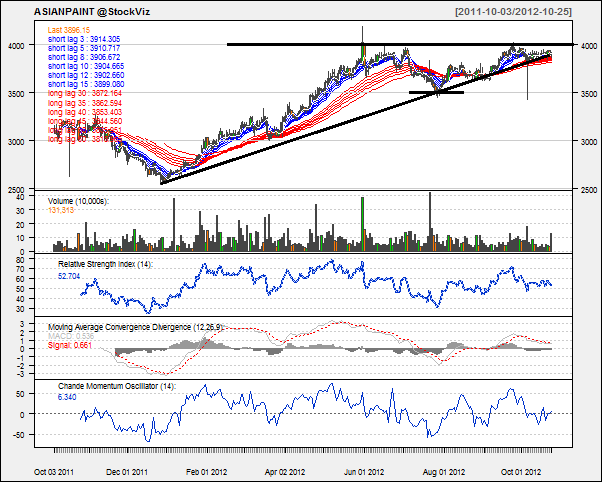
Oscillators RSI and CMO are at currently at 64 and 39 and are closing in towards the over-bought territory.

MACD line and the signal line are departing from each other on a positive note; the histogram levels are rising as well in-sync with the short-term up-trend.

The GMMA chart shows both long-term and short-term lines fanning out. If this continues, it would be extremely bullish for the stock.

image

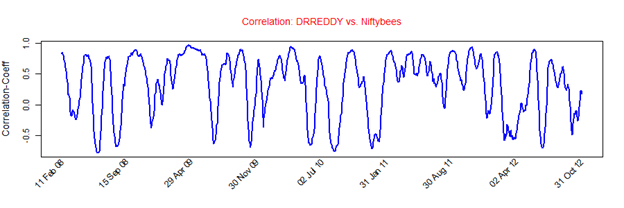
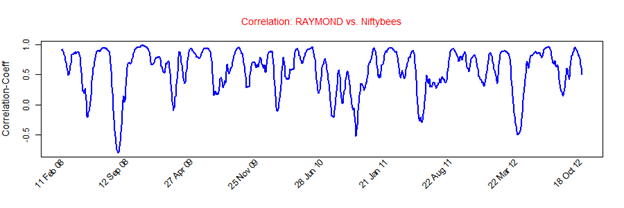
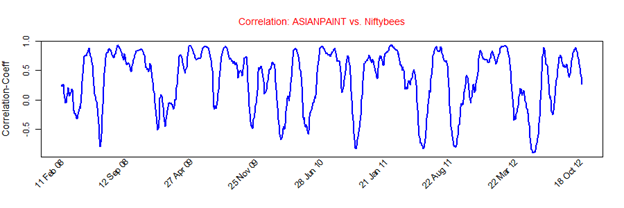
DRREDDY’s average correlation of 0.33 with the Nifty is positive. The stock will not replicate the movements of Nifty closely because of the low co-efficient. [stockquote]NIFTYBEES[/stockquote]

image

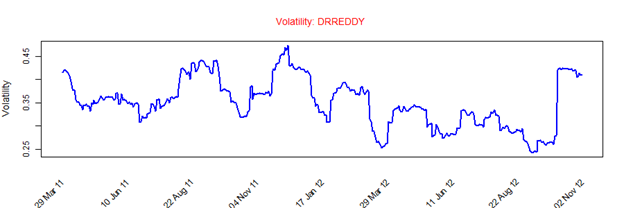
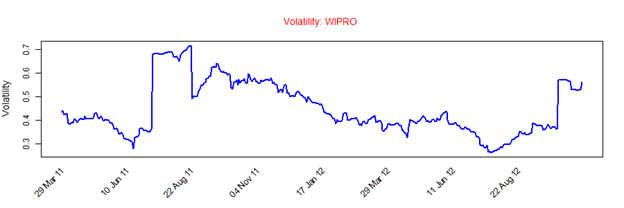
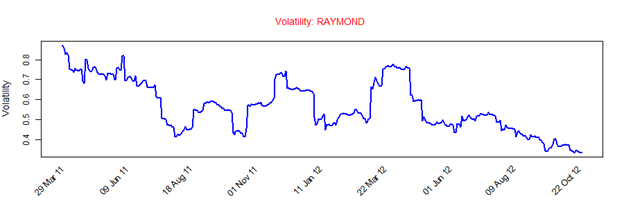
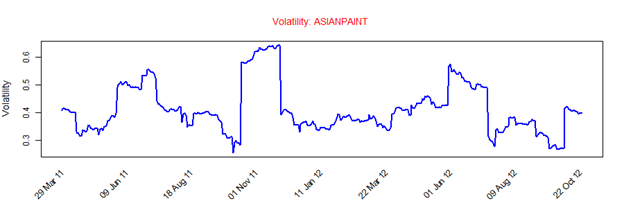
DRREDDY has a historical volatility in the range of 0.25 to 0.45 which is a very narrow range. The scrip’s volatility is currently in the middle range and hence should not be a concern.

image

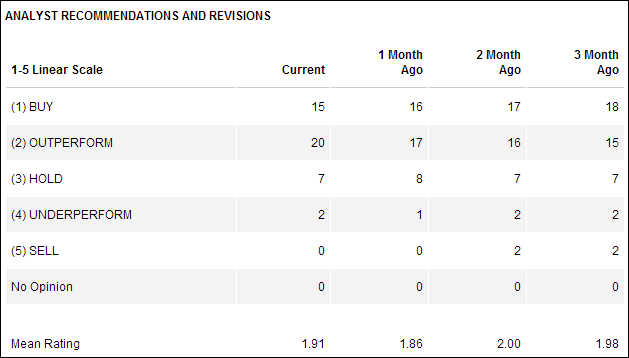
Analysts already have high expectations regarding this stock, as is evident from the very high proportion of the buy and outperform calls. A single earnings miss from the firm, or an analyst downgrade might trigger a steep slide in the stock.  Also, insiders have sold about Rs. 3.5 Cr. worth of NCD’s in the last one month period.

Looking at these technicals a short-term hold is suggested. A break-out/continued resistance at the 1800 levels will be essential to direct the stock either to an up-trend/down-trend.

Enhanced by Zemanta

Analysis: WIPRO

Today’s pick is [stockquote]WIPRO[/stockquote]. The last year saw the stock trading in a 330 to 450 range and the stock just tested the support levels around 52 week lows. In the past 50 days the stock made return of 3.8% as against 6.2% made by Nifty.

The stock has been in a down-trend since April this year, with a support near the 335 levels and resistance around 450.

image

Oscillators RSI and CMO are at currently at 54 and 6 and are hovering in the no man’s land.

MACD line just crossed the signal line and is on a rise; the histogram levels are rising as well suggesting short-term up-trend.

The GMMA chart is not suggesting any directional move as of now. The short-term lines are constricting and long-term lines are spreading. When the lines fan out, we will be able to take a stand on the direction. image

WIPRO’s average correlation of 0.56 with the Nifty is positive and strong. The stock will not replicate the movements of Nifty closely. [stockquote]NIFTYBEES[/stockquote]

image

WIPRO has a historical volatility in the range of 0.3 to 0.7. The scrip’s volatility is currently in the middle range and hence should not be a concern to the traders.

Looking at these technicals a short-term buy is suggested. For the long-term outlook of the scrip we will have to wait for GMMA lines to give some direction.

Analysis: TATASTEEL

Today’s pick is [stockquote]TATASTEEL[/stockquote]. The last year saw the stock trading in a 350 to 500 range and is currently trading around the same price.

The stock has been in a down-trend since February this year, with a support near the 350 levels and resistance around 470.

image

Oscillators RSI and CMO are at currently at 41 and -35 and are hovering close to the oversold territory.

MACD line and signal line are at a distance; the histogram levels are stagnant suggesting a short term consolidation.

The GMMA chart is not suggesting any directional move. The short-term lines and long-term lines are too close to each other.

image

TATASTEEL’s average correlation of 0.73 with the Nifty is positive and quite strong. The stock tends to replicate the movements of Nifty quite closely. [stockquote]NIFTYBEES[/stockquote]

image

TATASTEEL has a historical volatility in the range of 0.3 to 0.8. The scrip’s volatility is currently in the middle range and hence should not be a concern to the traders.

Looking at these technicals a short-term hold is suggested. For the long-term outlook of the scrip a decisive breakout above the trend-line will suggest a change in the current down-trend.

After coming out with a positive result in Q3, U.S. Steel expects a global slowdown in the metal demand for the Q4. Will it be the same scenario for the TATASTEEL for the coming quarter as well?

Enhanced by Zemanta

Analysis: RAYMOND

Today’s pick is [stockquote]RAYMOND[/stockquote]. The stock has made a 12% since the Rs. 335 levels of last October.

The up-trend since January this year has seen resistance around the 420 levels a few times. The stock has seen many corrections in the last one year, and is trading above the near-term support of 340.

image

Oscillators RSI and CMO are at currently at 53 and -4. At this level of RSI, the stock has to decide on which way to go. CMO doesn’t suggest an imminent move either.

The MACD and signal lines are closing in. The histogram levels are on a decline suggesting a possibility of an up-move.

The GMMA chart for the stock is not suggesting a directional move, one way or the other. The short-term lines are very close to each other and the long-term lines are entangled.

image

Raymond’s average correlation of 0.57 with the Niftybees is positive and strong. At this level, the stock will not replicate the Niftybees. [stockquote]NIFTYBEES[/stockquote]

image

Raymond has a historical volatility in the range of 0.4 to 0.8. The scrip’s volatility is currently on a decline because of the consolidation phase the stock is undergoing.

Looking at these technicals, it appears that the stock is presently in the consolidation territory. A short-term hold is suggested. For the long-term outlook of the scrip, watch the long-term GMMA lines to surface a trend.

Enhanced by Zemanta

Analysis: ASIANPAINT

Today’s pick is [stockquote]ASIANPAINT[/stockquote]. The stock has made a 24% since the 3130 levels of October 2011.

The up-trend since January this year has seen resistance around the 4000 levels twice already; this will act as a near-term resistance level. The longer-term chart shows a support around 2500.

image 

The stock is currently exhibiting a long-term flag formation. A decisive breakout above the 4000 levels can initiate the next leg of up-trend.

image

Oscillators RSI and CMO are at currently at 52 and 6. At this mid-level RSI, the stock has still got around 20 points to reach either oversold or overbought levels. The current mid-range CMO is also unable to suggest any imminent move.

MACD line and signal line are also getting in a twist. The static histogram levels are adding onto the trendless-ness of the scrip.

The GMMA chart although seems to direct a good news for the long-term. The short-term lines are very close to each other and not directing anything, but the expanding long-term lines are giving out a good cue for the scrip. A continuity of the same behavior will decide upon the fate of the stock for the coming months.

image

ASIANPAINT’s average correlation of 0.35 with the Niftybees is positive but not strong. At this level the movements of the stock will not be able to replicate the same magnitude as Niftybees. [stockquote]NIFTYBEES[/stockquote]

image

ASIANPAINT has a historical volatility in the range of 0.2 to 0.7. The scrip’s volatility is currently in the middle of this range.

Looking at these technicals, it appears that the stock is presently in the consolidation territory. A short-term hold is suggested. For the long-term outlook of the scrip, a breakout of the flag in either direction would be a very strong signal.

Enhanced by Zemanta