Today’s pick is [stockquote]DLF[/stockquote]. Even though the stock experienced a strong uptrend around June, it is still trading at roughly the same price as it was a year ago.
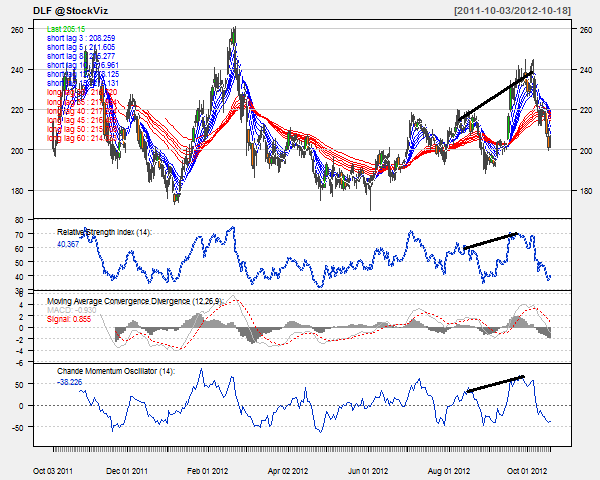
Oscillators RSI and CMO are at currently at 40 and -39. At this level of RSI, the stock is at oversold levels (according to the historical RSI levels). The CMO is closing in towards the oversold side. Both the technicals are showing a buy signal.
MACD line and signal line are drifting apart from each other and histogram levels are fairly stagnant. The behavior of histogram (a decreasing slope) can act as an early signal of the imminent short-term up-trend.
The GMMA chart is just too messy. The long-term lines are moving close to each other (signaling a probable change of previous trend) and the decreasing separation in the short term lines suggest that the traders should be on a lookout for a spike in volatility in the near-term.
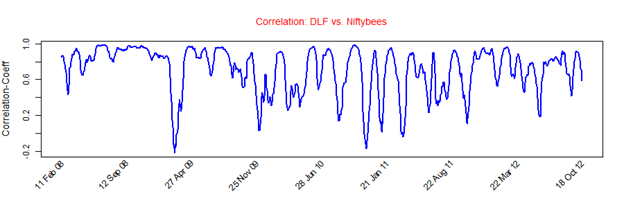
DLF’s average correlation of 0.71 with the Niftybees proves to be a strong and positive correlation. At this level the movements of the stock will be of the similar magnitude as Niftybees. [stockquote]NIFTYBEES[/stockquote]
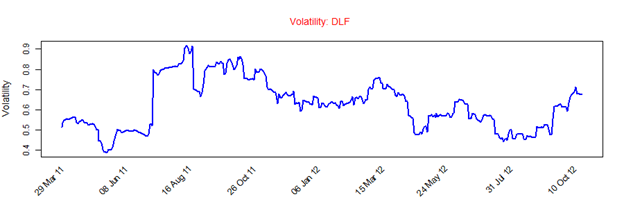
DLF has a historical volatility in the range of 0.4 to 0.9. The volatility is currently in the middle range and currently should not be a matter of concern to the traders.
Looking at these technicals, it appears that the stock is presently nearing oversold territory. A short term buy would be a good idea but for the long term you might want to be on your back foot. Resistance levels are around Rs. 240 (Rs. 260 long-term) and a very strong support is visible around 180 levels.
