Tag: technical analysis

Technical Analysis of the Financial Markets: Ch 4

Last part of the review of the 4th chapter of John J. Murphy’s Technical Analysis of the Financial Markets.

Reversal Days

image
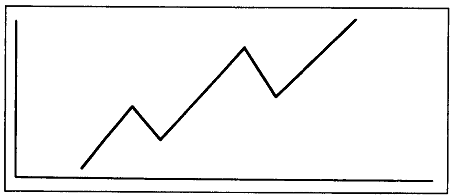
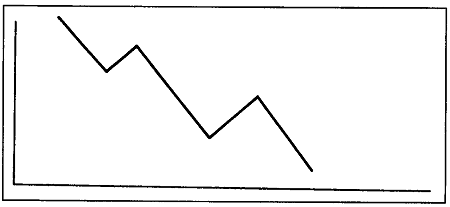
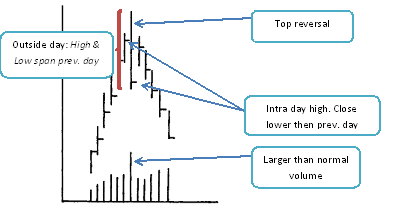
A reversal day happens either at the top of an uptrend (top reversal day) or at the bottom of a downtrend (bottom reversal day). A top reversal day is the setting of an intraday high for the uptrend followed by a close below the previous day’s close. A bottom reversal day is the setting of an intraday low for the downtrend followed by a close above the previous day’s close. The wider the intraday range, the higher the probability of a near term trend reversal.

A reversal pattern can form on monthly and weekly charts and usually bears greater significance compared a reversal day.

Price Gaps

Price gaps are areas in the chart where no trading has taken place. There are three types of gaps:

  1. Breakaway: the penetration of a resistance level usually occurs through a Breakaway Gap and signifies a major move. It occurs on heavy volume and upside gaps usually act as support levels. Its important that prices do not fall below these gaps during an uptrend.
  2. Runaway: formed after a trend is in play for a while (usually the halfway point), these are prices leaping upward on moderate volume. If these gaps are filled, then its usually a sign of weakness.
  3. Exhaustion: as the name suggests, it usually occurs at the end of a trend. After the identification of both the Breakaway and Runaway gaps, one should start expecting the Exhaustion gap. The filling of this gap during an uptrend is a bearish signal.

The Island Reversal Patternimage

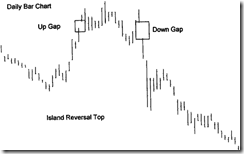
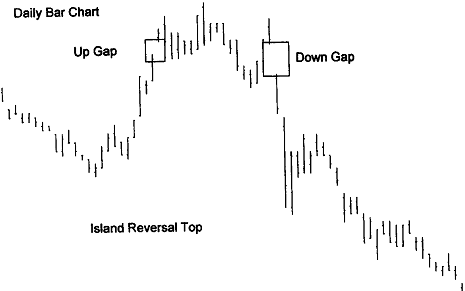
Sometimes, after an upward exhaustion gap, prices trade within a narrow range before gapping to the downside. This leaves the few days of price action looking like an “island” and indicates a trend reversal that needs to be confirmed with the overall trend structure.


Up Next: Chapter 5: Reversal Patterns

Technical Analysis of the Financial Markets: Ch 4

Continuation of the review of the 4th chapter of John J. Murphy’s Technical Analysis of the Financial Markets (prev.)

The Fan Principle

imageSometimes, after an uptrend breaks down, prices will go down a bit before rallying up to the bottom of the old up trendline (now a resistance). A 2nd & 3rd trendine can now be drawn. If the 3rd trendline doesn’t hold, it shows that prices are headed much lower.


Most important up trendlines usually have a slope of about 45*. If the trendline is too steep, then it usually indicates that the prices are rising too rapidly and may not sustain; too flat, then it should not be trusted.image

Sometimes, based on prices movements, trendlines need to be redrawn. Here’s an example of a steep uptrend becoming a flatter one:

Trendlines are drawn and redrawn based on both the market as well as the trader’s time horizon.

image


Here, you have the major trend (1), a bunch of medium-term trends (2, 3, 4) and a short term trend (5).

The important thing to note is that in all of these cases, there is always retracement. These countertrend moves typically happen in either 50%, 1/3rd and 2/3rd moves before it goes back to following the trend. If you are looking for a buying area under the market, you can compute a 33-50% zone under the chart and use it a reference for putting on longs.

Note that if the prior trend has to be maintained, the correction must stop at 2/3rd (66%). If the prices move beyond this point, then the chances of a trend reversal are higher.

Speedlines

Speedlines measure the rate of ascent or descent of a trend (its speed). These lines act as support during market corrections. To construct a speedline for an uptrend:image

  1. Find the highest point in the uptrend
  2. From the highest point, drop a vertical line to the bottom of the chart from where the trend began
  3. Divide the vertical line into thirds and draw a line from the beginning of the trend through these points.

Speedlines need to be redrawn every time a new high (during an uptrend) or a new low (during a downtrend) is set. And these might go right through the price action.

Up Next: Reversals and Price Gaps

Technical Analysis of the Financial Markets: Ch 4

This is a review of the fourth chapter of John J. Murphy’s Technical Analysis of the Financial Markets.

What is a trend?

A trend is simply the direction of the market. Markets don’t move in straight lines, they zigzags through different levels forming peaks and troughs. The direction of these peaks and troughs constitutes a market trend.

imageAn uptrend is a series of successively higher peaks and troughs.

A downtrend is a series of successively lower peaks and troughs.image

A trendless/horizontal trend is a series of horizontal peaks and troughs.

Based on the trend, the trader could go long an uptrend, go short a downtrend and most importantly, do nothing in a trendless market.

Support and Resistance

The troughs are called supports. It is a level under the imagemarket where buying interest is sufficiently strong to overcome selling pressure. It is in this area that the decline is halted and and prices turn back up.

Resistance is the opposite of support; it is a level over the market where selling pressure overcomes buying pressure and prices decline.

In an uptrend, resistance levels represent pauses in price appreciation and are usually penetrated at some point. In a downtrend, support levels check the decline temporarily. For an uptrend to continue, each successive low (support) must be higher than the last one. Each rally high (resistance) should be higher than the previous one. If the corrective dip in an uptrend comes all the way down to the previous low (support), then a trend reversal might be in the offing.

imageThe longer the time (and higher the volume) that prices trade in a support or resistance area, the more significant the area becomes.

Whenever the support or resistance level is penetrated by a significant amount (3%), they reverse their roles and become opposites.


Up Next: Trendlines!


Technical Analysis of the Financial Markets: Ch 3

This is a review of the third chapter of John J. Murphy’s Technical Analysis of the Financial Markets.

Chart Construction

The daily bar chart is the most commonly used chart amongst technical analysts. It’s called a bar chart because each each day’s range is represented as a vertical bar. image

StockViz uses a variation of the bar chart called the candlesticks. These charts can be constructed for any time period. For example, one line can represent an entire week’s action with the High Low Open Close representing the week’s price movements instead of a day’s.

We have covered candlesticks before, it would be worth the effort to have a brief look at it before proceeding to the next chapter.


Up next: Trend Spotting

Technical Analysis of the Financial Markets: Ch 2

This is a review of the second chapter of John J. Murphy’s Technical Analysis of the Financial Markets.

Dow Theory

Most of what we call technical analysis today has its foundations in what Charles Dow proposed around the turn of the 19th century. His primary goal was to predict the course of the economy by looking at the stock market index he had created.

Basic Tenets

The averages discount everything

The sum of the transactions of the stock exchange represent the sum of all Wall Street’s knowledge of the past, present and distant, applied to the discounting of the future. The markets reflect every knowable factor that affects over all supply and demand.

The market has three trends

A trend has three parts:

  • primary (tides)
  • secondary (waves)
  • minor (ripples)

The direction of a tide can be determined by noting the highest point reached by successive waves. When the highpoint of each successive wave recedes, the tide has turned out and is ebbing. Dow opined that market tides last for more than a year and typically run for several years.

The secondary trends last three weeks to three months. These intermediate corrections retrace 1/3rd to 2/3rds of the previous trend movement and most frequently about 1/2 of the previous move.

The minor trends last for less than three weeks and represent fluctuations in the intermediate trend.

Major trends have three phases

Major trends go through distinct phases:

  1. accumulation: when informed buyers accumulate the stock
  2. public participation: when technical trend followers start buying
  3. distribution: when newspapers start printing the bullish case and informed buyers begin to “distribute”

This is similar to the Elliot Wave Principle we discussed earlier.

The averages must confirm each other

Dow would look for confirmation of a bull or bear signal from both the Industrial and Rail Averages.

Volume must confirm the trend

Volume should expand or increase in the direction of the major trend.

In a major uptrend, volumes increase as prices move higher and decrease as prices fall. In a downtrend, volumes increase as prices fall and decrease as prices rise.

A trend is assumed to be in effect until it gives definite signals that it has reversed

Newton’s law of motions: inertial drives trends.

Conclusion

Dow relied exclusively on closing prices. He believed that averages had to close higher than the previous peak or lower than the previous trough to have significance.

From 1920 to 1975, Dow Theory signals captured 68% of the moves in the Industrial and Transportation Averages and 67% of those in the S&P 500 index. An understanding of the Dow Theory provides a solid foundation for further studies in technical analysis.