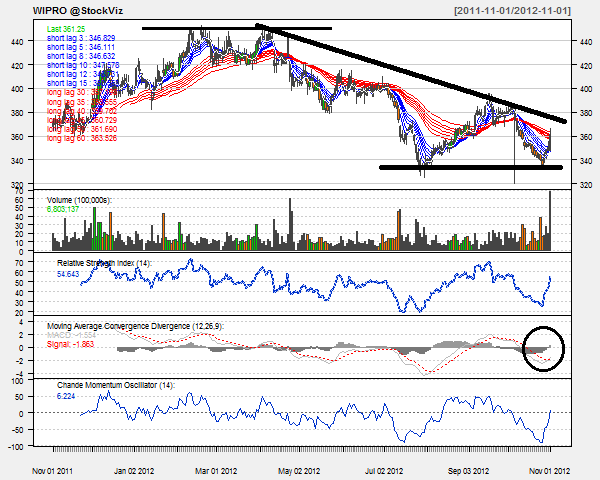
Today’s pick is WIPRO [stockquote]WIPRO[/stockquote]. The stock began 2012 with a slight upside move to see resistance around the Rs. 450 levels. After testing that resistance for 2 months, the stock started moving downwards till it reached Rs. 340. This acted as support for the stock in the later months as well. And post November, the stock has been on an up-trend. In the last three months, the stock has moved +10% vs. +5% of the Nifty’s.

Oscillators RSI and CMO are closing towards the over-bought territory.
The MACD line is moving above the signal line in a bullish mode confirmed by the increasing histogram levels. The long-term GMMA lines are moving very close to each other unable to suggest any bias for the long-term. Although, the short-term GMMA lines are suggesting a bullish move given the expansion of the lines.

WIPRO’s average correlation with the Nifty is 0.56, which is positive and strong. The scrip will be replicating the movement of Nifty. [stockquote]NIFTYBEES[/stockquote]

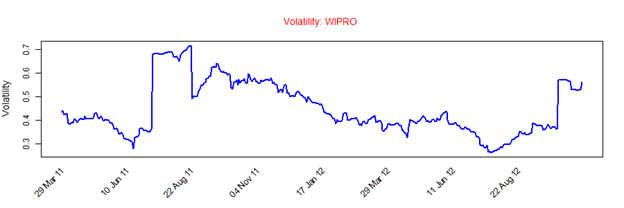
WIPRO has a historical volatility in the range of 0.3 to 0.8. The scrip’s volatility currently is in the lower end of the range.

Analysts are kind of bullish for the stock, given the high average ratings from various analysts. Better earnings this quarter could add on to the glory of the stock.
Given these technicals, we suggest a short-term hold and a long-term BUY for the scrip. We suggest traders to use trailing stop-losses in order to book profits if a trend-reversal were to take place.