Tag: quant

IPOs: An Update

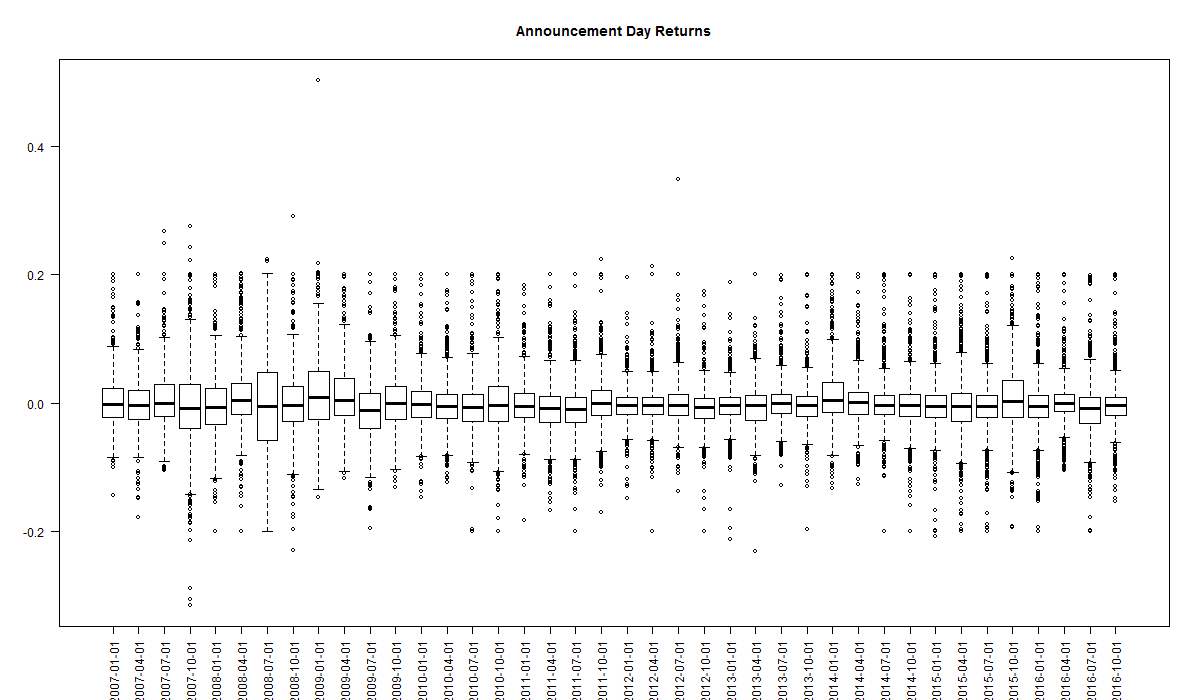
Retail news outlets are once again gaga over phenomenal listing day returns of IPOs. Investors will do well to take a step back and take in the scene:

  • Median listing day returns since 2010 has been 1.22%
  • The best year (since 2010) was 2014 with median returns of 1.435%; the worst being 2012 with -2.76%
  • Picking winners over a large sample size (the listed universe) is easier than picking from a smaller lot of IPOs
    • The code and data is on github.

Residual Momentum

The conventional way of implementing momentum strategies rank either relative or absolute time series returns of a universe of stocks. If either market beta, value or the small-cap premium had a big hand in driving equity returns during the formation period, then the momentum portfolio will be overweight those factors. This leads to steep momentum crashes, or so the theory goes.

In their paper on Residual Momentum, Blitz, Huij and Martens propose ranking stocks based on the residuals obtained after fitting their return series to the Fama-French Three factor model. They argue that a portfolio created this way outperforms vanilla momentum strategies.

We have created an automated residual momentum strategy, Momo (Residual) v1.0, that implements the residual momentum strategy outlined in the paper.

Intraday Momentum

The Research

In their paper, Intraday Momentum: The First Half-Hour Return Predicts the Last Half-Hour Return (pdf,) the authors assert that the first half-hour return on the market predicts the last half-hour return on the market.

Our take

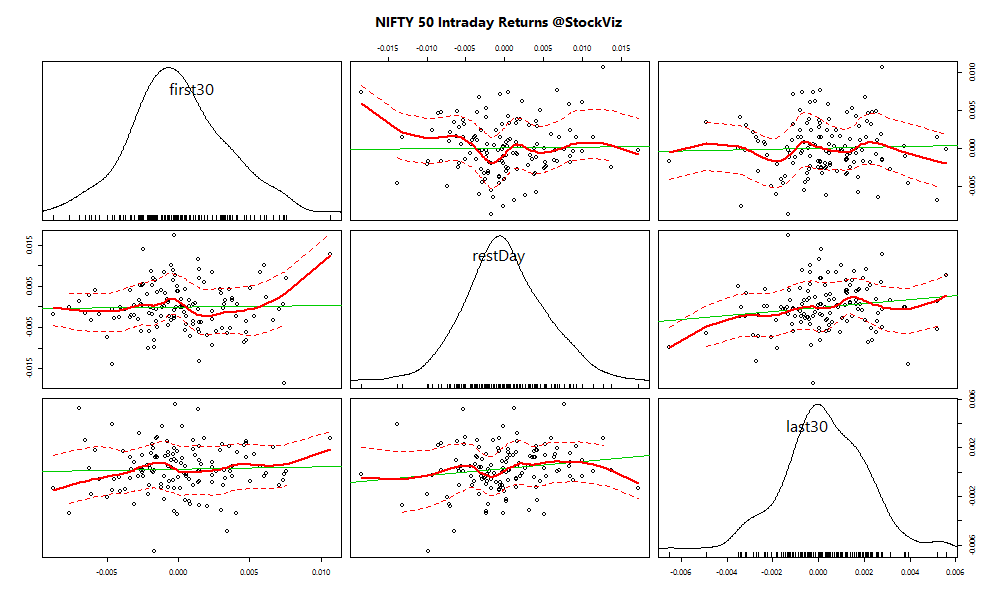
It seems to apply only to the selection of ETFs contained in their research. We ran a sniff-test on our very own NIFTY 50 index. If there was any correlation between the first half-hour and the last half-hour, it should have shown up in the top-right plot:

nifty50-intraday

We admit that our sample size is small. We will continue to accumulate data and run this script a year from now to see if any relationship emerges from the data. Stay tuned!

Investing in Micro-caps

The Size Factor

All things being equal, micro-caps outperform mega-caps in the long-run — investors are compensated for the higher systematic (business cycle) risk that they take when they invest in micro-cap stocks. One way to boost relative performance vs. a market-cap weighted index is to invest in an equal-weighted basket of stocks that are in the index. Alternately, investors can add a basket of micro-cap stocks to their portfolio to juice overall returns.

Market-cap Deciles

We had discussed how we can divide the universe of listed stocks in deciles based on their free-float market cap here. Given our ability to automate systematic investment strategies, we created an auto-rebalanced Theme each for every decile.

Investors can now gain exposure to an equal-weight portfolio of micro caps by investing in the Decile 9 Theme and mega-caps by investing in the Decile 0 Theme. Returns and risk go down as you climb up the market-cap ladder. Our Market Dashboard gives an idea of how returns have been distributed across the deciles:
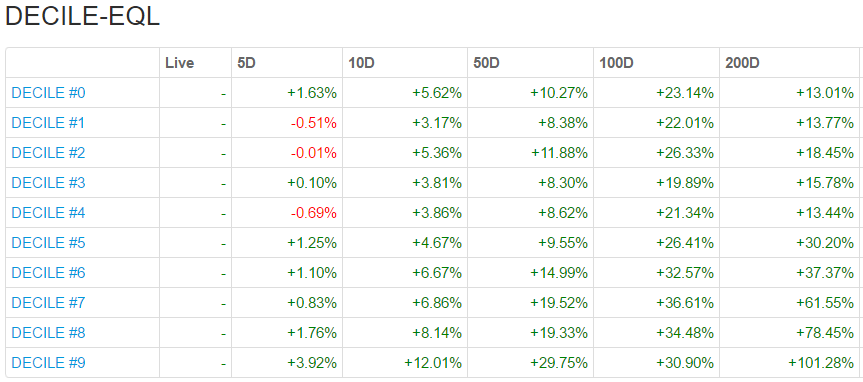
decile returns

Notice how the drawdowns are deeper with micro-caps:
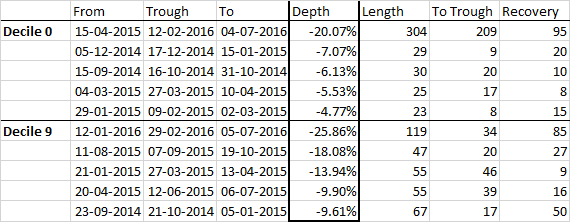
decile drawdown

Investors who whethered the steeper drawdowns of micro-caps have experienced returns an order of magnitude larger than mega-cap investors. Check out the ‘Size Factor’ in our Investment Themes page for other Market-cap based Themes.