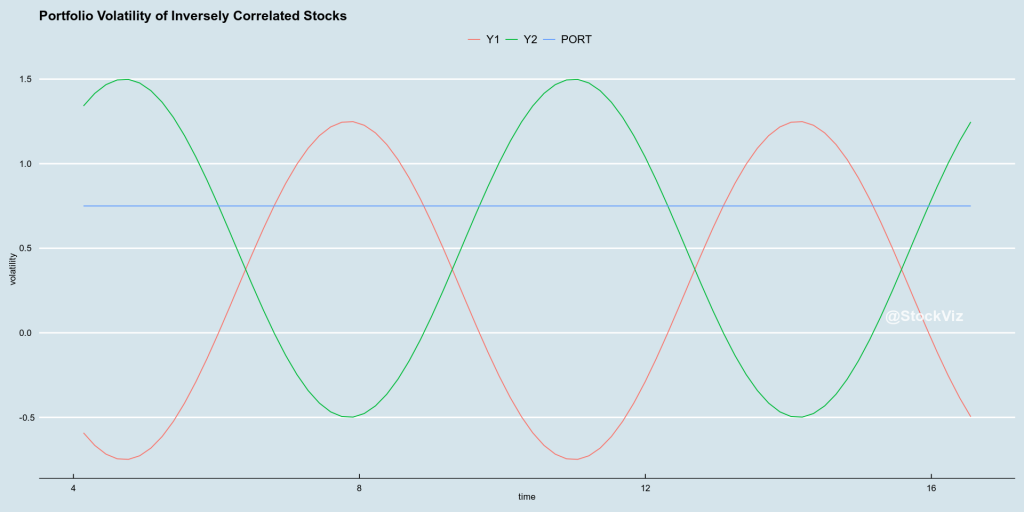
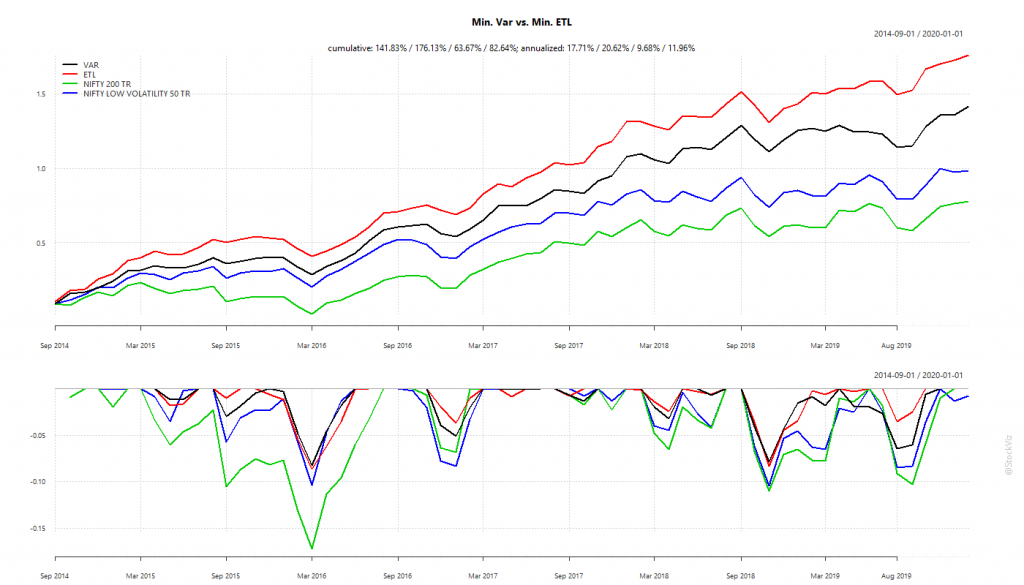
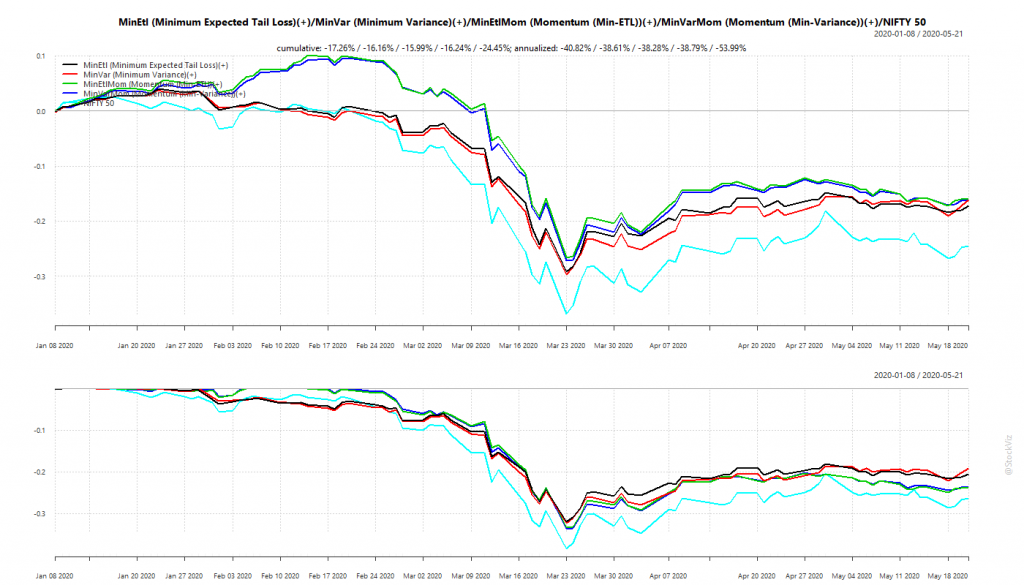
We had discussed portfolios optimized for minimum volatility back in January (see: Low Volatility: Stock vs. Portfolio) and had setup Themes that track such strategies. Broadly, these fall into ETL (Expected Tail Loss) and Min-Var (Minimum Variance) optimized portfolios that either take in the entire universe of stocks or only those that have a high momentum score. So, we have Minimum Expected Tail Loss, Minimum Variance, Momentum (Min-ETL) and Momentum (Min-Variance).
We expect optimized portfolios of momentum stocks to perform better during market up-trends. During bears, we expect them to have lower drawdowns than the market. The Corona Virus Panic put these portfolios in through the wringer. Glad to report that they came out largely unscathed.
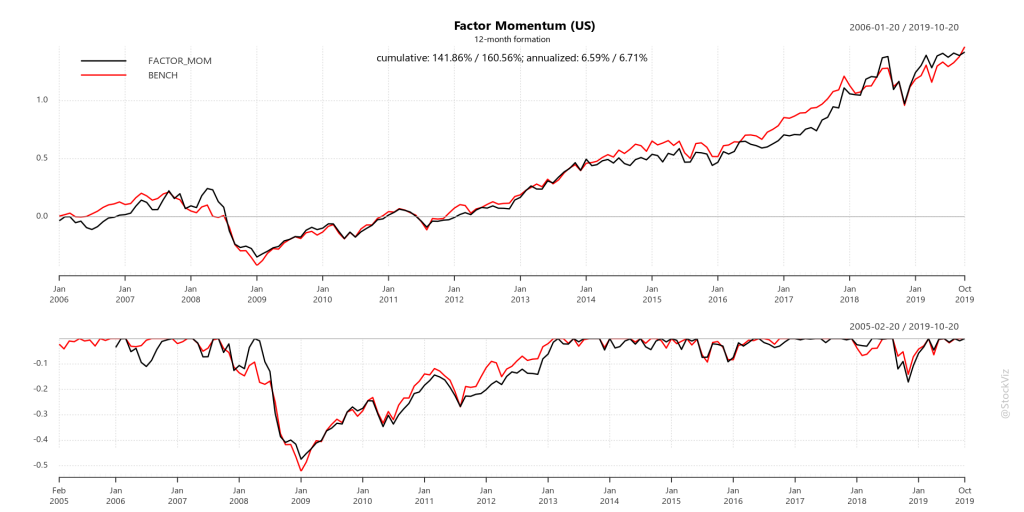
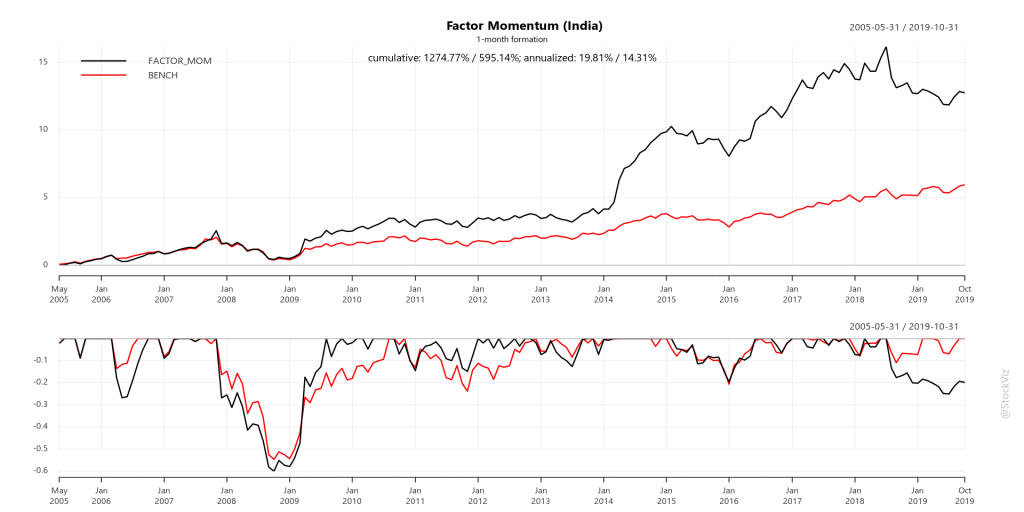
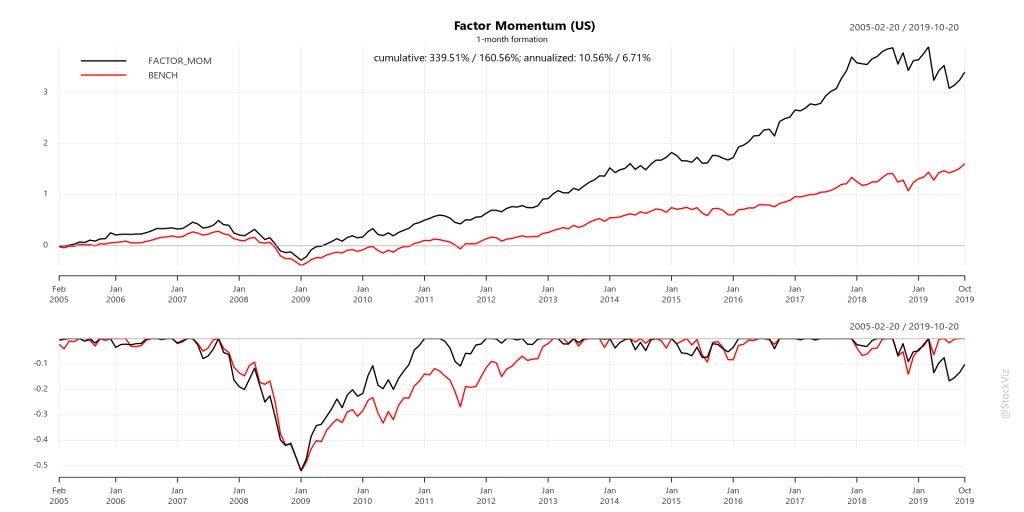
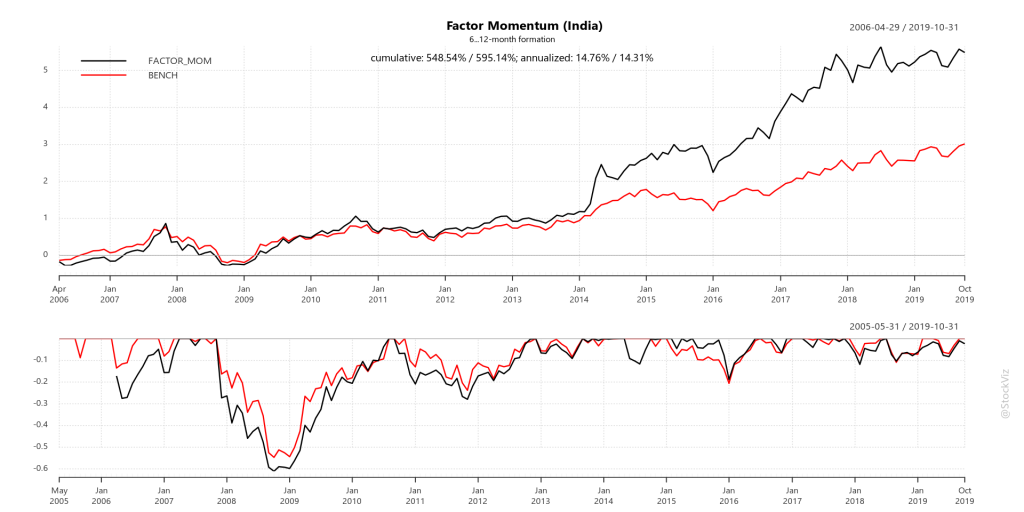
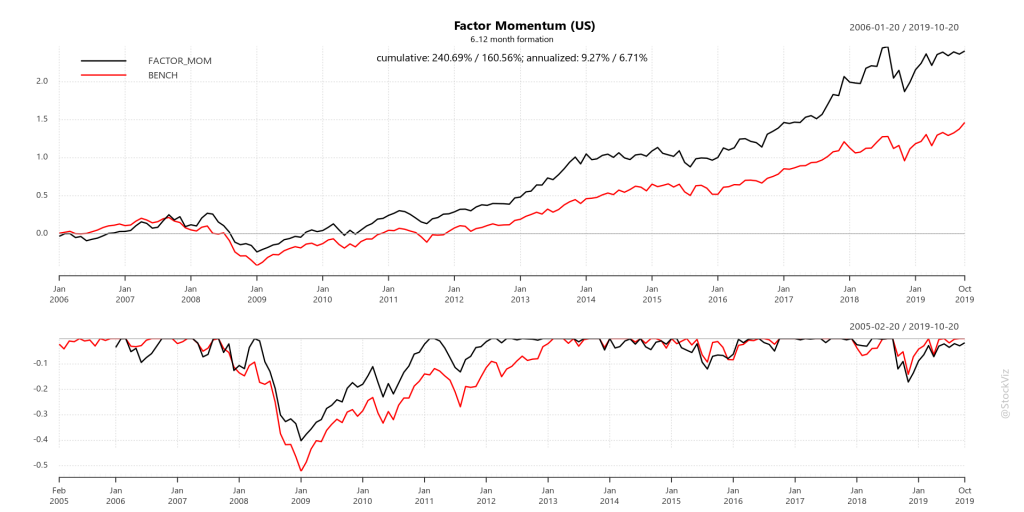
Our back-tests showed that optimized momentum portfolio would under-perform “raw” momentum during up-trends but should have lower drawdowns during down-trends.
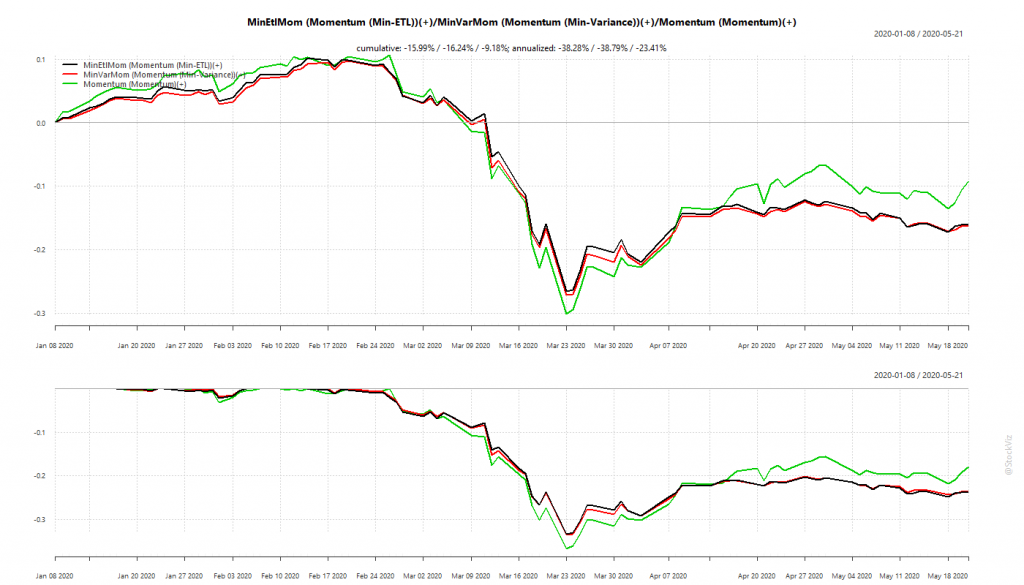
Optimized momentum portfolios saved the investor about 3-4% in drawdowns compared to the “raw” momentum portfolio. May not sound like much in this instance but think about the cumulative effect over multiple market corrections when you invest for the long-term.
Overall, optimized portfolios delivered what they promised.
WhatsApp us at +91-80-26650232 if you are interested in knowing more about these strategies.