Category: Your Money

Investing in Non-Rupee Assets

Introduction

Indian investors have a significant home bias – we tend to hold a high proportion of our portfolio, sometimes 100%, in Indian assets. However, if you look at how the rupee has behaved vis-a-vis the US Dollar, the advantage of international diversification becomes obvious.

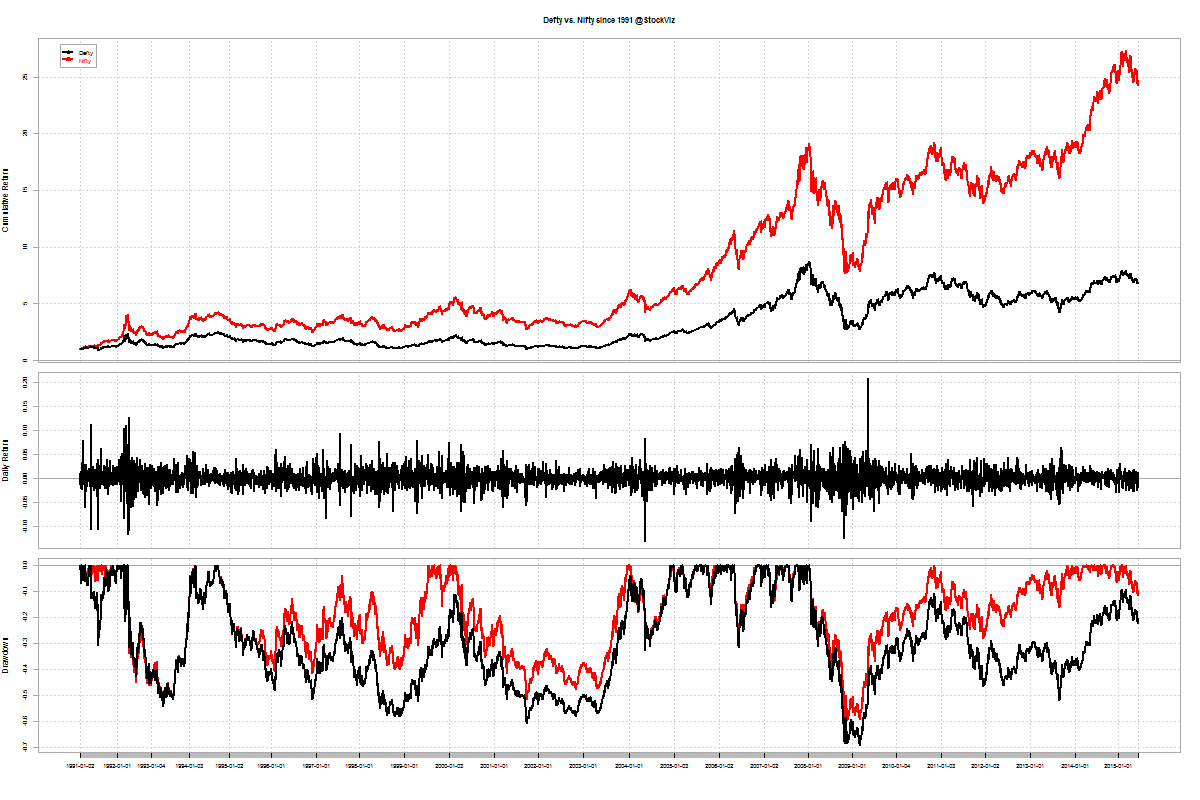
USDINR has been a one-way trade

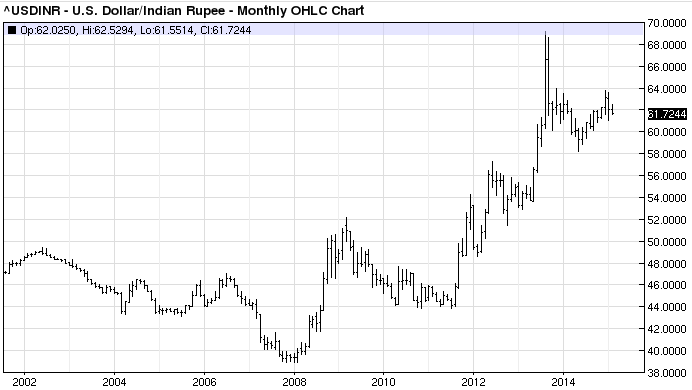
Historically, the rupee has only depreciated against the dollar. It is the price we pay for being a socialist democracy with poor fiscal responsibility and an unaccountable central bank.

Depreciation quantified

Nifty investors have seen an IRR of 821% since 1991 and today. However, in dollar terms, the IRR is 286%. The difference of 535% is because of rupee depreciation – even if you had held on to a non-productive dollar asset, you would have made that much in rupee terms.

nifty.vs.defty.1991

Diversification benefit

By being long only Indian assets, your fate is tied to the vagaries of the local market participants, regulators and politicians. In a country where most people have dual-SIM phones, it is surprising that most investors are willing to hitch their ride to that pony.

One of the oldest international funds is from Birla Sun Life, let us see how that fared since the financial crisis:

Between 2008-01-01 and 2015-06-15, Birla Sun Life International Equity Fund Plan A- Growth has returned a cumulative 69.99% with an IRR of 7.37% vs. CNX Midcap’s cumulative return of 32.36% and an IRR of 3.83%. It has a beta of only 0.12825 vs. the Midcap index. (MorningStar)

Caveats

The biggest problem with investing in international funds is manager competence. All the reasons we highlighted in our post, Funds that (also) invest in foreign markets, apply. At the end of the day, you are still investing in equities and equity markets are (loosely) correlated. However, investors are better off choosing a pure international equity fund rather than one where the “international” part is a hobby.

The second problem is that there are some funds that invest in emerging Asia or frontier markets. These funds are not really long the dollar. Investors should pay attention to this detail.

Conclusion

Investing in international funds makes sense from a depreciation and diversification point of view. In our Aggressive Fund portfolio, we assign 30% of investor allocation to international funds.

Weekly Recap: Profit Destroying Innovation

world.2015-06-05.2015-06-12

Equities

Major
DAX(DEU) -0.01%
CAC(FRA) -0.40%
UKX(GBR) -0.29%
NKY(JPN) -0.26%
SPX(USA) -0.09%
MINTs
JCI(IDN) -3.23%
INMEX(MEX) +0.25%
NGSEINDX(NGA) -0.13%
XU030(TUR) -1.88%
BRICS
IBOV(BRA) +0.44%
SHCOMP(CHN) +2.85%
NIFTY(IND) -1.62%
INDEXCF(RUS) +0.01%
TOP40(ZAF) +0.30%

Commodities

Energy
Natural Gas +6.59%
Ethanol -4.26%
Brent Crude Oil +1.08%
Heating Oil +0.94%
WTI Crude Oil +1.64%
RBOB Gasoline +4.58%
Metals
Copper -0.74%
Gold 100oz +1.02%
Palladium -1.90%
Platinum +0.16%
Silver 5000oz -0.63%

Currencies

USDEUR:-1.33% USDJPY:-1.77%

MINTs
USDIDR(IDN) +0.34%
USDMXN(MEX) -2.04%
USDNGN(NGA) +0.22%
USDTRY(TUR) +1.75%
BRICS
USDBRL(BRA) -1.09%
USDCNY(CHN) +0.09%
USDINR(IND) +0.48%
USDRUB(RUS) -2.13%
USDZAR(ZAF) -1.56%
Agricultural
Cattle -0.28%
Cocoa +0.05%
White Sugar -0.97%
Cotton +0.61%
Lumber +1.45%
Orange Juice +5.35%
Corn -2.15%
Feeder Cattle +0.90%
Coffee (Arabica) -2.01%
Coffee (Robusta) +0.17%
Lean Hogs -0.61%
Soybean Meal +4.00%
Soybeans +0.13%
Sugar #11 -2.98%
Wheat -2.65%

Credit Indices

Index Change
Markit CDX EM -0.48%
Markit CDX NA HY -0.19%
Markit CDX NA IG +0.14%
Markit iTraxx Asia ex-Japan IG +1.99%
Markit iTraxx Australia +1.42%
Markit iTraxx Europe +1.14%
Markit iTraxx Europe Crossover +0.36%
Markit iTraxx Japan +2.32%
Markit iTraxx SovX Western Europe +0.28%
Markit LCDX (Loan CDS) -0.02%
Markit MCDX (Municipal CDS) -0.16%
A huge wave of volatility consumed pretty much all asset classes this week. Bonds – down, equities – down, rupee – down; euro – up. Are we done yet?

Nifty Heatmap

CNX NIFTY.2015-06-05.2015-06-12

Index Returns

For a deeper dive into indices, check out our weekly Index Update.
indexperformance.2015-06-05.2015-06-12

Sector Performance

sectorperformance.2015-06-05.2015-06-12

Advance Decline

advance.decline.line2.2015-06-05.2015-06-12

Market Cap Decile Performance

Decile Mkt. Cap. Adv/Decl
1 (micro) -8.21% 59/68
2 -2.71% 58/70
3 -2.35% 58/70
4 -3.39% 61/67
5 -2.31% 58/70
6 -2.26% 61/67
7 -2.15% 57/71
8 -3.77% 58/70
9 -2.61% 58/70
10 (mega) -1.82% 60/68
A total bloodbath across market caps…

Top Winners and Losers

GLENMARK +4.08%
ICICIBANK +4.17%
OFSS +4.18%
BANKBARODA -8.30%
PNB -8.21%
BOSCHLTD -7.71%
Bosch was once a boring old manufacturing company but they had to go and include it in the Nifty and ruin it for everyone…

ETF Performance

INFRABEES +0.43%
BANKBEES +0.21%
GOLDBEES +0.01%
JUNIORBEES -1.45%
CPSEETF -1.58%
NIFTYBEES -1.58%
PSUBNKBEES -2.63%
PSU banks back to being kicked around…

Yield Curve

yield Curve.2015-06-05.2015-06-12

Bond Indices

Sub Index Change in YTM Total Return(%)
GSEC TB -0.63 +0.33%
GSEC SUB 1-3 -0.29 +0.84%
GSEC SUB 3-8 -0.07 +0.17%
GSEC SUB 8 +0.29 -2.69%
Are long bonds reflecting global liquidity jitters or are they signalling higher inflation?

Investment Theme Performance

Equity Mutual Funds

Bond Mutual Funds

Thought for the weekend

We may have entered a great period of profit destroying innovation where the benefits accrue more and more to the customers and not the providers.

For instance, for almost every SaaS company that charges for features there are now new companies being built that give the features away with the goal of charging for some activity in the network that they are looking to build.

Source: Valuations, Profit Destroying Innovation and Winner’s Curse

Index Update 13.06.2015

MOMENTUM

We run our proprietary momentum scoring algorithm on indices just like we do on stocks. You can use the momentum scores of sub-indices to get a sense for which sectors have the wind on their backs and those that are facing headwinds.

Traders can pick their longs in sectors with high short-term momentum and their shorts in sectors with low momentum. Investors can use the longer lookback scores to position themselves using our re-factored index Themes.

You can see how the momentum algorithm has performed on individual stocks here.

Here are the best and the worst sub-indices:

index momentum best 365 2015-06-12 png

index momentum best 50 2015-06-12 png

index momentum worst 365 2015-06-12 png

index momentum worst 50 2015-06-12 png

Relative Strength Spread

CNX_500 relative-spread-index 50 2015-06-12 png

Refactored Index Performance

50-day performance, from March 31, 2015 through June 12, 2015:

Trend Model Summary

Index Signal % From Peak Day of Peak
CNX AUTO LONG
13.13
2015-Jan-27
CNX BANK LONG
14.75
2015-Jan-27
CNX ENERGY SHORT
30.29
2008-Jan-14
CNX FMCG LONG
15.47
2015-Feb-25
CNX INFRA SHORT
49.72
2008-Jan-09
CNX IT LONG
88.43
2000-Feb-21
CNX MEDIA SHORT
29.56
2008-Jan-04
CNX METAL LONG
59.10
2008-Jan-04
CNX MNC LONG
8.01
2015-Mar-12
CNX NIFTY LONG
11.26
2015-Mar-03
CNX PHARMA LONG
18.09
2015-Apr-08
CNX PSE SHORT
26.34
2008-Jan-04
CNX REALTY LONG
90.71
2008-Jan-14
Given the state of the relative strength spread, good luck with trend following strategies! But it looks like there are some sectors where a positive trend is reasserting itself. Are we seeing green shoots in pharma, media and banks?

Correlation Update 13.06.2015

Nifty one year daily return correlations

Nifty one year daily return correlations

Nifty one month daily return correlations

Nifty one month daily return correlations

Bank Nifty one year daily return correlations

Bank Nifty one year daily return correlations

Bank Nifty one month daily return correlations

Bank Nifty one month daily return correlations

Midcap one year daily return correlations

Midcap one year daily return correlations

Midcap one month daily return correlations

Midcap one month daily return correlations

A lot of thick blue squares mean that positive correlations are high. Red squares mean negative correlations are high. Whites are the doldrums.

Mutual Fund Performance in Bear Markets

Introduction

During our discussion on Relative Strength Spread, we saw how the relative performance between winners and losers were compressed in the bear markets of 2011, 2012 and 2013. During these doldrums, most active investment strategies fail to outperform their benchmarks. Since most mutual fund investments span multiple bull and bear markets, it makes sense to have a look at how funds performed in the most recent bear market.

For our analysis, we took funds that had more than 90% allocated in equities and ignored sector and international funds. We then applied the same benchmark, the CNX Midcap Index, to make sure that we had an apples-to-apples comparison. A total of 200 funds were analyzed.

The 10 worst funds

Information Ratio

Sharpe Ratio

Beta

Bear Beta

Draw down depth

Draw down length

The 10 best funds

Information Ratio

Sharpe Ratio

Beta

Bear Beta

Draw down depth

Draw down length

Conclusion

The Birla MNC fund stands out as one having the most points in its favour: low and shallow drawdown, better sharpe and higher returns. The next stand outs were the Axis Long-term equity fund and the Mirae Asset Emerging Bluechip Fund.

In terms of the worst funds, HSBC Progressive Themes was definitely regressive to your wealth. JM Basic and Sundram SMILE funds also laid a deuce.

Mutual funds are marketed as wealth builders. However, the truth is that most of them struggle. At last count, there were more than 5300 different schemes that you could choose from.

Are you getting the right advise? Get in touch with us if you are looking to invest! Call us or Whatsapp us at +918026650232