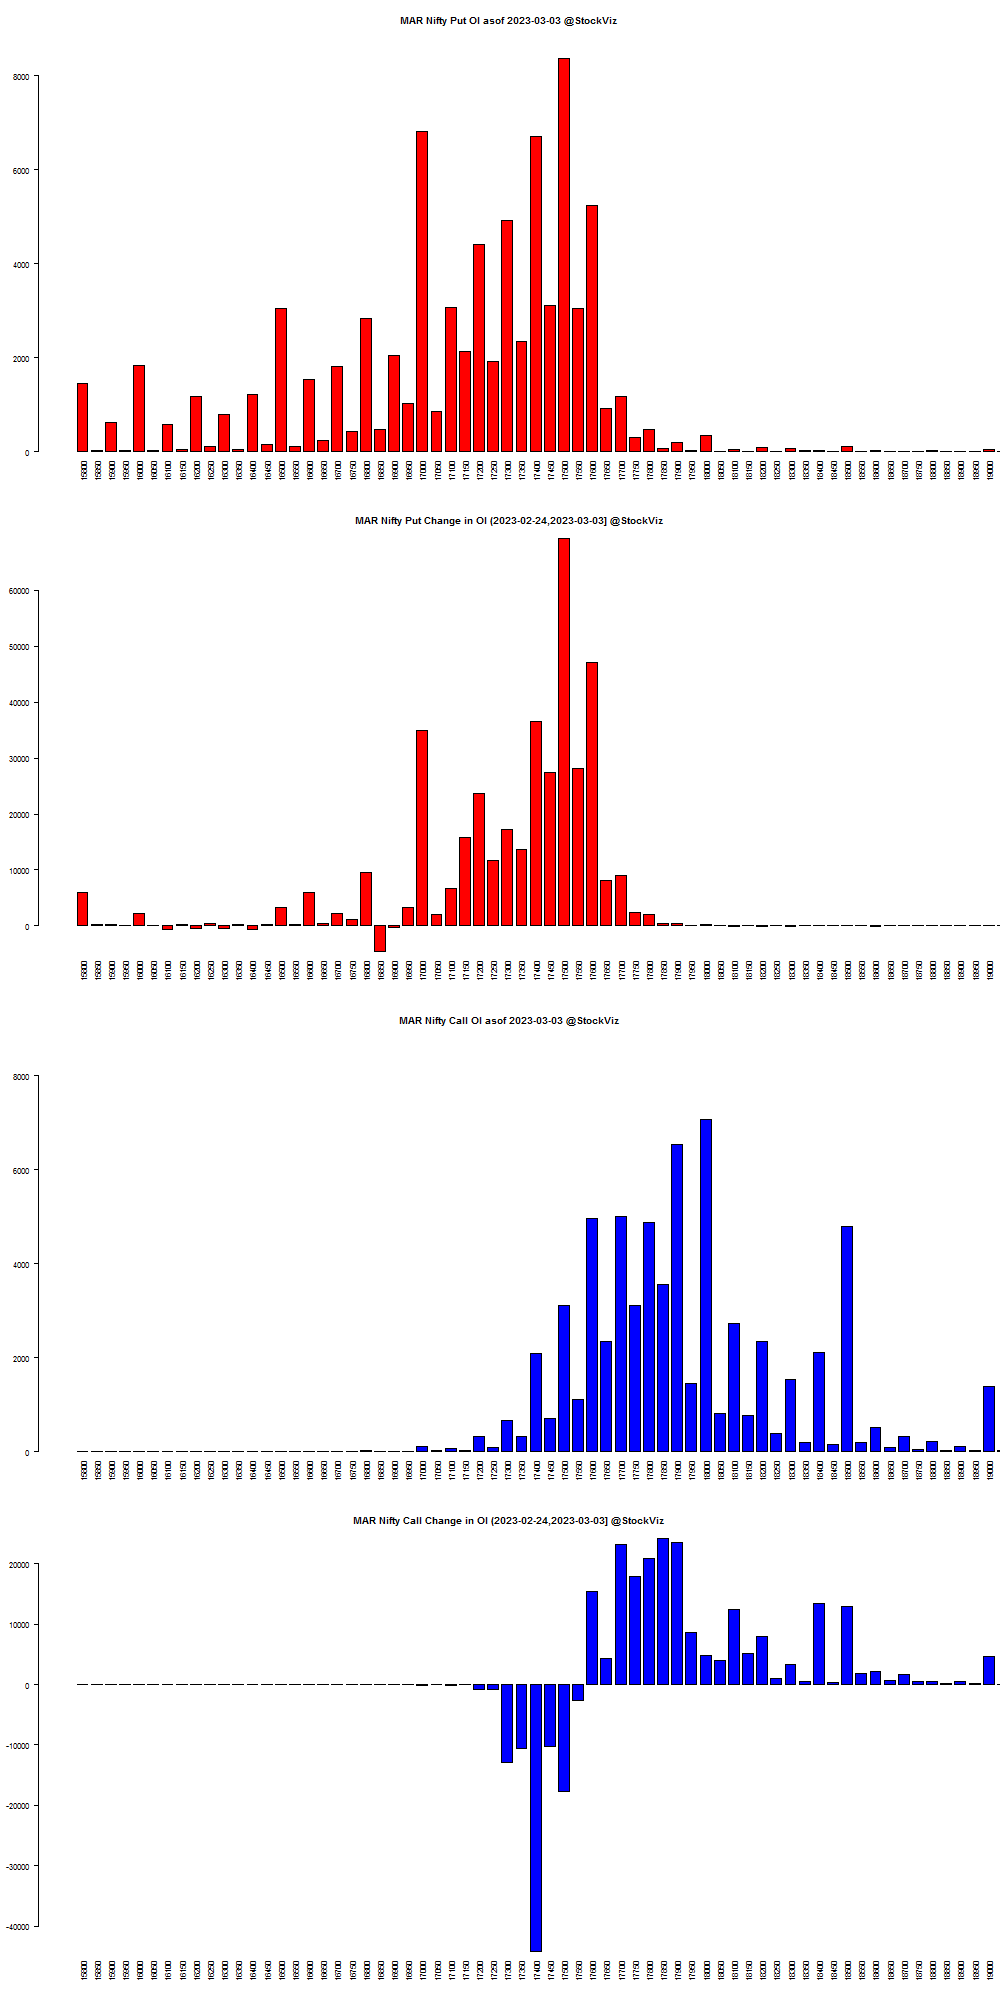
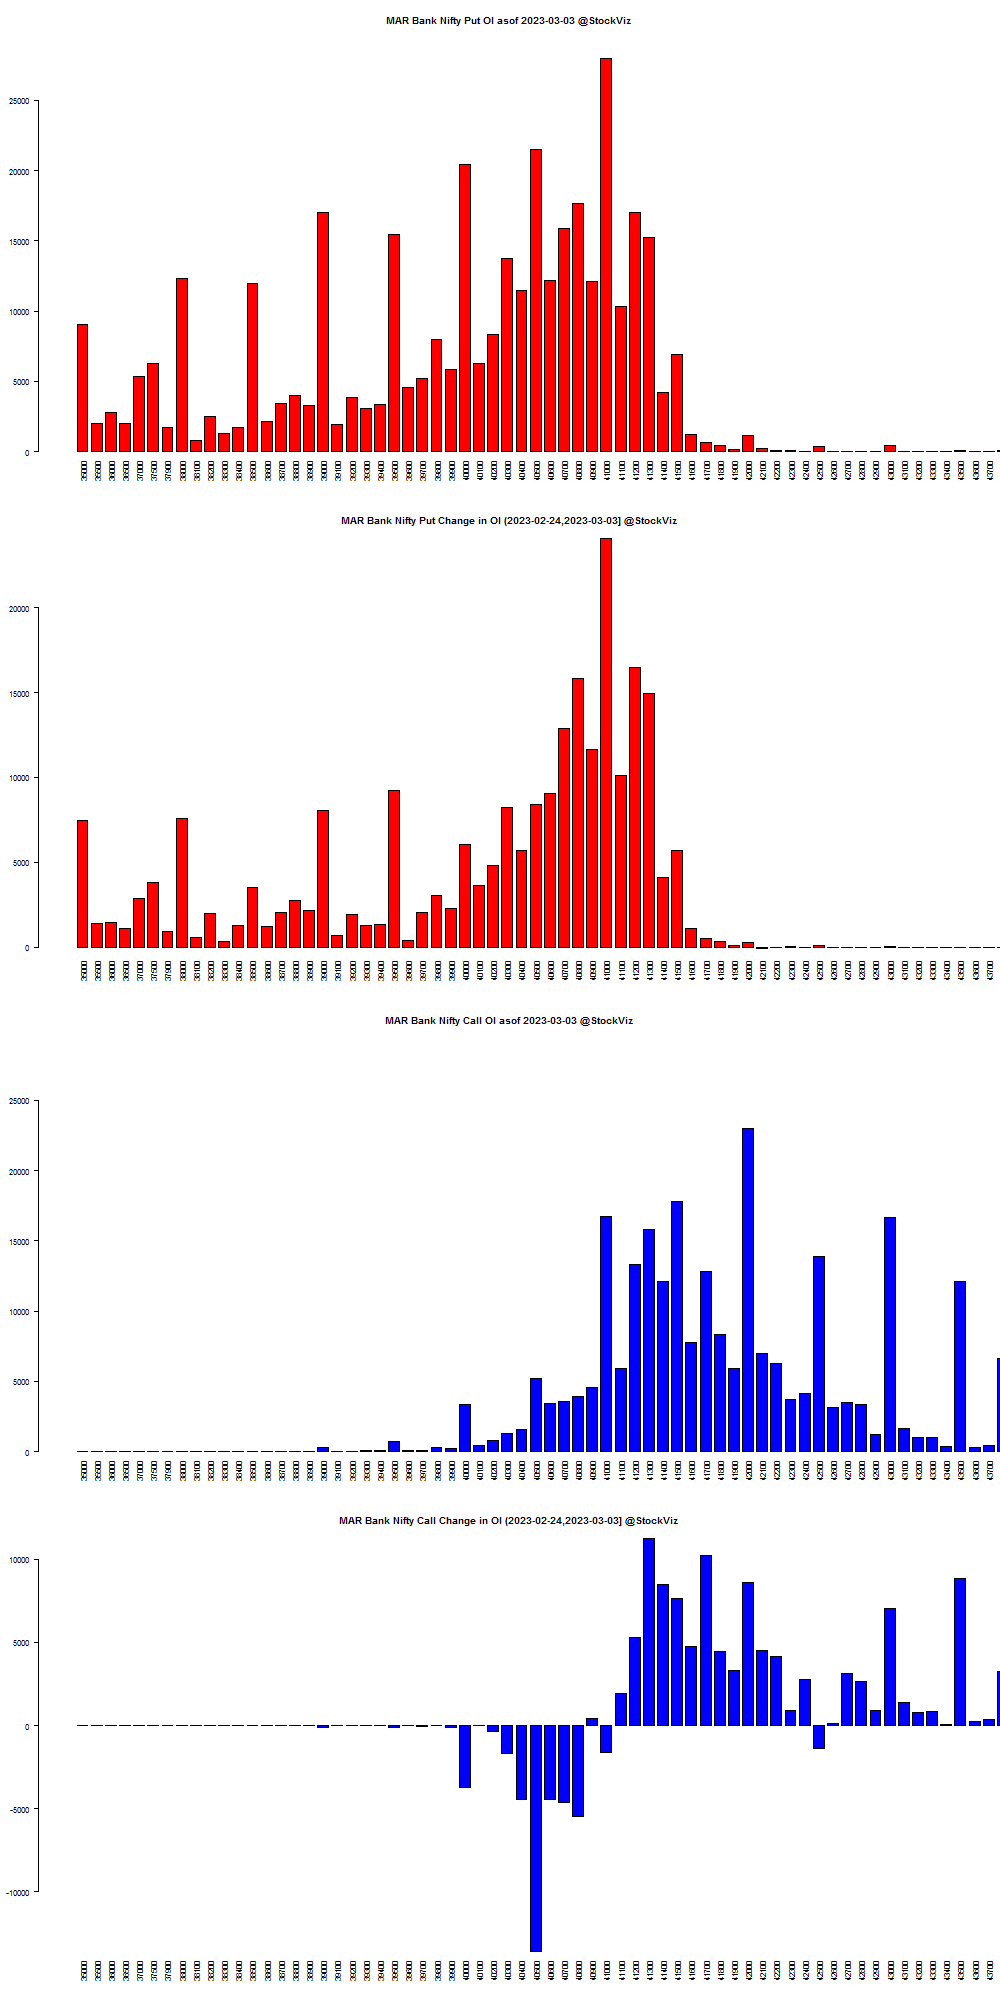
Summary: Mar NIFTY 18000 calls added 65,14,850 contracts while 17400 calls shed 44,21,500. On the Put side of the equation, the 17500 strike added 80,10,000 while the 16850’s shed 4,60,800.
MAR NIFTY OI
MAR BANKNIFTY OI
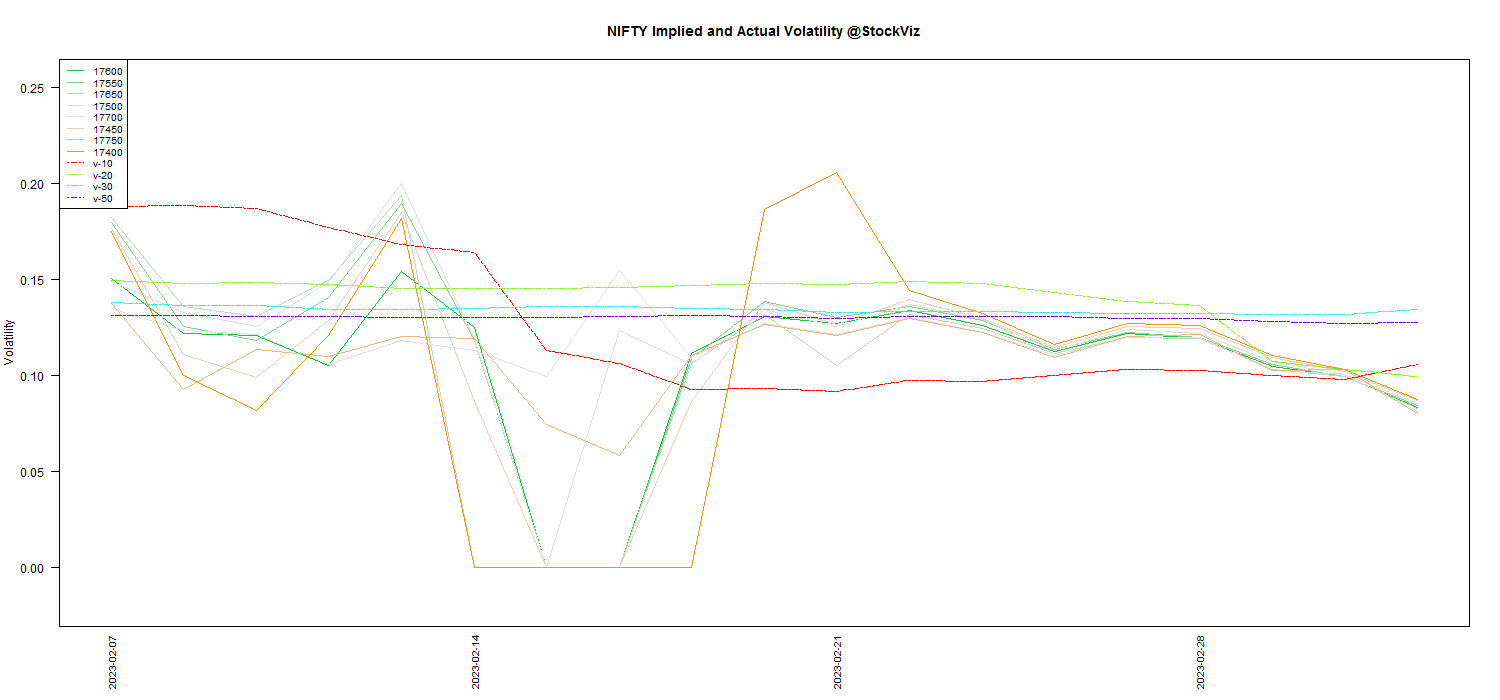
MAR NIFTY Volatility
MAR BANKNIFTY Volatility
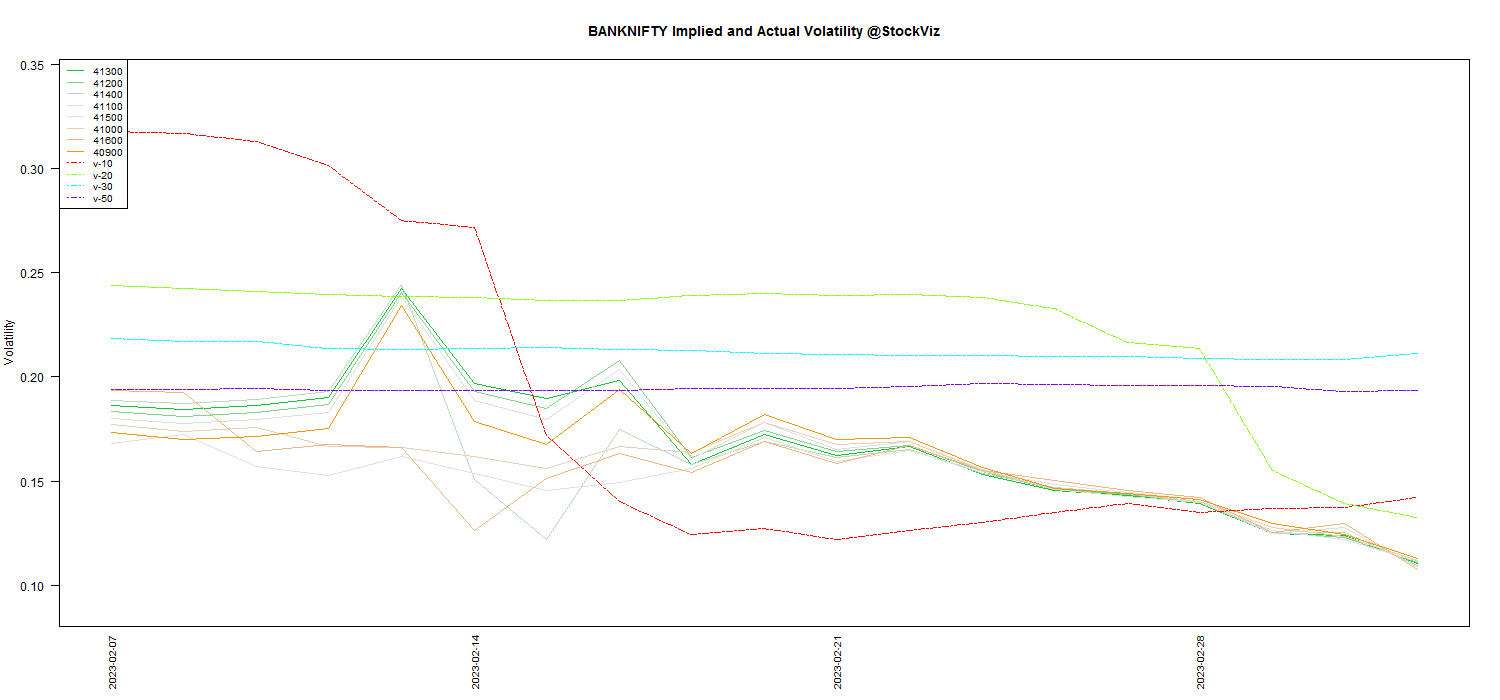
Dotted lines indicated actual underlying volatility. Solid lines are IVs.
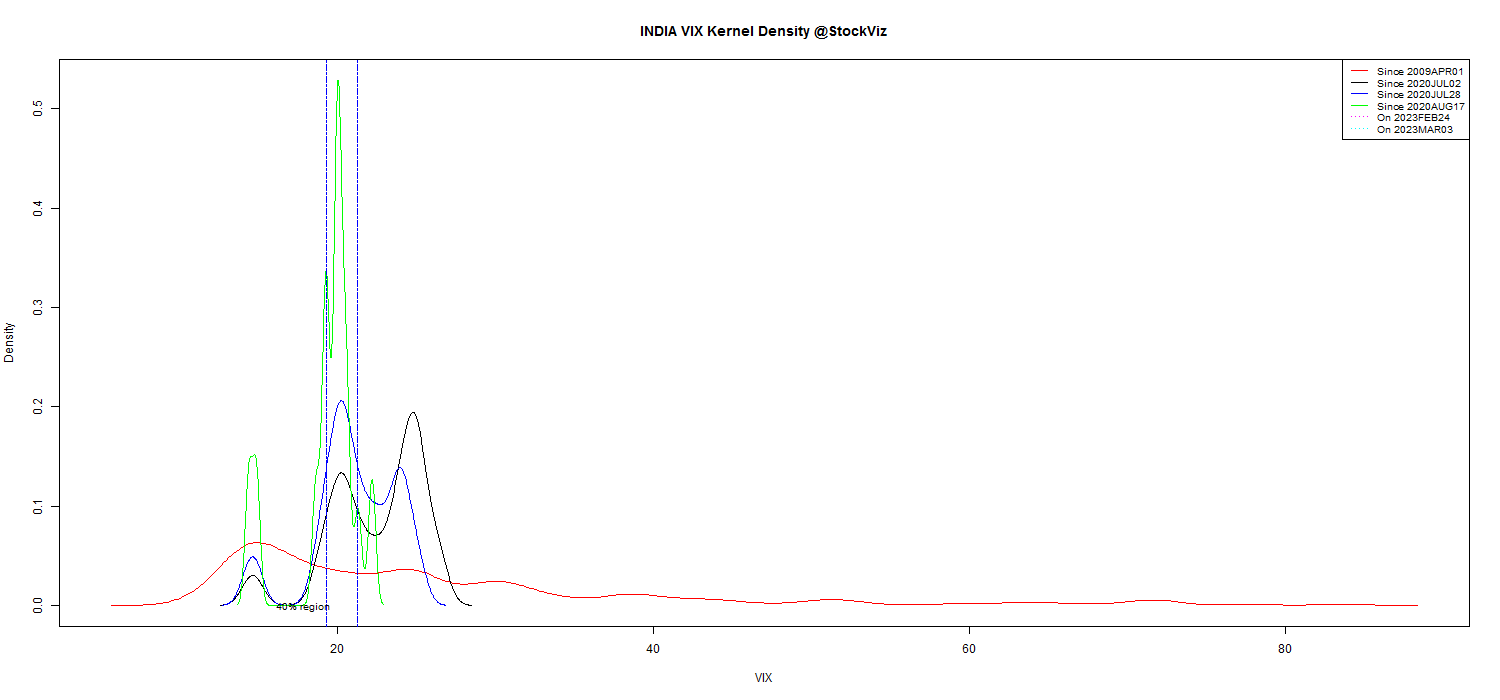
VIX Density Plot
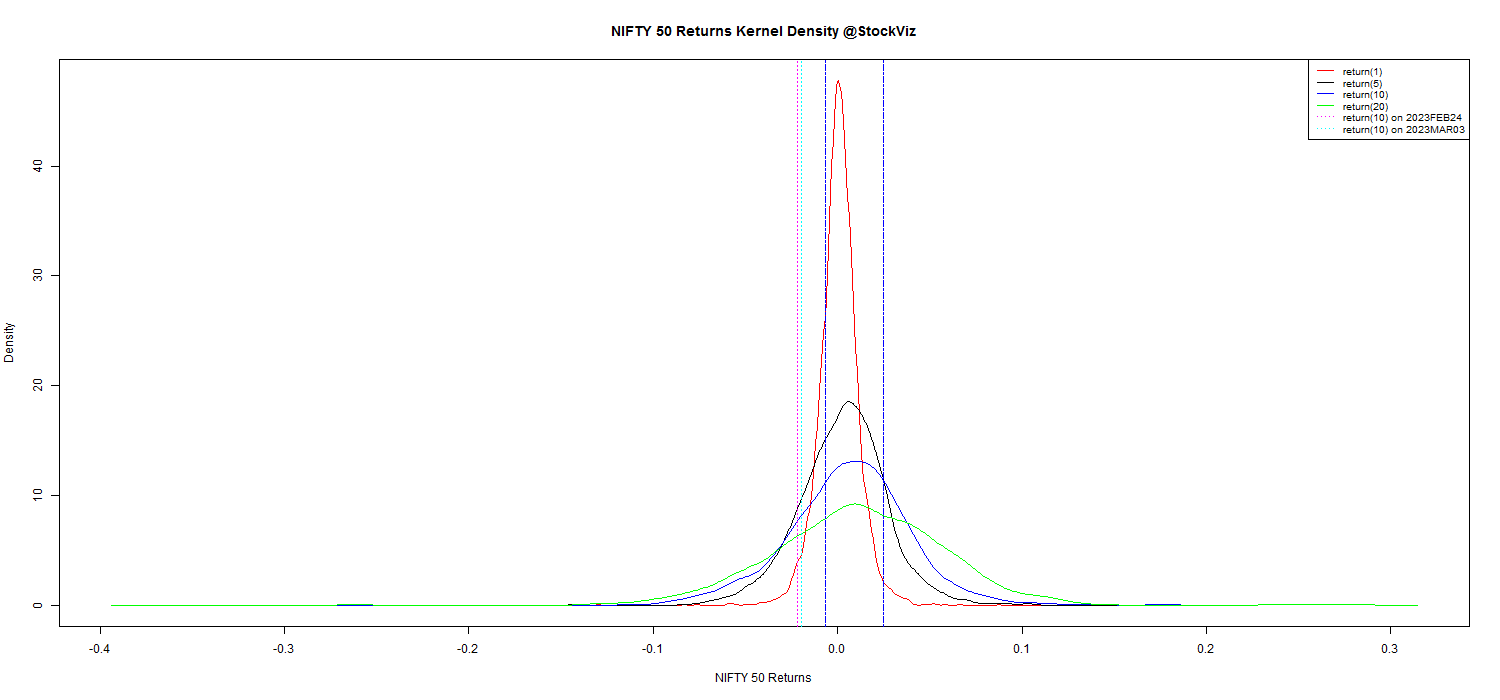
Nifty 50 Returns Density Plot