Category: Your Money

Stop-loss and Re-entry

Introduction

A trailing stop is a percentage below the most recent high at which you exit a trade. It allows you to lock-in gains while avoiding catastrophic loss. There are lot of opinions about where these should be set. And more importantly, when to re-enter. What follows is a discussion on how different stops and re-entry rules affect trading frequency and returns.

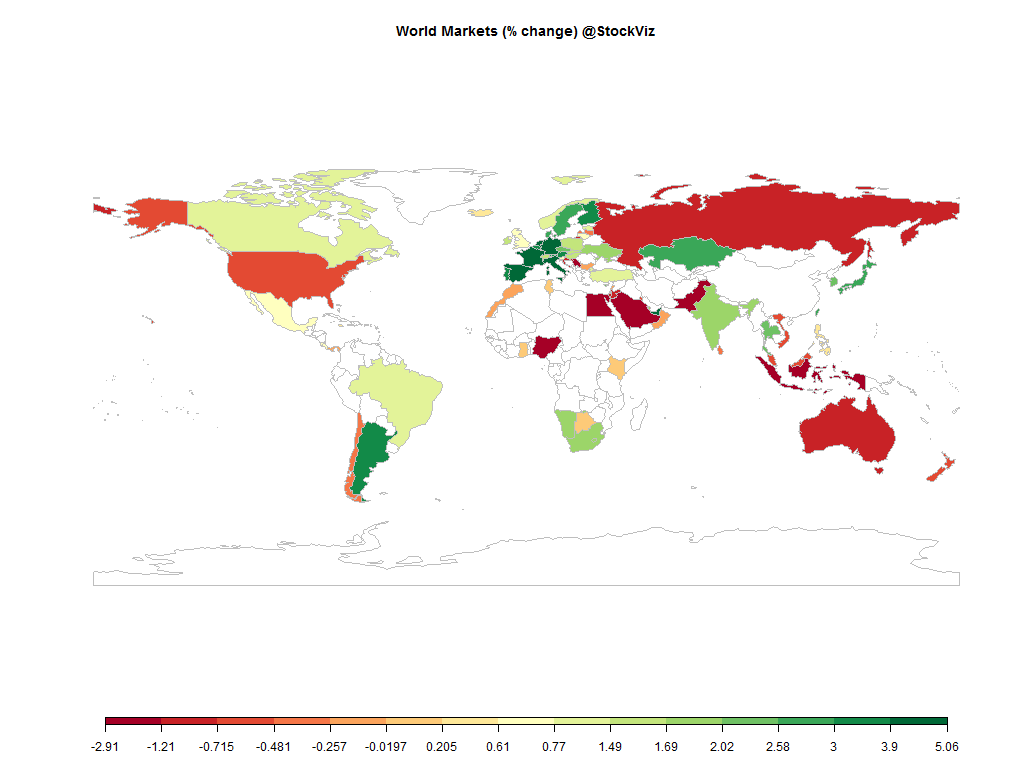
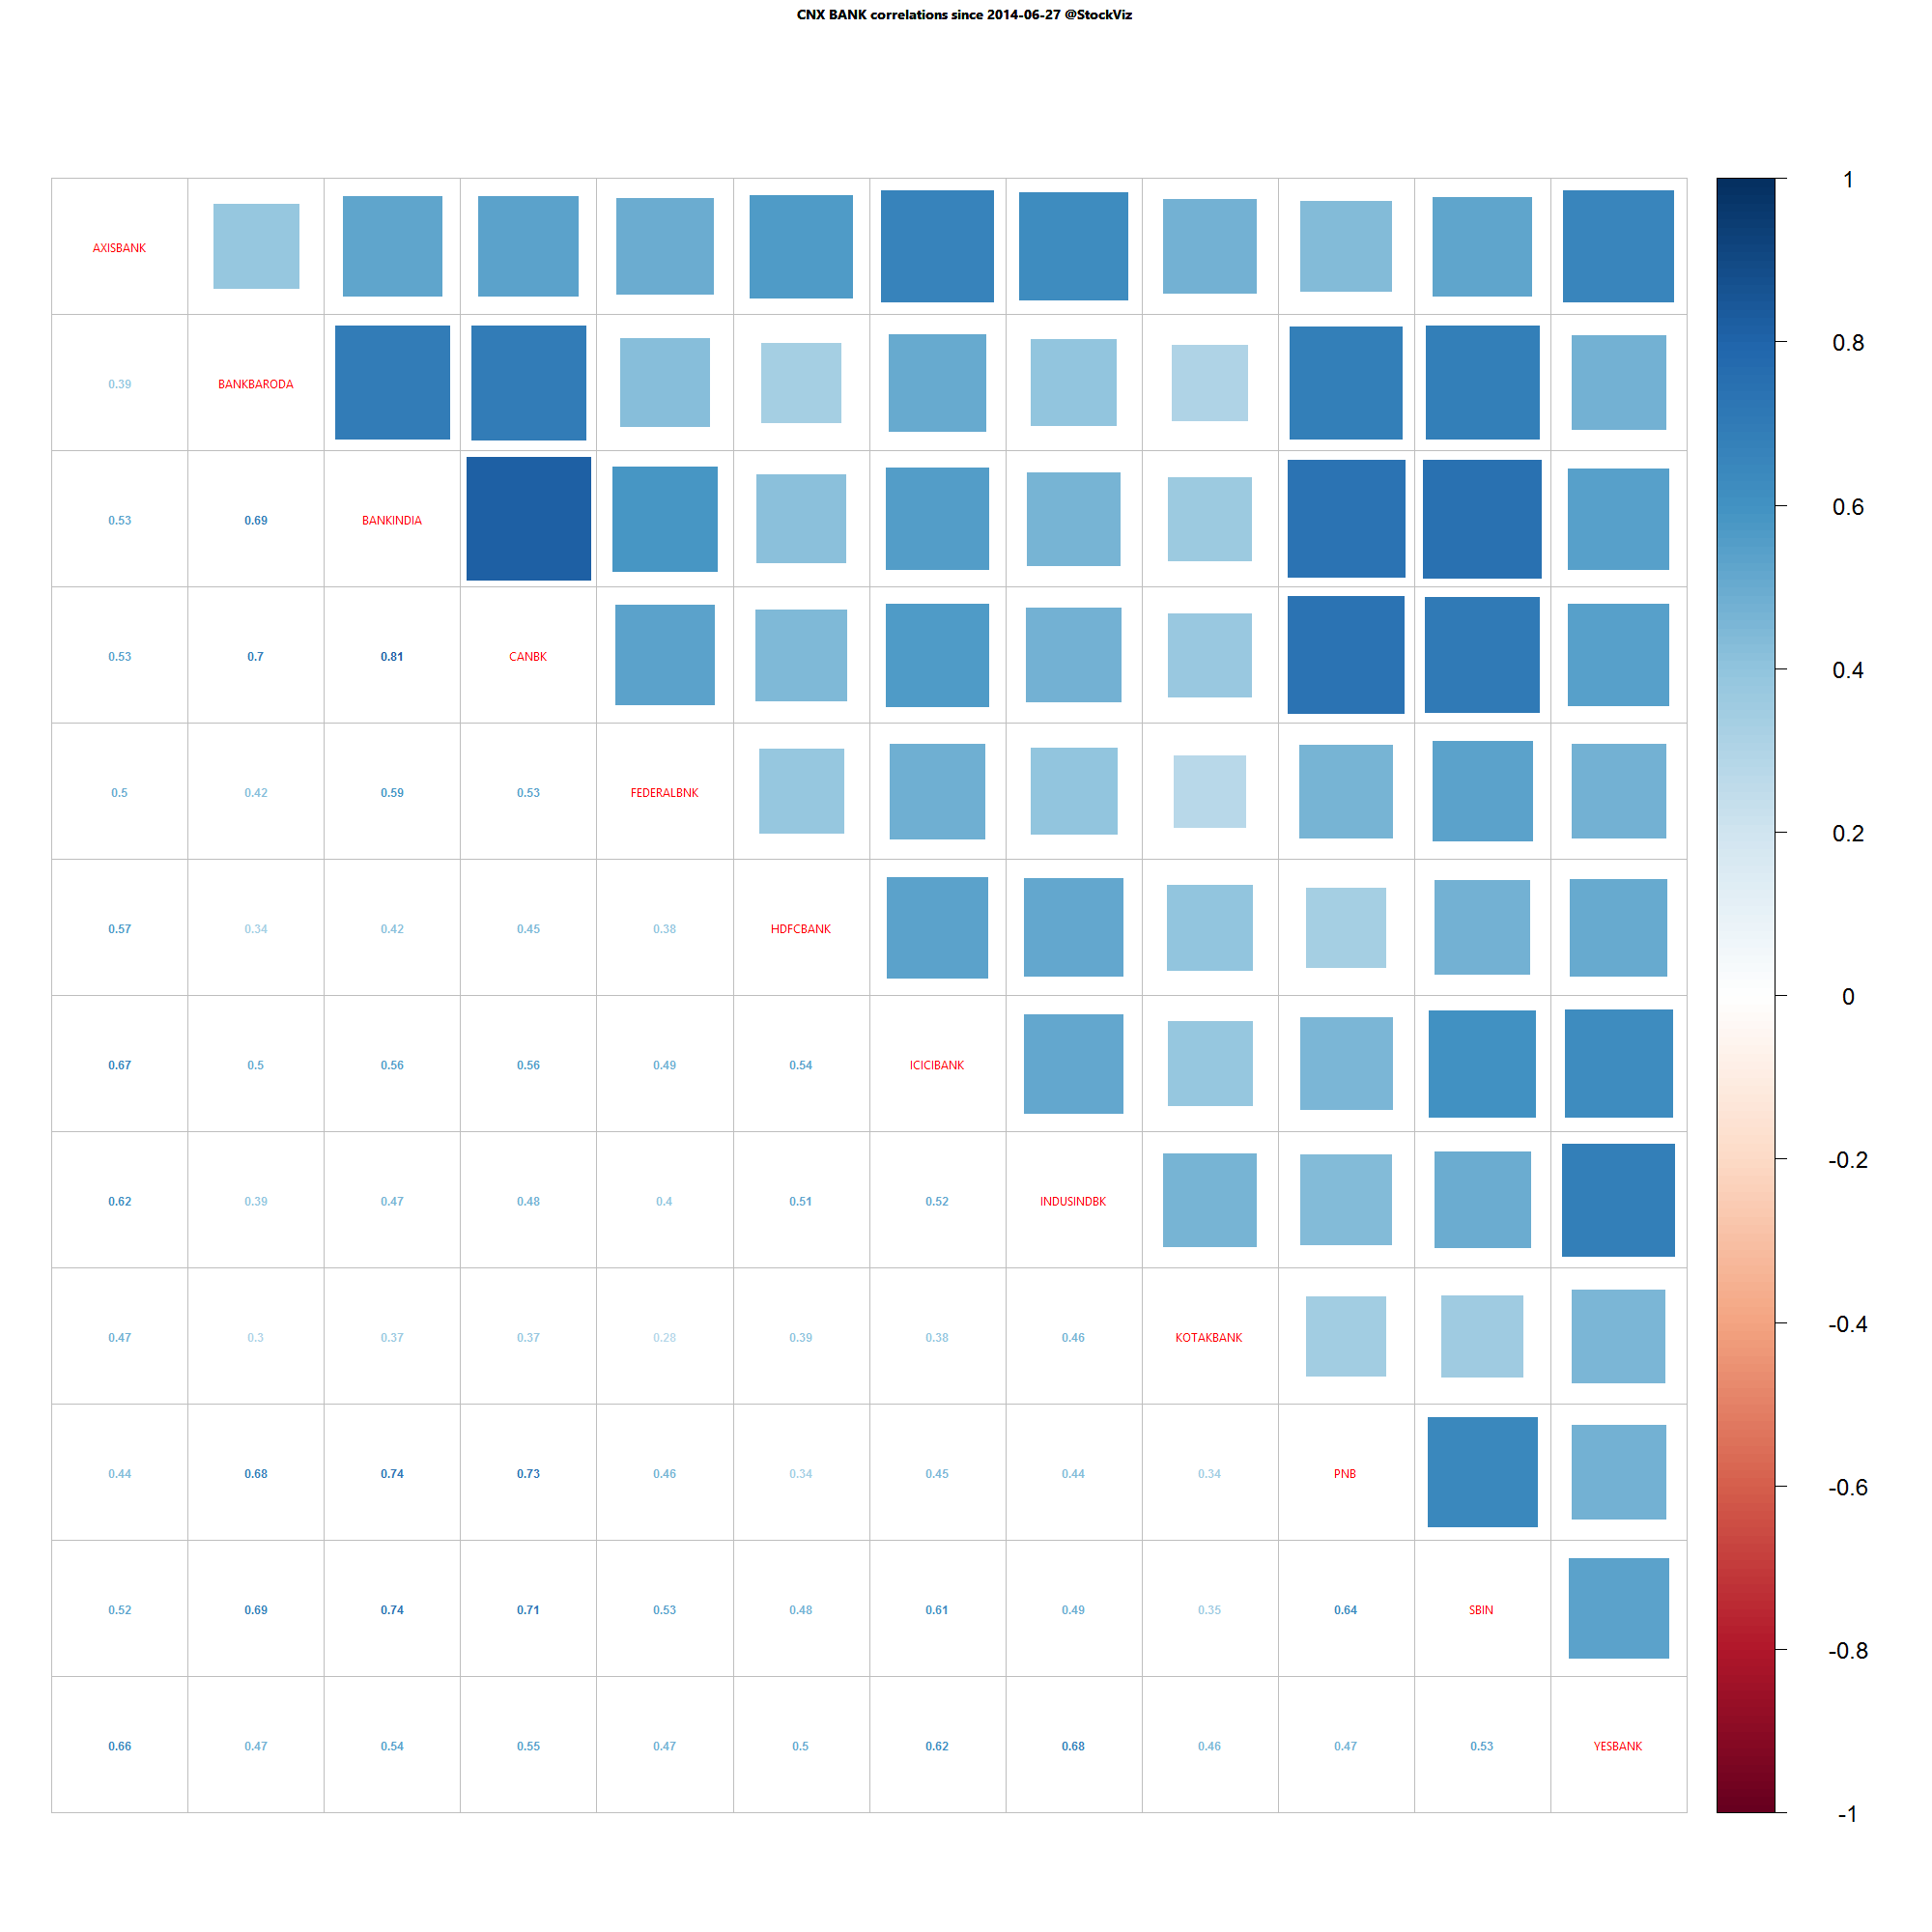
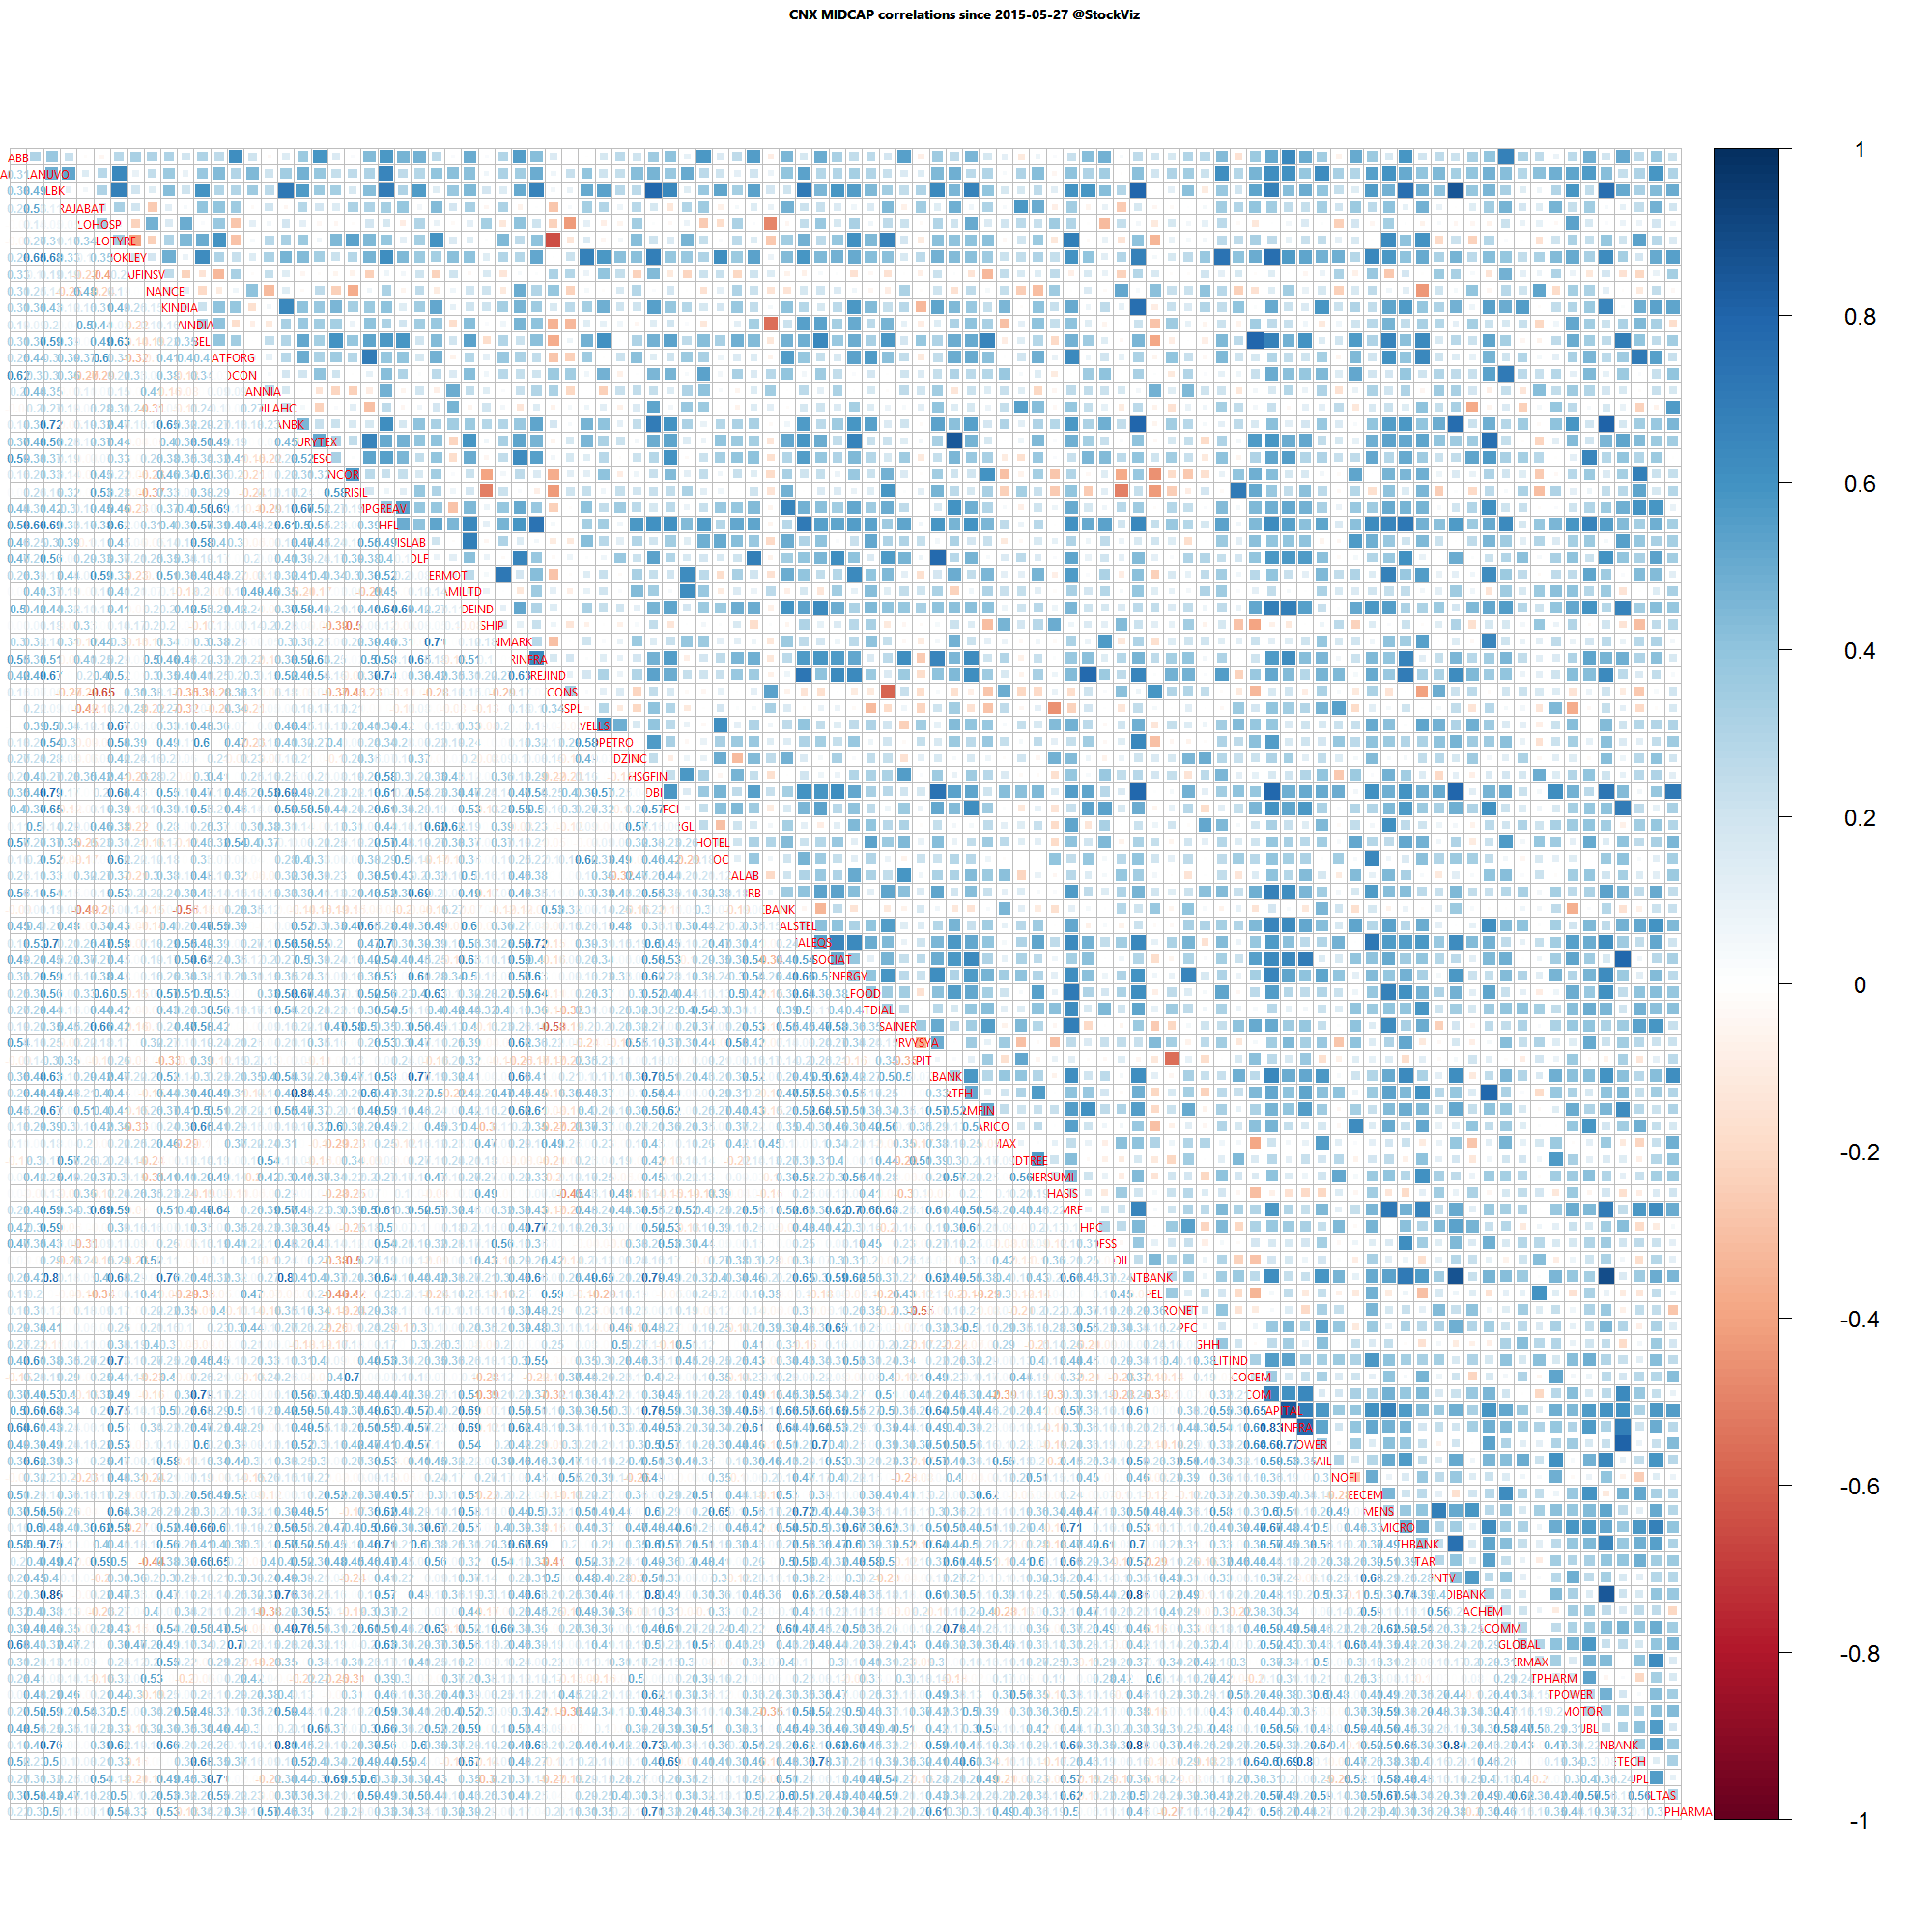
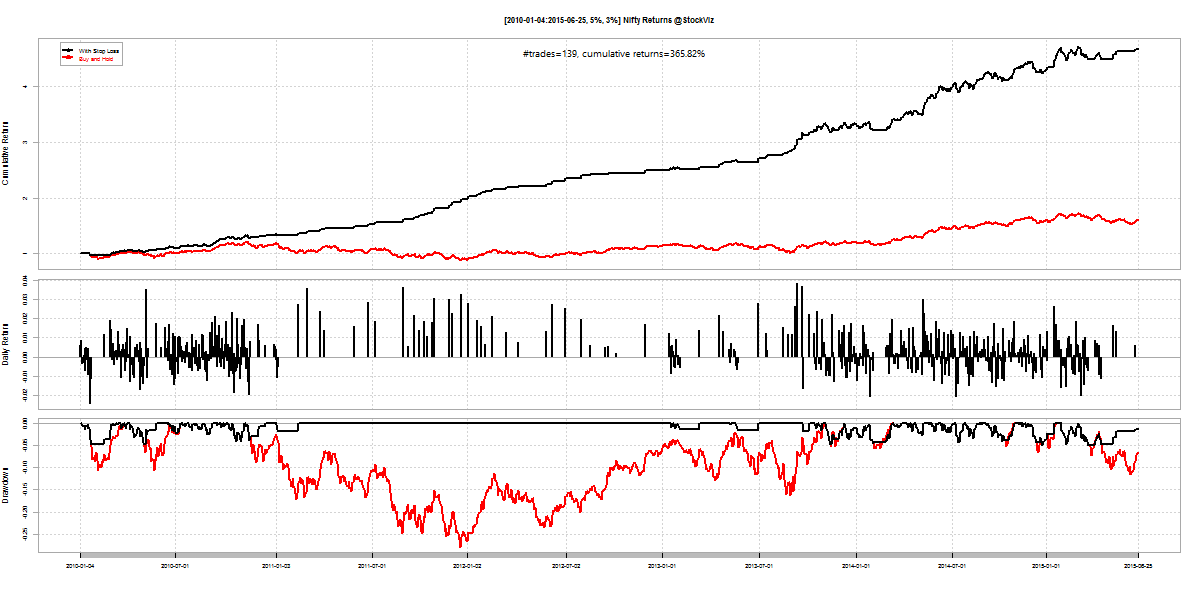
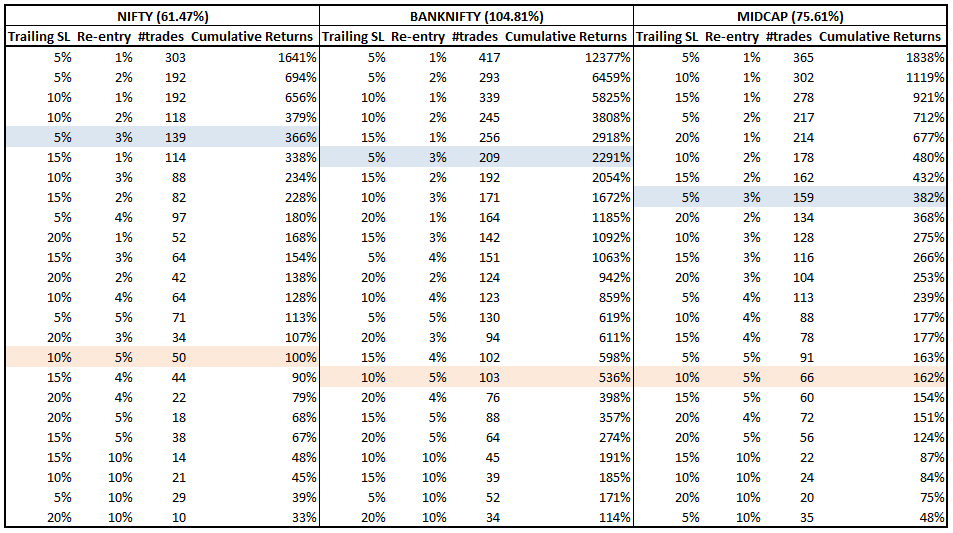
We will consider time-series from 2010 through now on the NIFTY, BANK NIFTY and CNX MIDCAP indices. During this time, the cumulative buy-and-hold returns were 61.47%, 104.81% and 75.61% respectively.

A simple 5-3 Rule

“A good plan violently executed now is better than a perfect plan executed next week.”
– George S. Patton

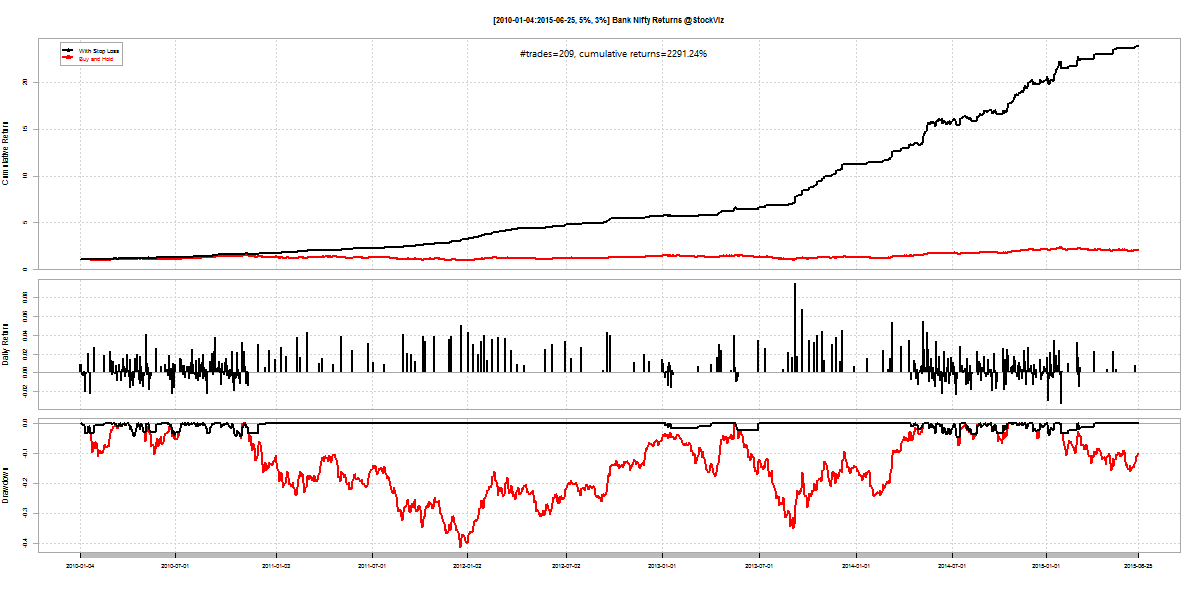
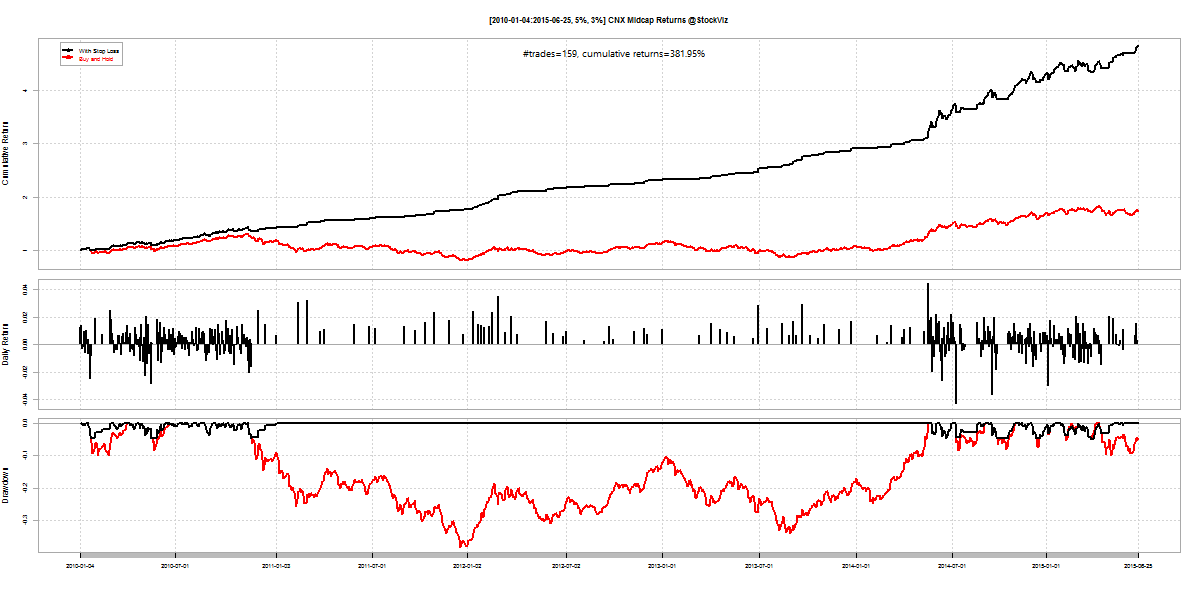
To get us started, we propose a trailing-stop loss at 5% and a re-entry rule that triggers when the index covers 3% from the lowest level since exiting the trade. This rule significantly increases returns and reduces draw-downs across all indices.

nifty.stop-loss.2010.5.3

bank-nifty.stop-loss.2010.5.3

mid-cap.stop-loss.2010.5.3

Index #trades cum. returns
Nifty 139 366%
Bank Nifty 209 2291%
Midcap 159 382%
The boost in returns come at additional trading costs. And even though the average number of trades work out to less than one a week, there maybe periods where it might trigger every day.

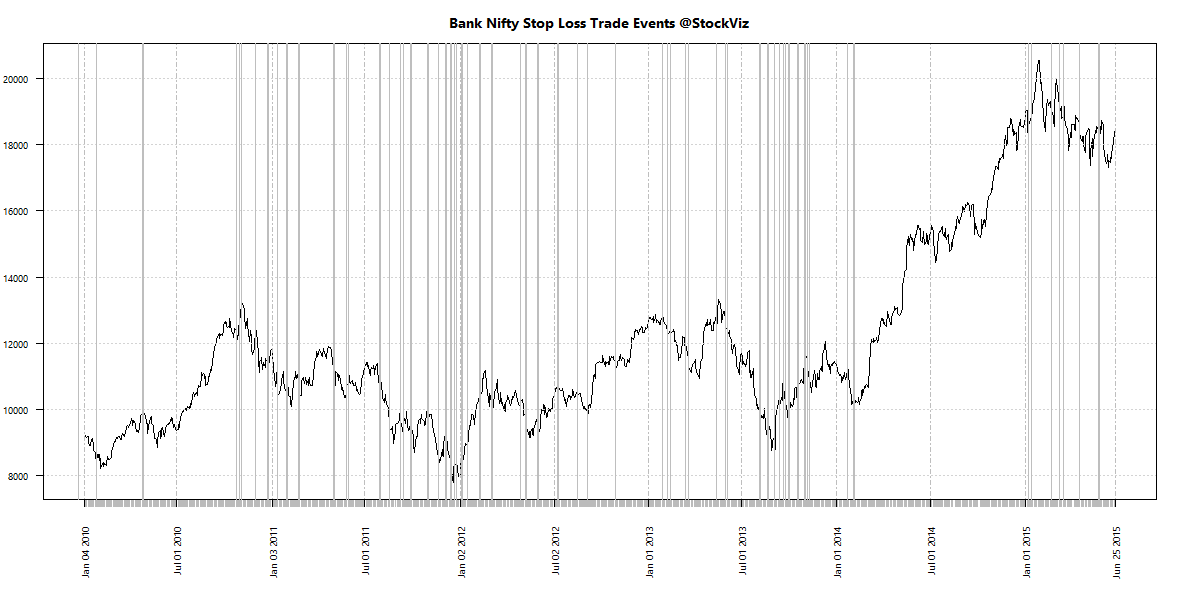
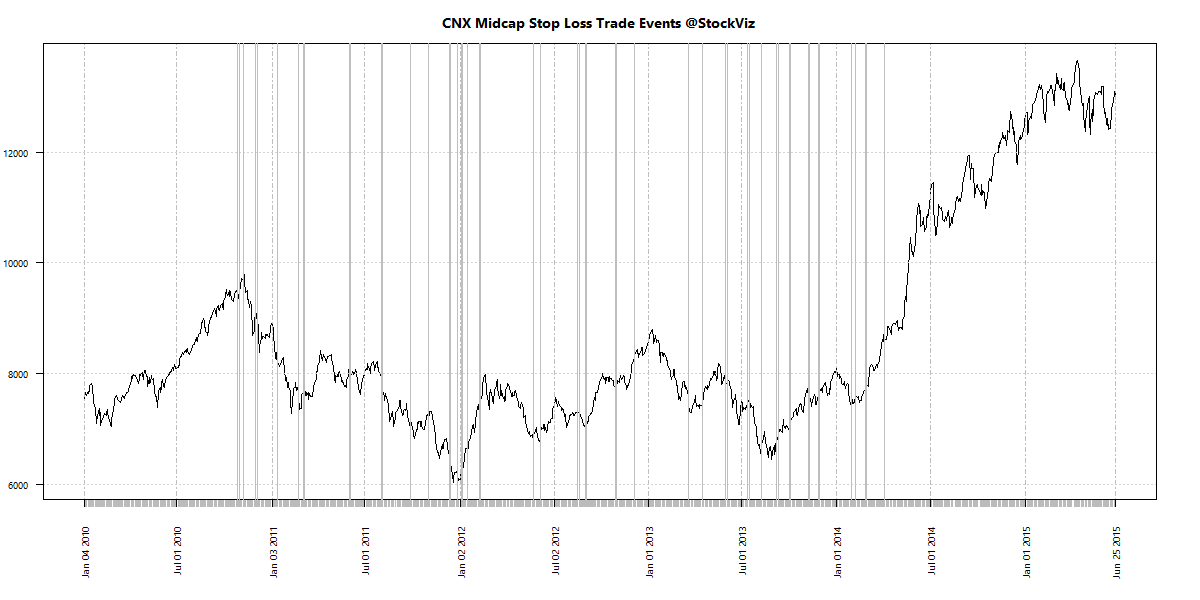
The 5-3 Trading frequency

Let’s plot the days on which this rule triggers (both buys and sells.)

nifty.stop-loss.trades

bank-nifty.stop-loss.trades

mid-cap.stop-loss.trades

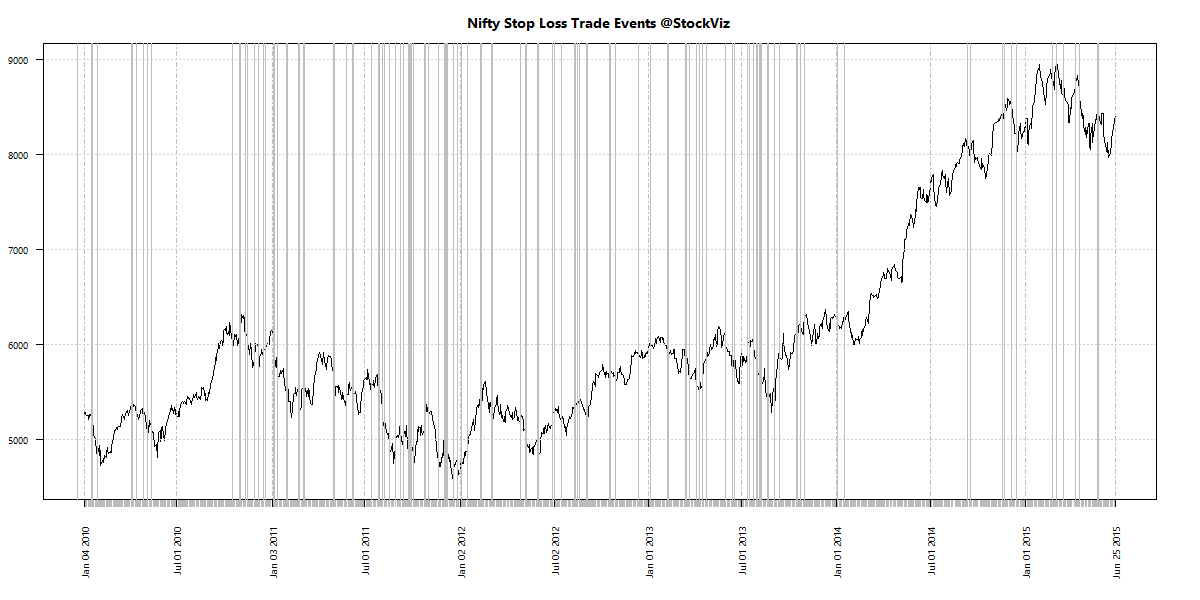
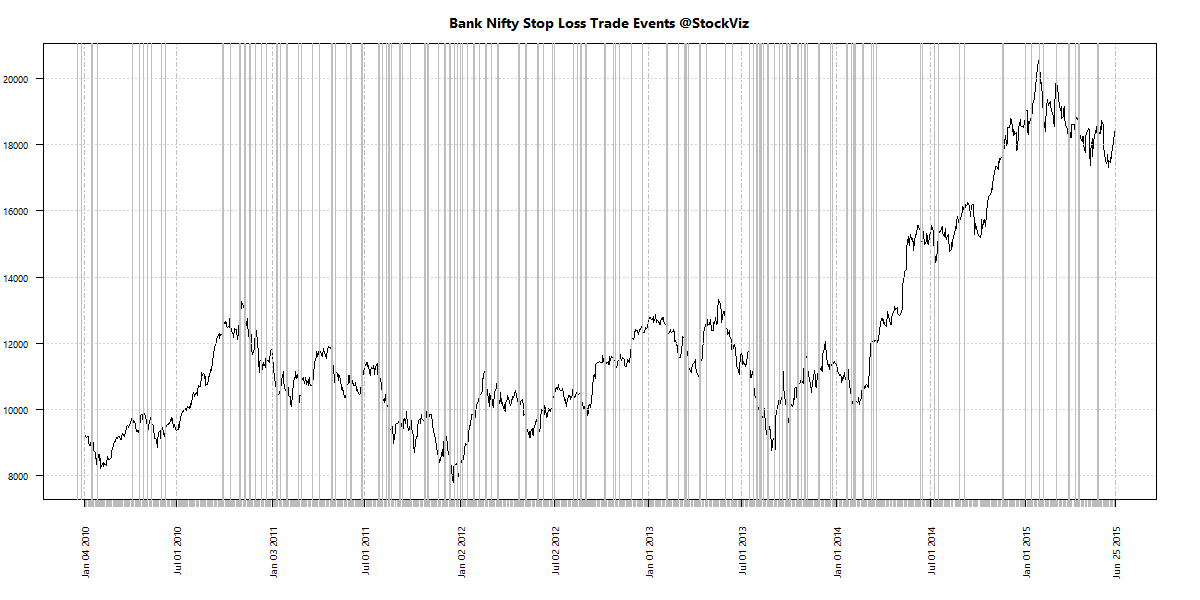
By the looks of it, the stop-loss and re-entry bands are too narrow.
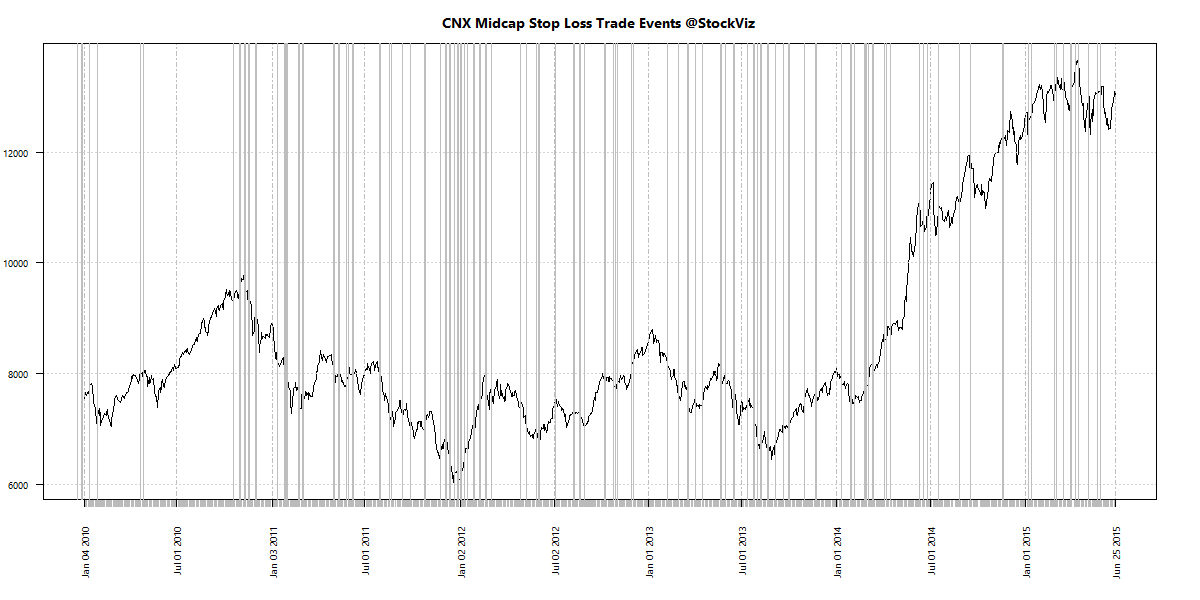
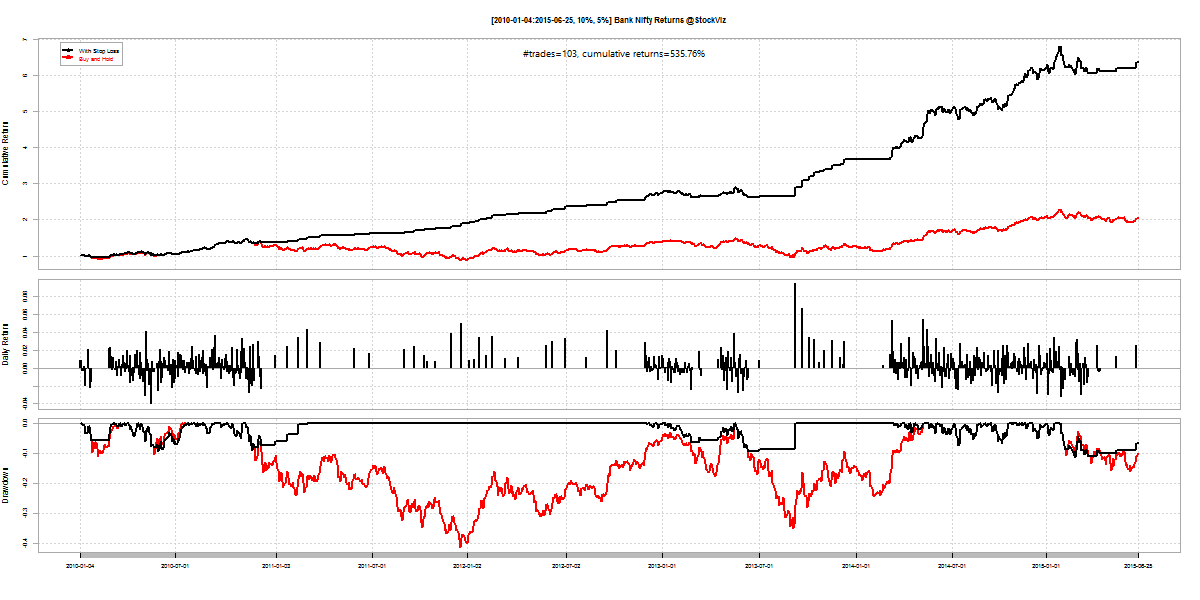
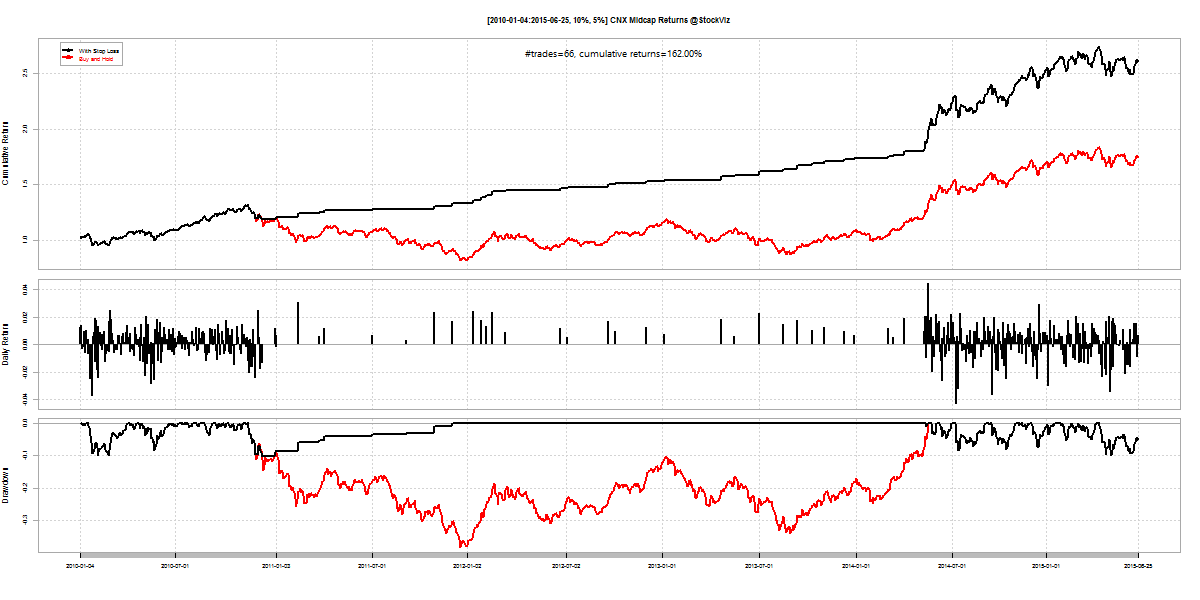
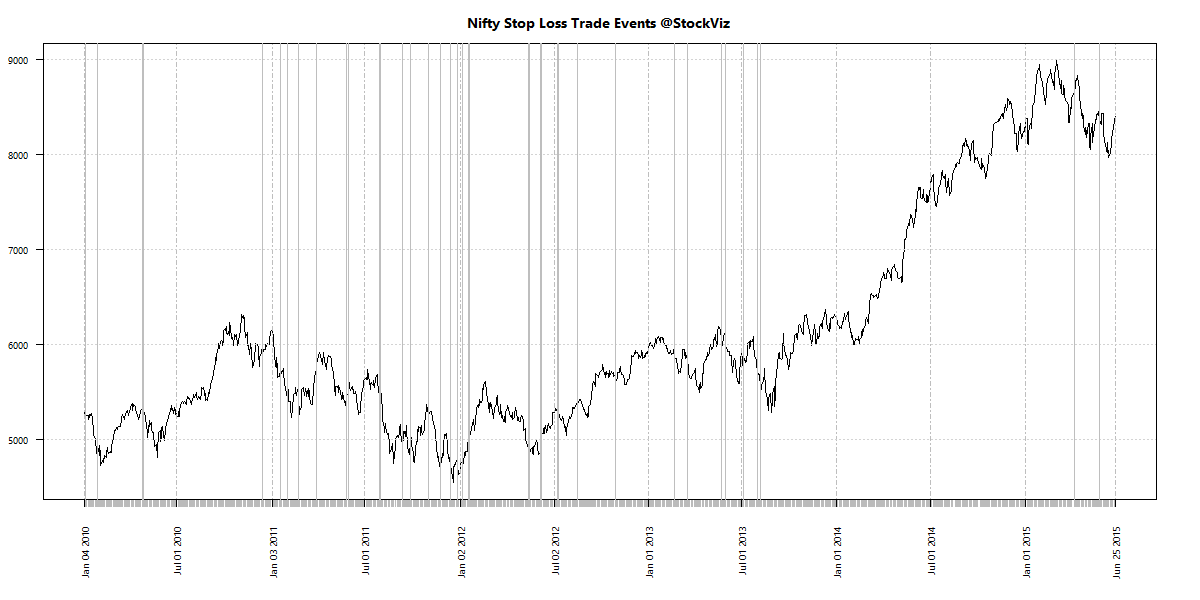
The 10-5 Rule

Suppose we set the trailing-stop loss at 10% and re-enter when the index covers 5%, we end up with a strategy with lower number of trades and yet, better returns and buy-and-hold.

Index #trades cum. returns
Nifty 50 100%
Bank Nifty 103 536%
Midcap 66 162%
Lower trading but lower returns as well.

Returns:
nifty.stop-loss.2010.10.5

bank-nifty.stop-loss.2010.10.5

mid-cap.stop-loss.2010.10.5

Trading Events:

nifty.stop-loss.trades.10-5

bank-nifty.stop-loss.trades.10-5

cnx-midcap.stop-loss.trades.10-5

Trailing stop-loss and re-entry scenarios

The master list of different strategies, their trading frequencies and cumulative returns.

trailing stop-loss and re-entry scenarios

Conclusion

Having a trailing stop-loss and re-entry strategy enhances returns but at the price of increased trading frequency. No combination of strategies can escape the doldrums – where the index is basically flat and you are getting whipsawed.

With a 15% tax on short-term gains, over the 5-year period, you should handicap strategy returns by 75% to do an apples-to-apples comparison on the tax-free buy-and-hold returns. If you use the 10-5 rule, it means you will only come-out ahead trading the Bank Nifty. So you are better off with the 5-3 rule given where trading costs stand.

Weekly Recap: Workcation vs. Post-Work

world.2015-06-19.2015-06-26

Equities

Major
DAX(DEU) +4.10%
CAC(FRA) +5.06%
UKX(GBR) +0.64%
NKY(JPN) +2.64%
SPX(USA) -0.64%
MINTs
JCI(IDN) -1.24%
INMEX(MEX) +0.72%
NGSEINDX(NGA) -1.22%
XU030(TUR) +1.24%
BRICS
IBOV(BRA) +0.80%
SHCOMP(CHN) -6.37%
NIFTY(IND) +1.90%
INDEXCF(RUS) -1.12%
TOP40(ZAF) +1.91%

Commodities

Energy
Brent Crude Oil +0.09%
Natural Gas -1.49%
Ethanol +6.91%
RBOB Gasoline -0.81%
Heating Oil -0.54%
WTI Crude Oil -0.12%
Metals
Gold 100oz -2.46%
Silver 5000oz -2.48%
Copper +2.32%
Palladium -3.99%
Platinum -0.14%

Currencies

USDEUR:+1.72% USDJPY:+1.04%

MINTs
USDIDR(IDN) -0.18%
USDMXN(MEX) +1.53%
USDNGN(NGA) +0.03%
USDTRY(TUR) -1.32%
BRICS
USDBRL(BRA) +1.09%
USDCNY(CHN) +0.00%
USDINR(IND) +0.13%
USDRUB(RUS) +1.40%
USDZAR(ZAF) +0.35%
Agricultural
Cattle -2.18%
Cocoa +2.03%
Coffee (Arabica) +4.49%
Corn +8.84%
Lean Hogs -0.33%
Lumber -2.14%
Soybean Meal +5.26%
Soybeans +3.09%
Wheat +14.64%
White Sugar +3.04%
Coffee (Robusta) +2.71%
Cotton +5.93%
Feeder Cattle -2.65%
Orange Juice -1.33%
Sugar #11 +4.05%

Credit Indices

Index Change
Markit CDX EM +0.20%
Markit CDX NA HY +0.37%
Markit CDX NA IG -1.17%
Markit iTraxx Asia ex-Japan IG -3.62%
Markit iTraxx Australia -5.28%
Markit iTraxx Europe -8.32%
Markit iTraxx Europe Crossover -40.54%
Markit iTraxx Japan -6.79%
Markit iTraxx SovX Western Europe -3.42%
Markit LCDX (Loan CDS) -0.02%
Markit MCDX (Municipal CDS) -0.92%
Alexis Tsipras want the Greek to decided if they want to accept the bailout terms set by the creditors. Referendum is set on the 5th of July. What will happen if they reject it?

Nifty Heatmap

CNX NIFTY.2015-06-19.2015-06-26

Index Returns

For a deeper dive into indices, check out our weekly Index Update.
index.performance.2015-06-19.2015-06-26

Sector Performance

sector performance.2015-06-19.2015-06-26

Market Cap Decile Performance

Decile Mkt. Cap. Adv/Decl
1 -1.35% 62/69
2 +4.31% 70/60
3 +2.18% 69/61
4 +3.60% 70/61
5 +3.14% 70/59
6 +2.60% 74/56
7 +2.74% 69/62
8 +2.48% 64/66
9 +1.59% 62/68
10 +2.66% 72/59
Rally ho!

Top Winners and Losers

UNIONBANK +6.94%
UPL +7.20%
BAJAJHLDNG +8.33%
INFRATEL -6.49%
TECHM -4.11%
CANBK -4.10%
Is Infratel going to feel the heat of Airtel’s OneWeb investment?

ETF Performance

BANKBEES +2.86%
PSUBNKBEES +2.17%
NIFTYBEES +1.94%
INFRABEES +1.67%
JUNIORBEES +1.11%
CPSEETF +0.92%
GOLDBEES -1.48%
PSU banks: caught between dilution and survival.

Yield Curve

yield Curve.2015-06-19.2015-06-26

Bond Indices

Sub Index Change in YTM Total Return(%)
GSEC TB -0.20 +0.20%
GSEC SUB 1-3 -0.16 +0.60%
GSEC SUB 3-8 -0.22 +1.25%
GSEC SUB 8 -0.24 +2.11%
Rally on the long-end…

Investment Theme Performance

Equity Mutual Funds

Bond Mutual Funds

Thought for the weekend

Technology is on track to permanently replace a great deal of human work. No job is truly safe. Cultural destruction goes hand-in-hand with job destruction. The expectation that work will be a central feature of adult life is going to dissipate for a significant portion of society.

However, while we wait for this future, a small but growing number of workers are instead petitioning the boss to combine work and vacation: time away from the office that includes a few days working from an exotic locale.

Sources:
A World Without Work
This Summer, How About a Workcation?

Investing in European Equities

Why Now?

Here are the top 5 reasons why investors should look at European equities:

  1. The ECB’s $1.1 trillion bond-buying program is beginning to kick in.
  2. The slide in the euro’s value against the dollar has also made European exports more competitive.
  3. Valuations appear attractive.
  4. Eurozone corporates are less leveraged, and their profitability has remained resilient.
  5. Greece is a source of uncertainty. Investing during uncertain times bears outsized returns.

How?

Unless you have a foreign equities trading account, the only way you can invest in European equities are through feeder funds or international funds. Feeder funds are just a wrapper around another fund. One such fund is the Religare Invesco Pan European Equity Fund. It feeds into the Invesco Pan European Equity Fund (MorningStar.)

It can be argued that investing in a narrow geographic is riskier compared to investing in a broad international fund. We had highlighted one such fund, the Birla Sun Life International Equity Fund Plan A, in our post about investing in non-rupee assets. If you compare the two, between 2014-03-03 and 2015-06-25, Religare’s fund gave an IRR of 1.27% vs. Birla’s 7.14%download Although this blows when compared to the CNX Midcap (IRR of 48.41% in the same period), remember that investing is all about prospective returns.

Risks

There is always the risk that Greece will blowup and drag Italy down with it, causing the Eurozone to implode. Tack on the risk of active management and currency risk (the rupee might appreciate against the euro), it becomes a pretty scary proposition. But remember, investing during uncertain times bears outsized returns.

Call us to discuss whether this fund is right for you.

Index Update 27.06.2015

MOMENTUM

We run our proprietary momentum scoring algorithm on indices just like we do on stocks. You can use the momentum scores of sub-indices to get a sense for which sectors have the wind on their backs and those that are facing headwinds.

Traders can pick their longs in sectors with high short-term momentum and their shorts in sectors with low momentum. Investors can use the longer lookback scores to position themselves using our re-factored index Themes.

You can see how the momentum algorithm has performed on individual stocks here.

Here are the best and the worst sub-indices:

index momentum best 365 2015-06-26 png

index momentum best 50 2015-06-26 png

index momentum worst 365 2015-06-26 png

index momentum worst 50 2015-06-26 png

Relative Strength Spread

CNX_500 relative-spread-index 50 2015-06-26 png

Refactored Index Performance

50-day performance, from April 17, 2015 through June 26, 2015:

Trend Model Summary

Index Signal % From Peak Day of Peak
CNX AUTO LONG
7.17
2015-Jan-27
CNX BANK LONG
10.62
2015-Jan-27
CNX ENERGY LONG
25.82
2008-Jan-14
CNX FMCG LONG
11.66
2015-Feb-25
CNX INFRA LONG
47.92
2008-Jan-09
CNX IT LONG
88.10
2000-Feb-21
CNX MEDIA LONG
24.66
2008-Jan-04
CNX METAL LONG
58.47
2008-Jan-04
CNX MNC LONG
3.71
2015-Mar-12
CNX NIFTY LONG
6.84
2015-Mar-03
CNX PHARMA LONG
12.76
2015-Apr-08
CNX PSE LONG
24.69
2008-Jan-04
CNX REALTY SHORT
90.21
2008-Jan-14
A perk up in momentum metrics: RS-Spread has reverted to mean; bank and financials are showing some green shoots.

Correlation Update 27.06.2015

Nifty one year daily return correlations

Nifty one year daily return correlations

Nifty one month daily return correlations

Nifty one month daily return correlations

Bank Nifty one year daily return correlations

Bank Nifty one year daily return correlations

Bank Nifty one month daily return correlations

Bank Nifty one month daily return correlations

Midcap one year daily return correlations

Midcap one year daily return correlations

Midcap one month daily return correlations

Midcap one month daily return correlations

A lot of thick blue squares mean that positive correlations are high. Red squares mean negative correlations are high. Whites are the doldrums.