Category: Your Money

Relative Strength Spread

Introduction

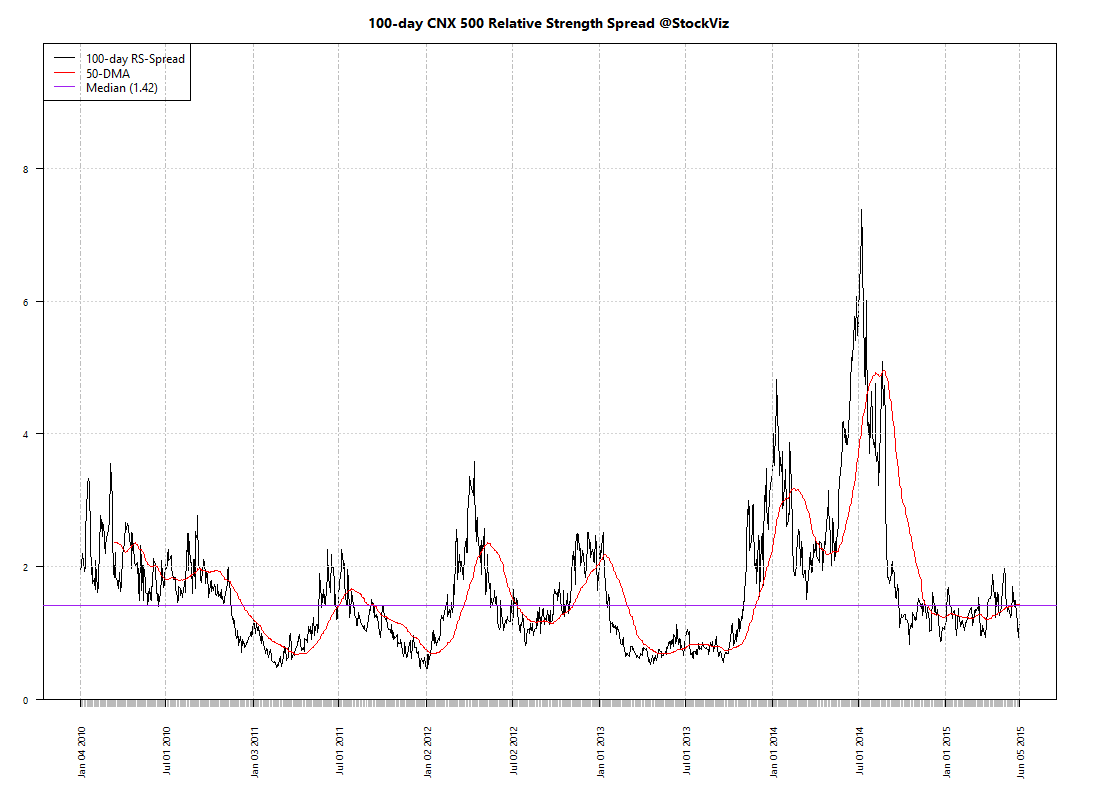
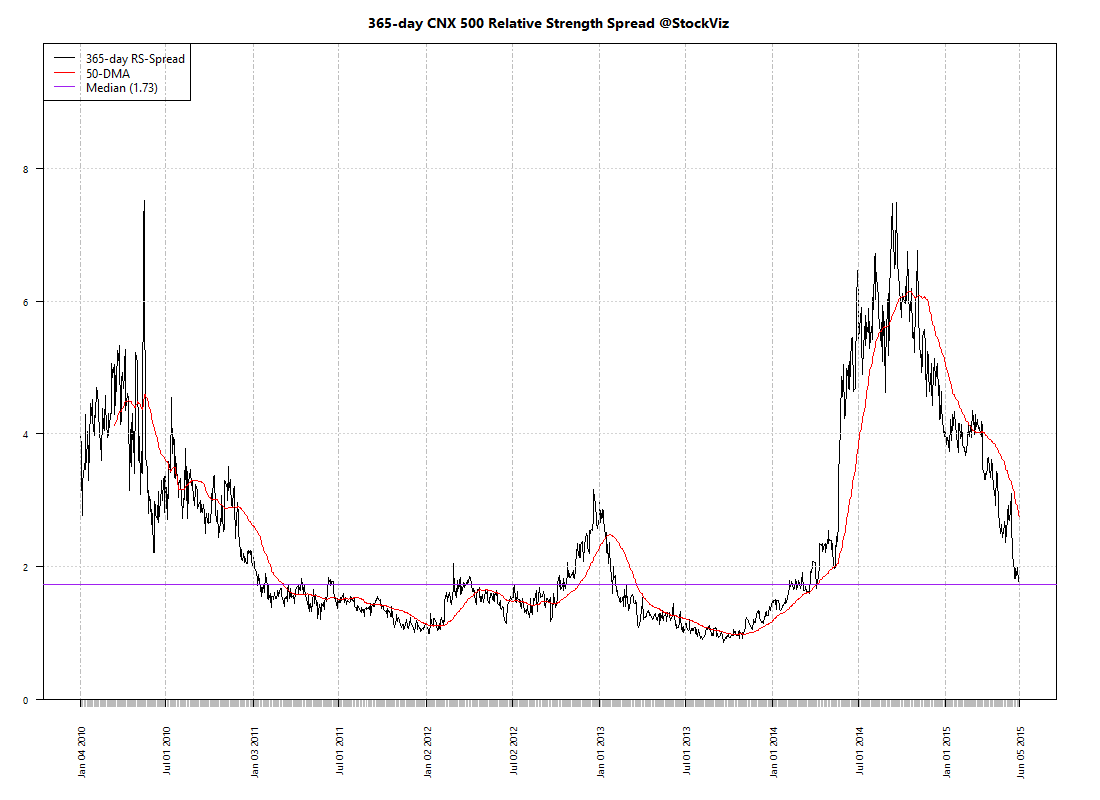
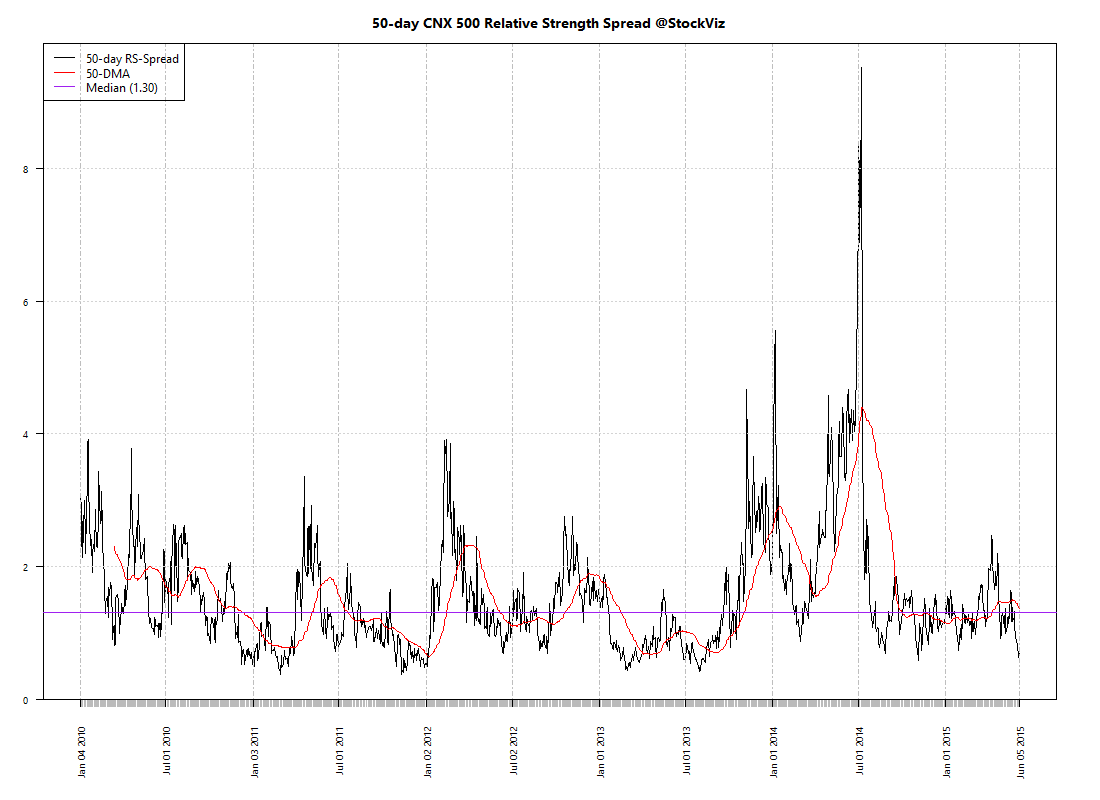
The Relative Strength Spread takes all the stocks in the CNX 500 index, sorts them by their relative performance vs. the index and takes the ratio between the median relative performance of the top decile and the bottom decile. When you plot the spread, a rising chart indicates that relative strength leaders are performing better than relative strength laggards.

Relative Strength Spread Charts
CNX 500.relative-spread-index.50

CNX 500.relative-spread-index.100

CNX 500.relative-spread-index.365

High Relative Strength Spread environments provide the largest momentum profits – winning trades easily eclipse losing trades.

The 365-day RS-Spread chart clearly demarcates the “Modi-Mania.” The Modi-Mania was manna from heaven for trend-following strategies. However, the post-Modi-Mania phase has seem most momentum algorithms struggle.

A silver-lining is that the 50-day chart shows that we are probably due for a momentum comeback. But it is not uncommon to have prolonged periods of the “doldrums” where momentum is just “average.” It maybe tempting to give up on trend-following strategies during these periods. But just like how we cannot predict momentum crashes, we cannot predict momentum comebacks. So it is important to maintain allocation to momentum strategies.

Conclusion

The Relative Strength Spread index can be useful in explaining momentum profits. However, it is not much of a predictor of future momentum returns. It could also be used to explain the “skill vs. luck” question of returns – just like how a rising tide lifts all boats, a high RS-Spread environment will lift all portfolio returns.

Going forward, we will update the 50-day Relative Strength Spread chart on our weekly Index Update posts.
Weekly Recap: Satisficers vs. Maximizers

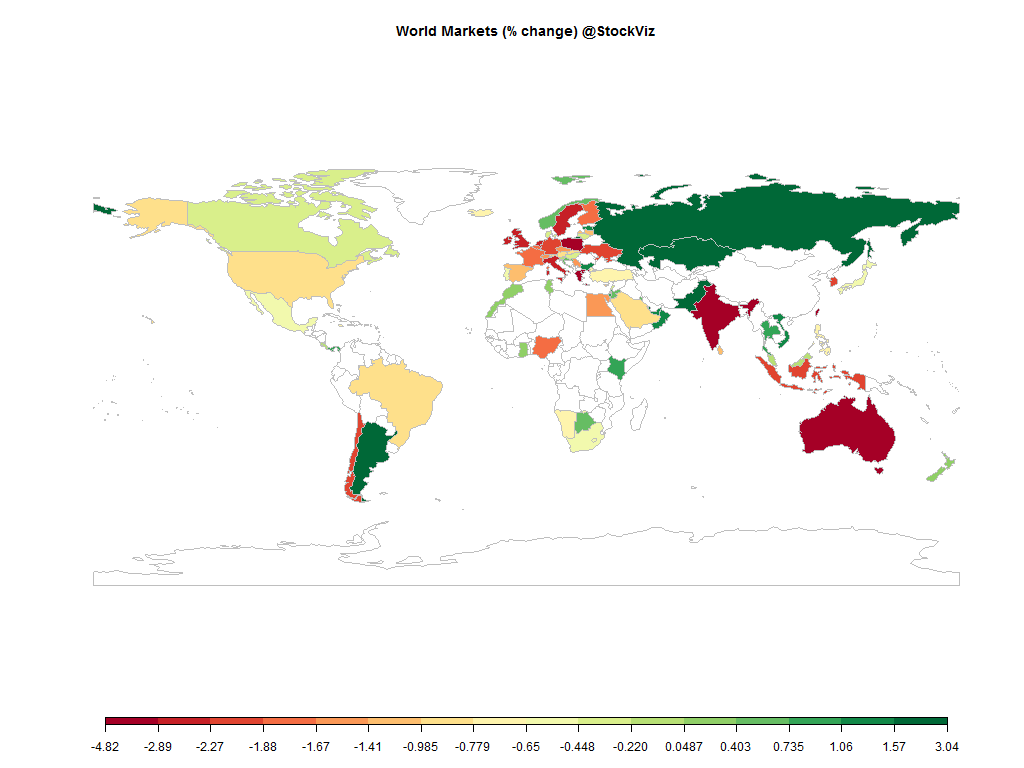
world.2015-05-29.2015-06-05

Equities

Major
DAX(DEU) -1.90%
CAC(FRA) -1.74%
UKX(GBR) -2.57%
NKY(JPN) -0.50%
SPX(USA) -0.92%
MINTs
JCI(IDN) -2.22%
INMEX(MEX) -0.47%
NGSEINDX(NGA) -1.88%
XU030(TUR) -0.74%
BRICS
IBOV(BRA) -0.84%
SHCOMP(CHN) +8.92%
NIFTY(IND) -3.78%
INDEXCF(RUS) +2.66%
TOP40(ZAF) -0.63%

Commodities

Energy
RBOB Gasoline -3.14%
Brent Crude Oil -3.70%
Ethanol +0.45%
Heating Oil -4.31%
Natural Gas -1.63%
WTI Crude Oil -2.76%
Metals
Copper -1.09%
Gold 100oz -1.74%
Palladium -3.29%
Silver 5000oz -3.59%
Platinum -1.44%

Currencies

USDEUR:-1.13% USDJPY:+1.34%

MINTs
USDIDR(IDN) +0.50%
USDMXN(MEX) +2.09%
USDNGN(NGA) -0.17%
USDTRY(TUR) -0.06%
BRICS
USDBRL(BRA) -1.37%
USDCNY(CHN) +0.09%
USDINR(IND) -0.11%
USDRUB(RUS) +7.20%
USDZAR(ZAF) +3.61%
Agricultural
Cattle +0.36%
Cocoa -0.05%
Coffee (Arabica) +6.25%
Coffee (Robusta) +5.63%
Corn +2.49%
Cotton -0.31%
Orange Juice +2.32%
Soybean Meal -0.36%
Soybeans +0.59%
Wheat +8.48%
White Sugar +0.26%
Feeder Cattle -0.40%
Lean Hogs -2.47%
Lumber +6.70%
Sugar #11 +0.58%

Credit Indices

Index Change
Markit CDX EM -0.43%
Markit CDX NA HY -0.19%
Markit CDX NA IG +1.22%
Markit iTraxx Asia ex-Japan IG +0.08%
Markit iTraxx Australia -0.48%
Markit iTraxx Europe +1.11%
Markit iTraxx Europe Crossover +9.04%
Markit iTraxx Japan +2.79%
Markit iTraxx SovX Western Europe -0.09%
Markit LCDX (Loan CDS) -0.02%
Markit MCDX (Municipal CDS) -1.87%

Nifty Heatmap

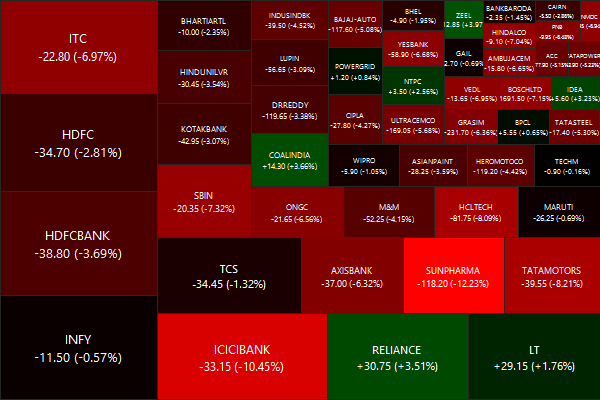
CNX NIFTY.2015-05-29.2015-06-05

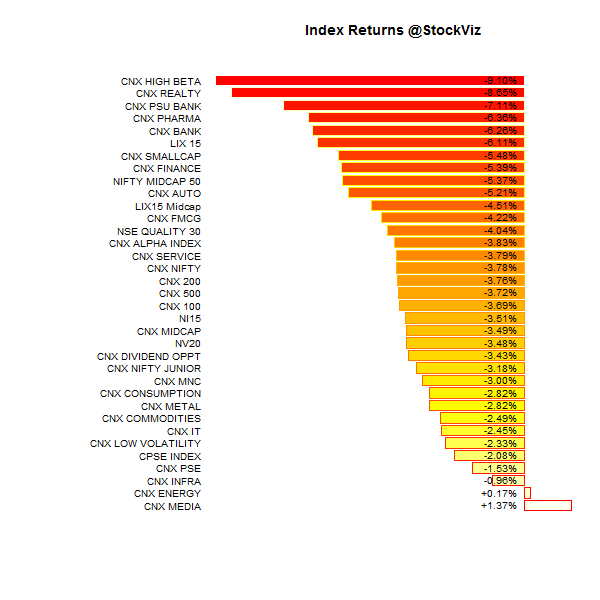
Index Returns

For a deeper dive into indices, check out our weekly Index Update.
index performance.2015-05-29.2015-06-05

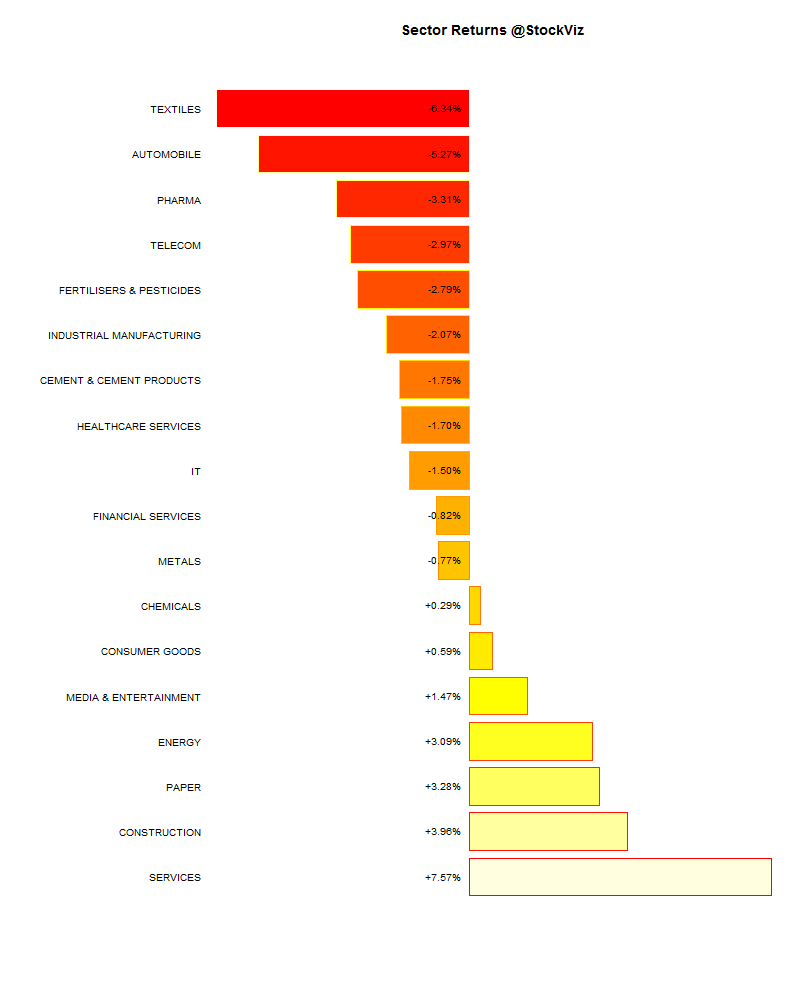
Sector Performance

sector performance.2015-05-29.2015-06-05

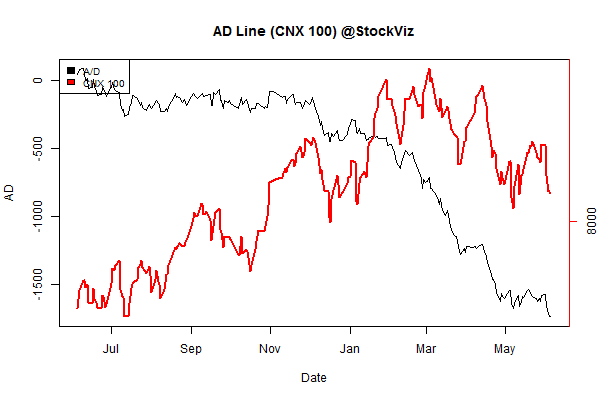
Advance Decline

advance.decline.line2.2015-05-29.2015-06-05

Market Cap Decile Performance

Decile Mkt. Cap. Adv/Decl
1 (micro) -6.46% 61/68
2 -4.39% 51/78
3 -7.87% 53/76
4 -5.49% 48/81
5 -3.90% 56/73
6 -5.88% 54/75
7 -3.66% 58/71
8 -3.13% 53/76
9 -3.46% 60/69
10 (mega) -2.78% 63/66
Looks like a page out of the pulp-fiction novel: “Blood Bath and Beyond…”

Top Winners and Losers

ZEEL +3.97%
BRITANNIA +6.47%
GODREJCP +6.79%
RPOWER -15.33%
SUNPHARMA -12.23%
RCOM -11.83%
Markets found some solace in biscuits and shampoo…

ETF Performance

INFRABEES +0.14%
GOLDBEES -0.63%
CPSEETF -2.14%
JUNIORBEES -2.45%
NIFTYBEES -3.27%
BANKBEES -6.22%
PSUBNKBEES -7.48%
Banks went from boost to woost…

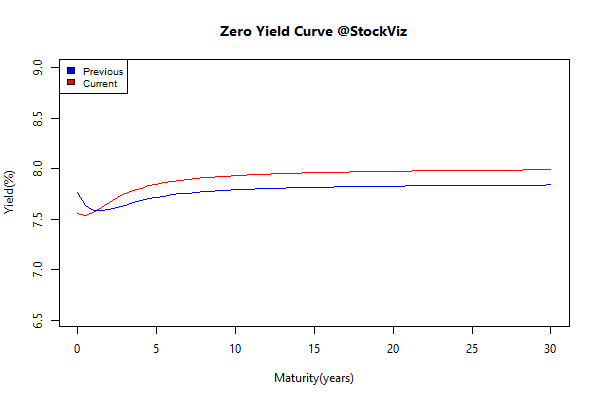
Yield Curve

yield Curve.2015-05-29.2015-06-05

Bond Indices

Sub Index Change in YTM Total Return(%)
GSEC TB +0.33 +0.06%
GSEC SUB 1-3 +0.37 -0.38%
GSEC SUB 3-8 +0.20 -0.95%
GSEC SUB 8 -0.06 +0.40%
This is totally mind-blasting: yields went up on a week when rates were cut.

Investment Theme Performance

Equity Mutual Funds

Bond Mutual Funds

Thought for the weekend

Psychology professor Barry Schwartz, author of The Paradox of Choice, divided us into two types of people: “satisficers” (those who satisfy and then suffice) and “maximizers,” who seek out the best.

Thanks to smartphones and the Internet, our options are unlimited, whether it’s a retail item or a romantic possibility. We have all become maximizers.

While we may think we know what we want, we’re often wrong.

Source: Modern Romance

Index Update 06.06.2015

MOMENTUM

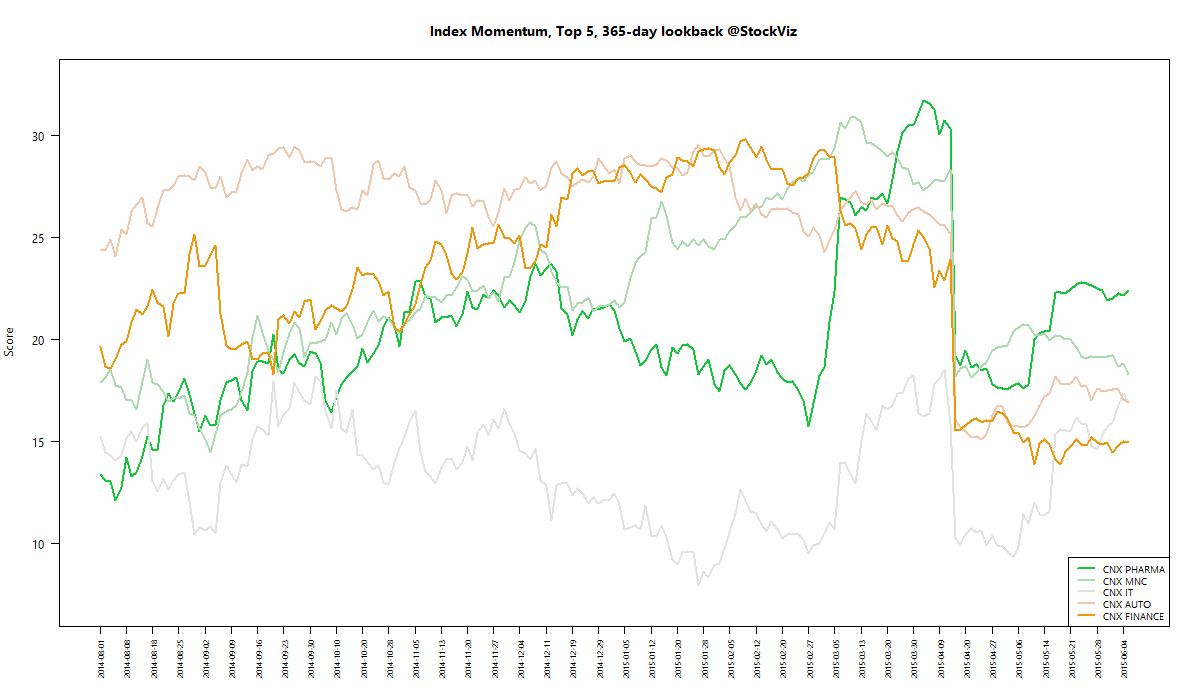
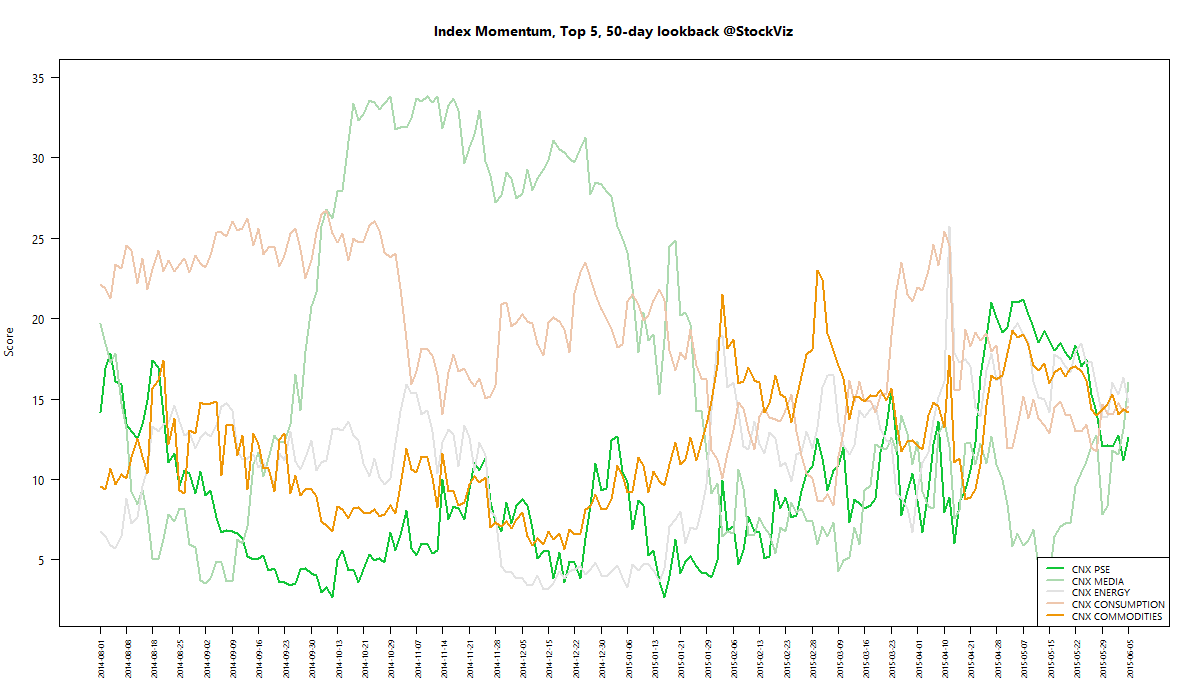
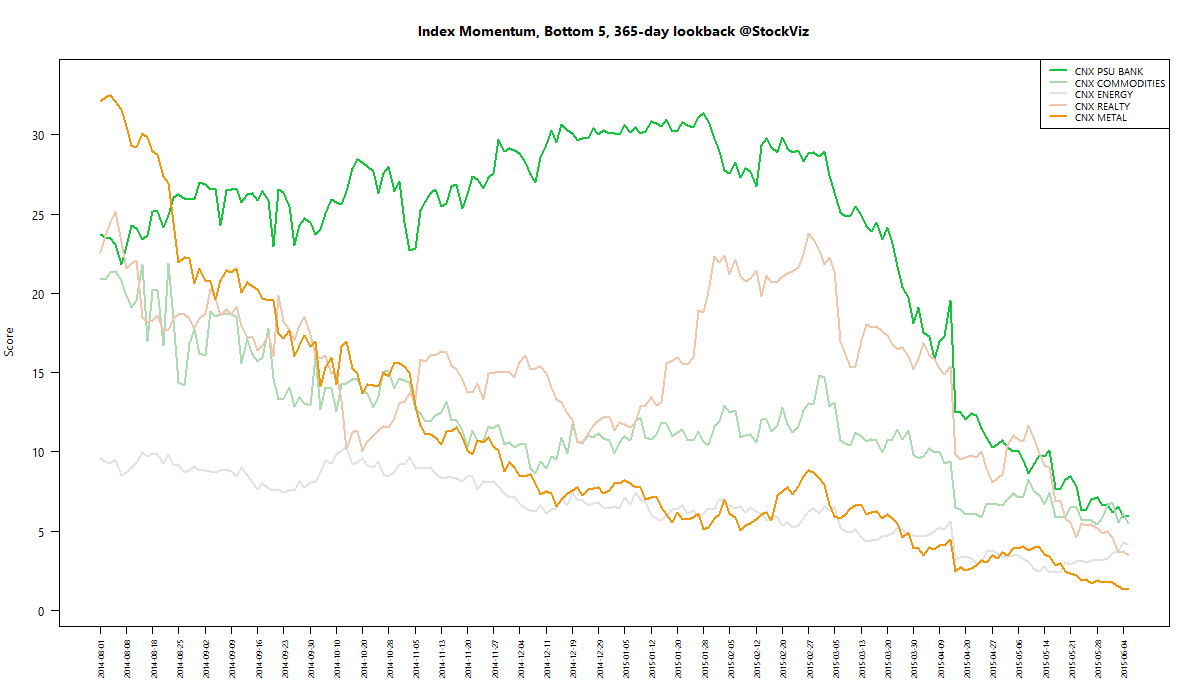
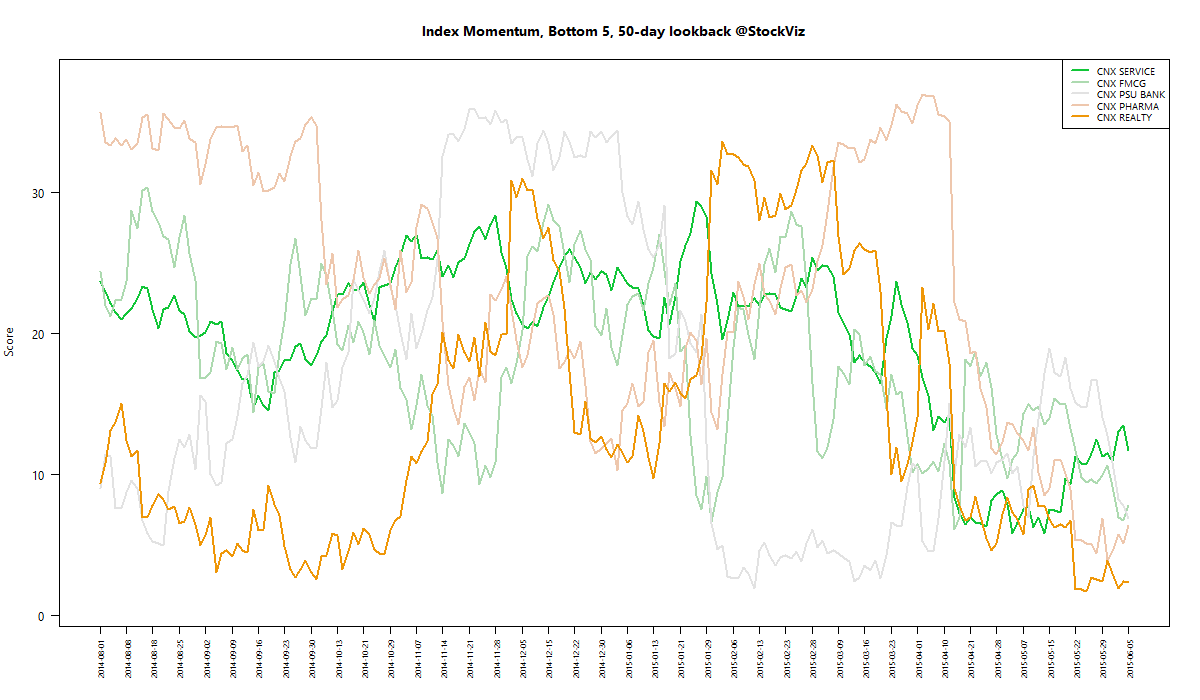
We run our proprietary momentum scoring algorithm on indices just like we do on stocks. You can use the momentum scores of sub-indices to get a sense for which sectors have the wind on their backs and those that are facing headwinds.

Traders can pick their longs in sectors with high short-term momentum and their shorts in sectors with low momentum. Investors can use the longer lookback scores to position themselves using our re-factored index Themes.

You can see how the momentum algorithm has performed on individual stocks here.

Here are the best and the worst sub-indices:

index momentum best 365 2015-06-05 png

index momentum best 50 2015-06-05 png

index momentum worst 365 2015-06-05 png

index momentum worst 50 2015-06-05 png

Refactored Index Performance

50-day performance, from March 24, 2015 through June 05, 2015:

Trend Model Summary

Index Signal % From Peak Day of Peak
CNX AUTO SHORT
11.07
2015-Jan-27
CNX BANK SHORT
14.62
2015-Jan-27
CNX ENERGY SHORT
29.22
2008-Jan-14
CNX FMCG SHORT
13.62
2015-Feb-25
CNX INFRA SHORT
49.05
2008-Jan-09
CNX IT SHORT
88.18
2000-Feb-21
CNX MEDIA SHORT
27.38
2008-Jan-04
CNX METAL SHORT
57.85
2008-Jan-04
CNX MNC SHORT
6.54
2015-Mar-12
CNX NIFTY SHORT
9.80
2015-Mar-03
CNX PHARMA SHORT
15.29
2015-Apr-08
CNX PSE SHORT
25.24
2008-Jan-04
CNX REALTY SHORT
90.30
2008-Jan-14
Banks and pharma down more than 15% from its April peak, Nifty 10% and MNC 7%…

Correlation Update 06.06.2015

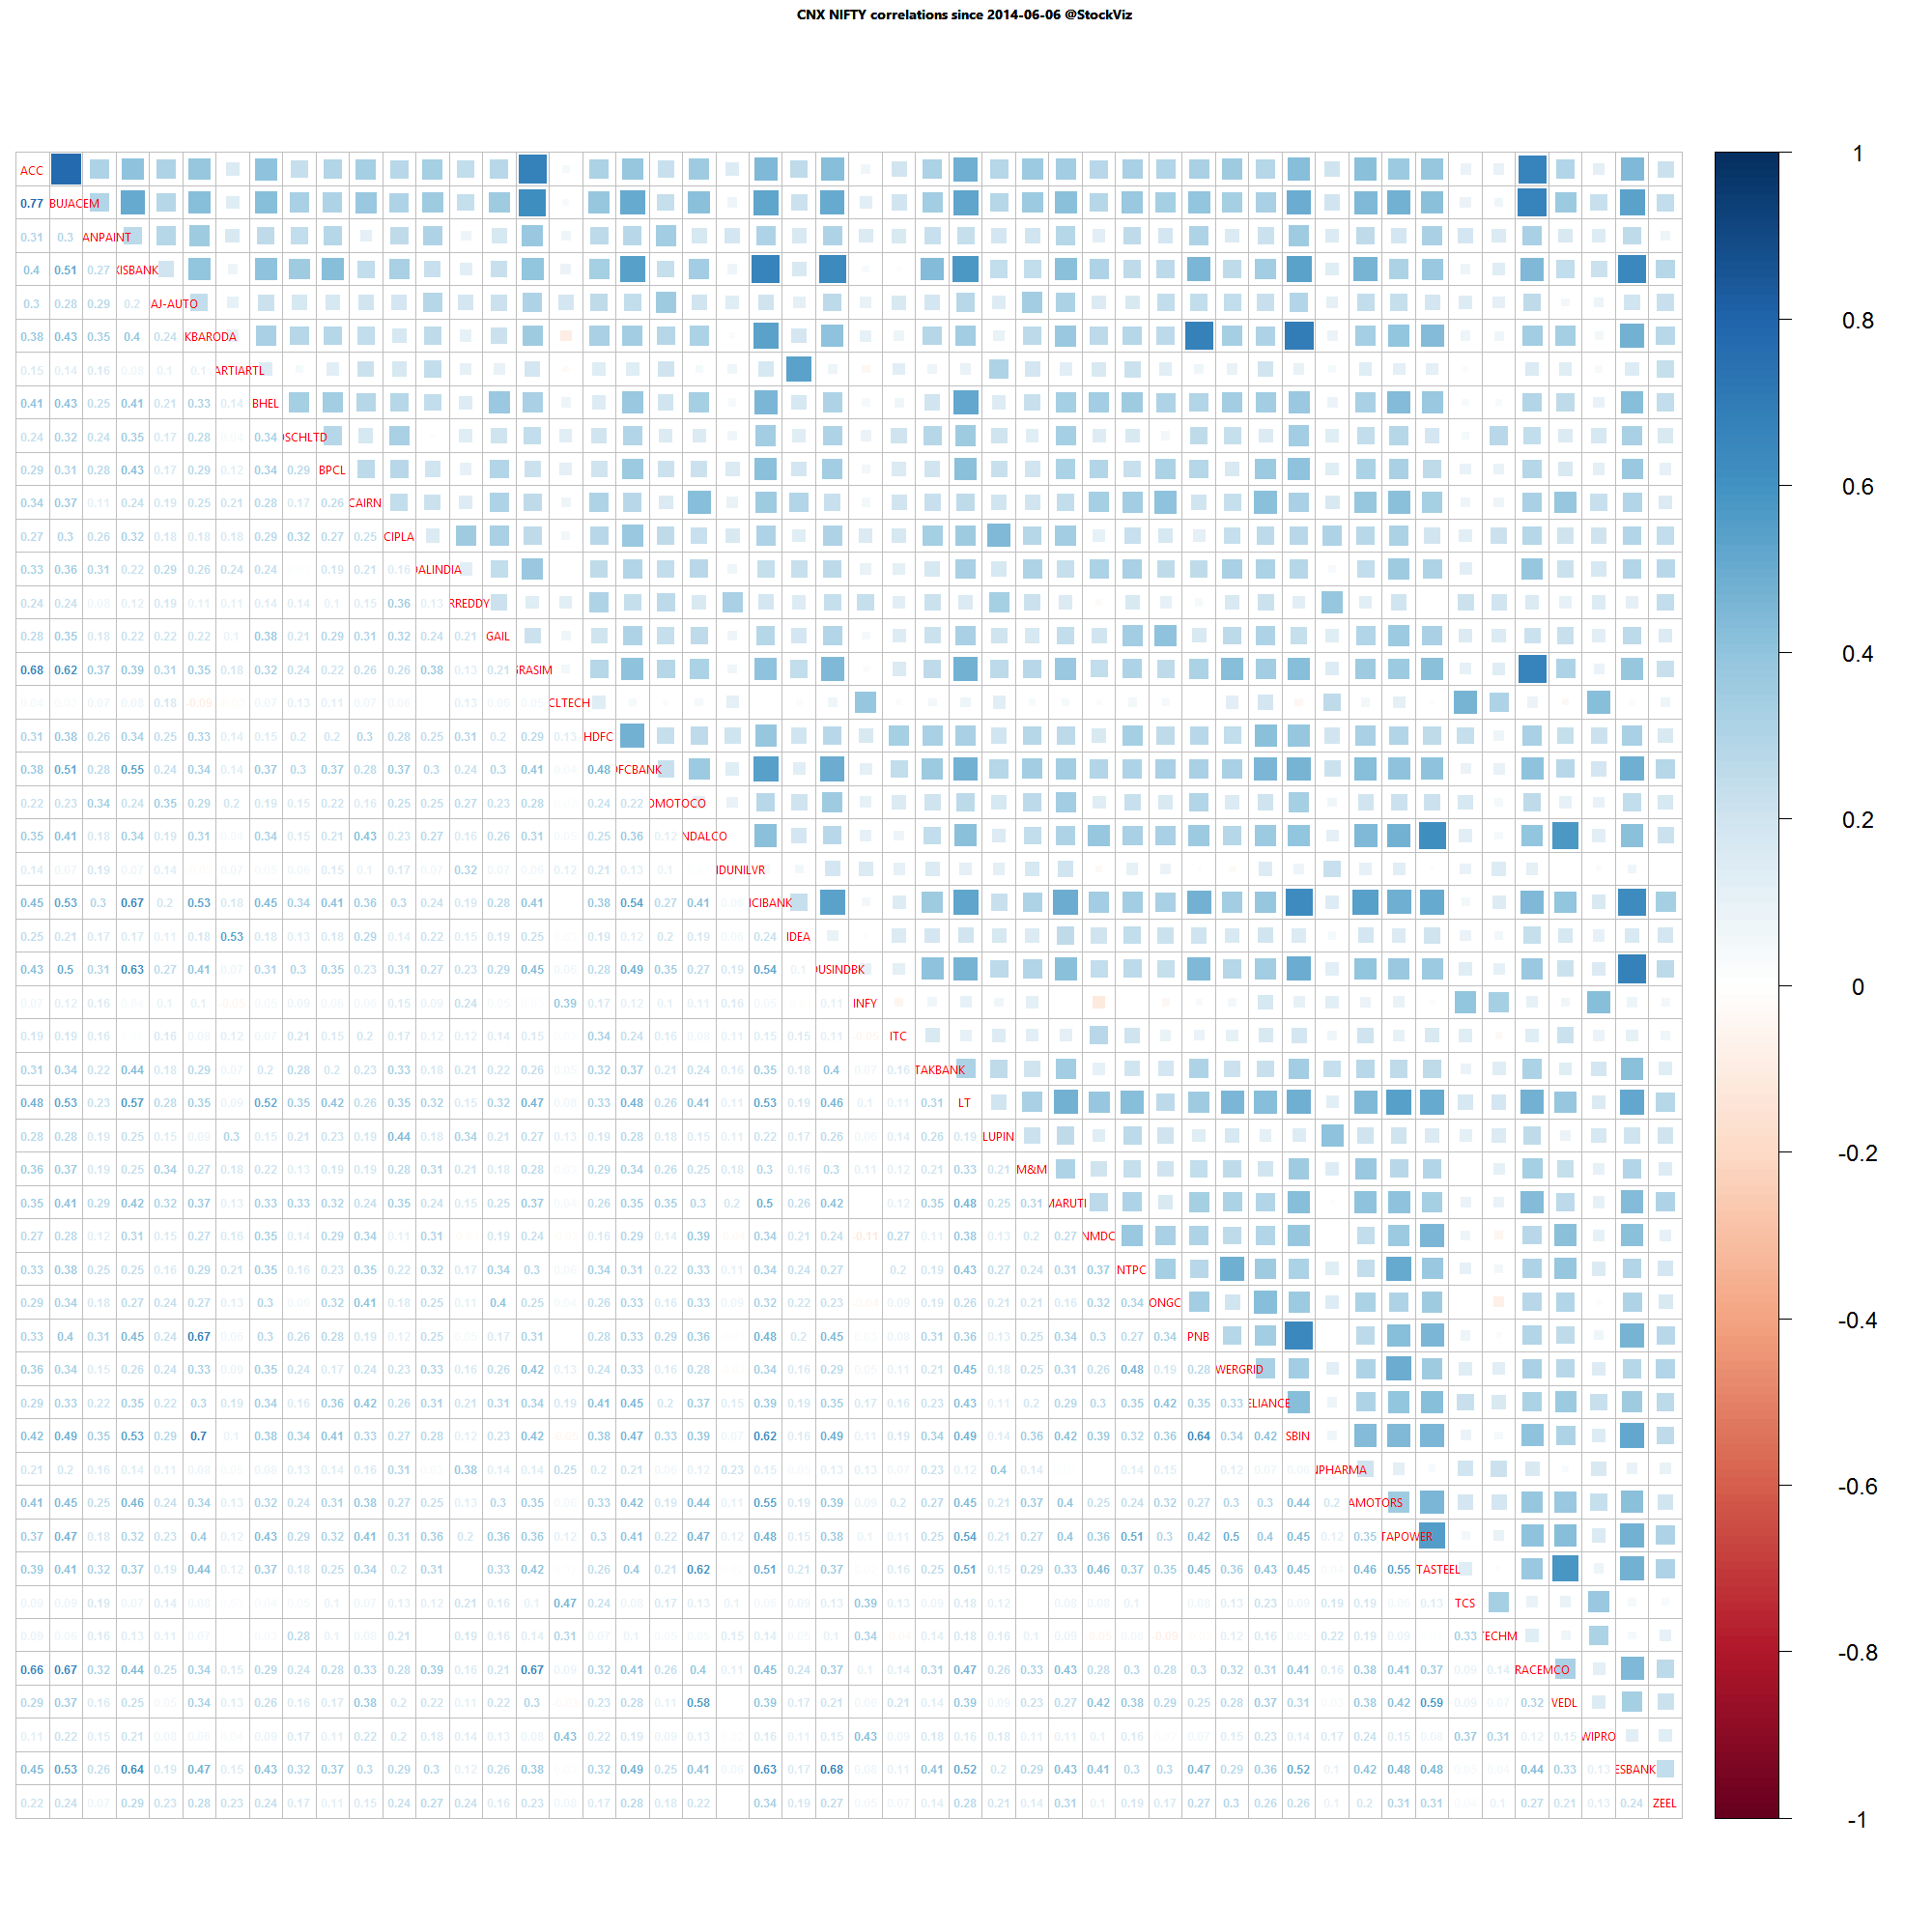
Nifty one year daily return correlations

Nifty one year daily return correlations

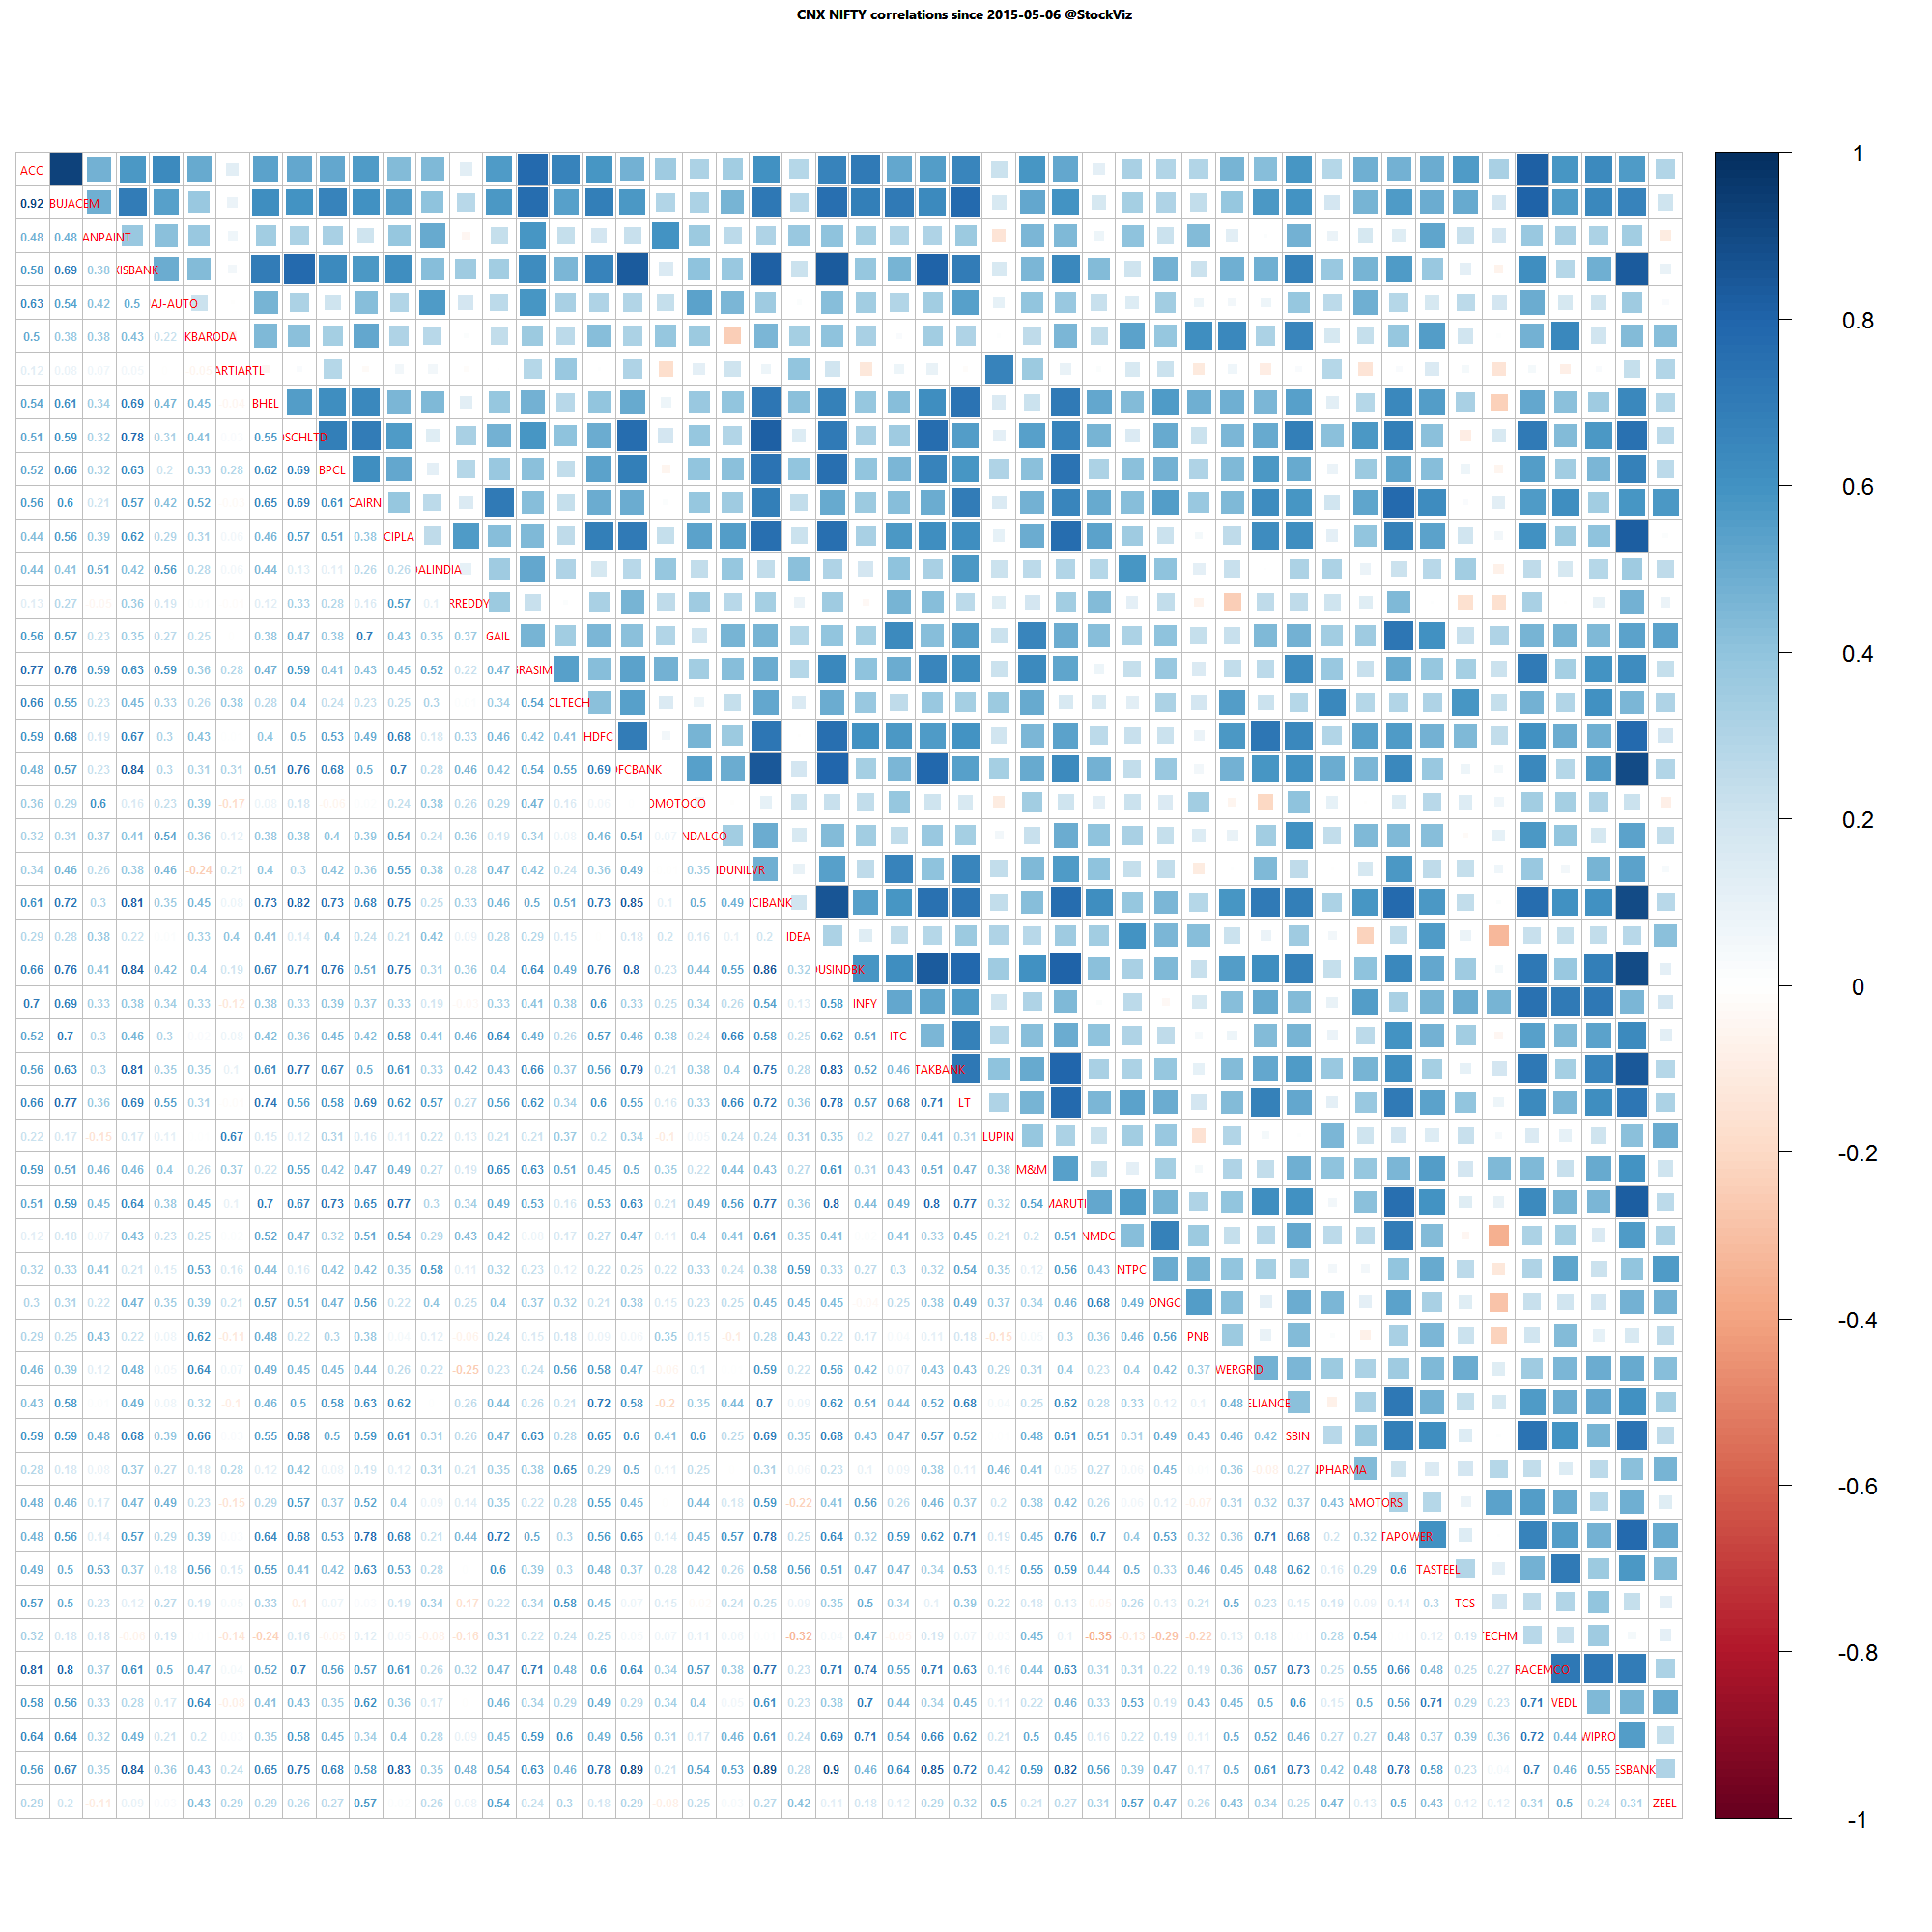
Nifty one month daily return correlations

Nifty one month daily return correlations

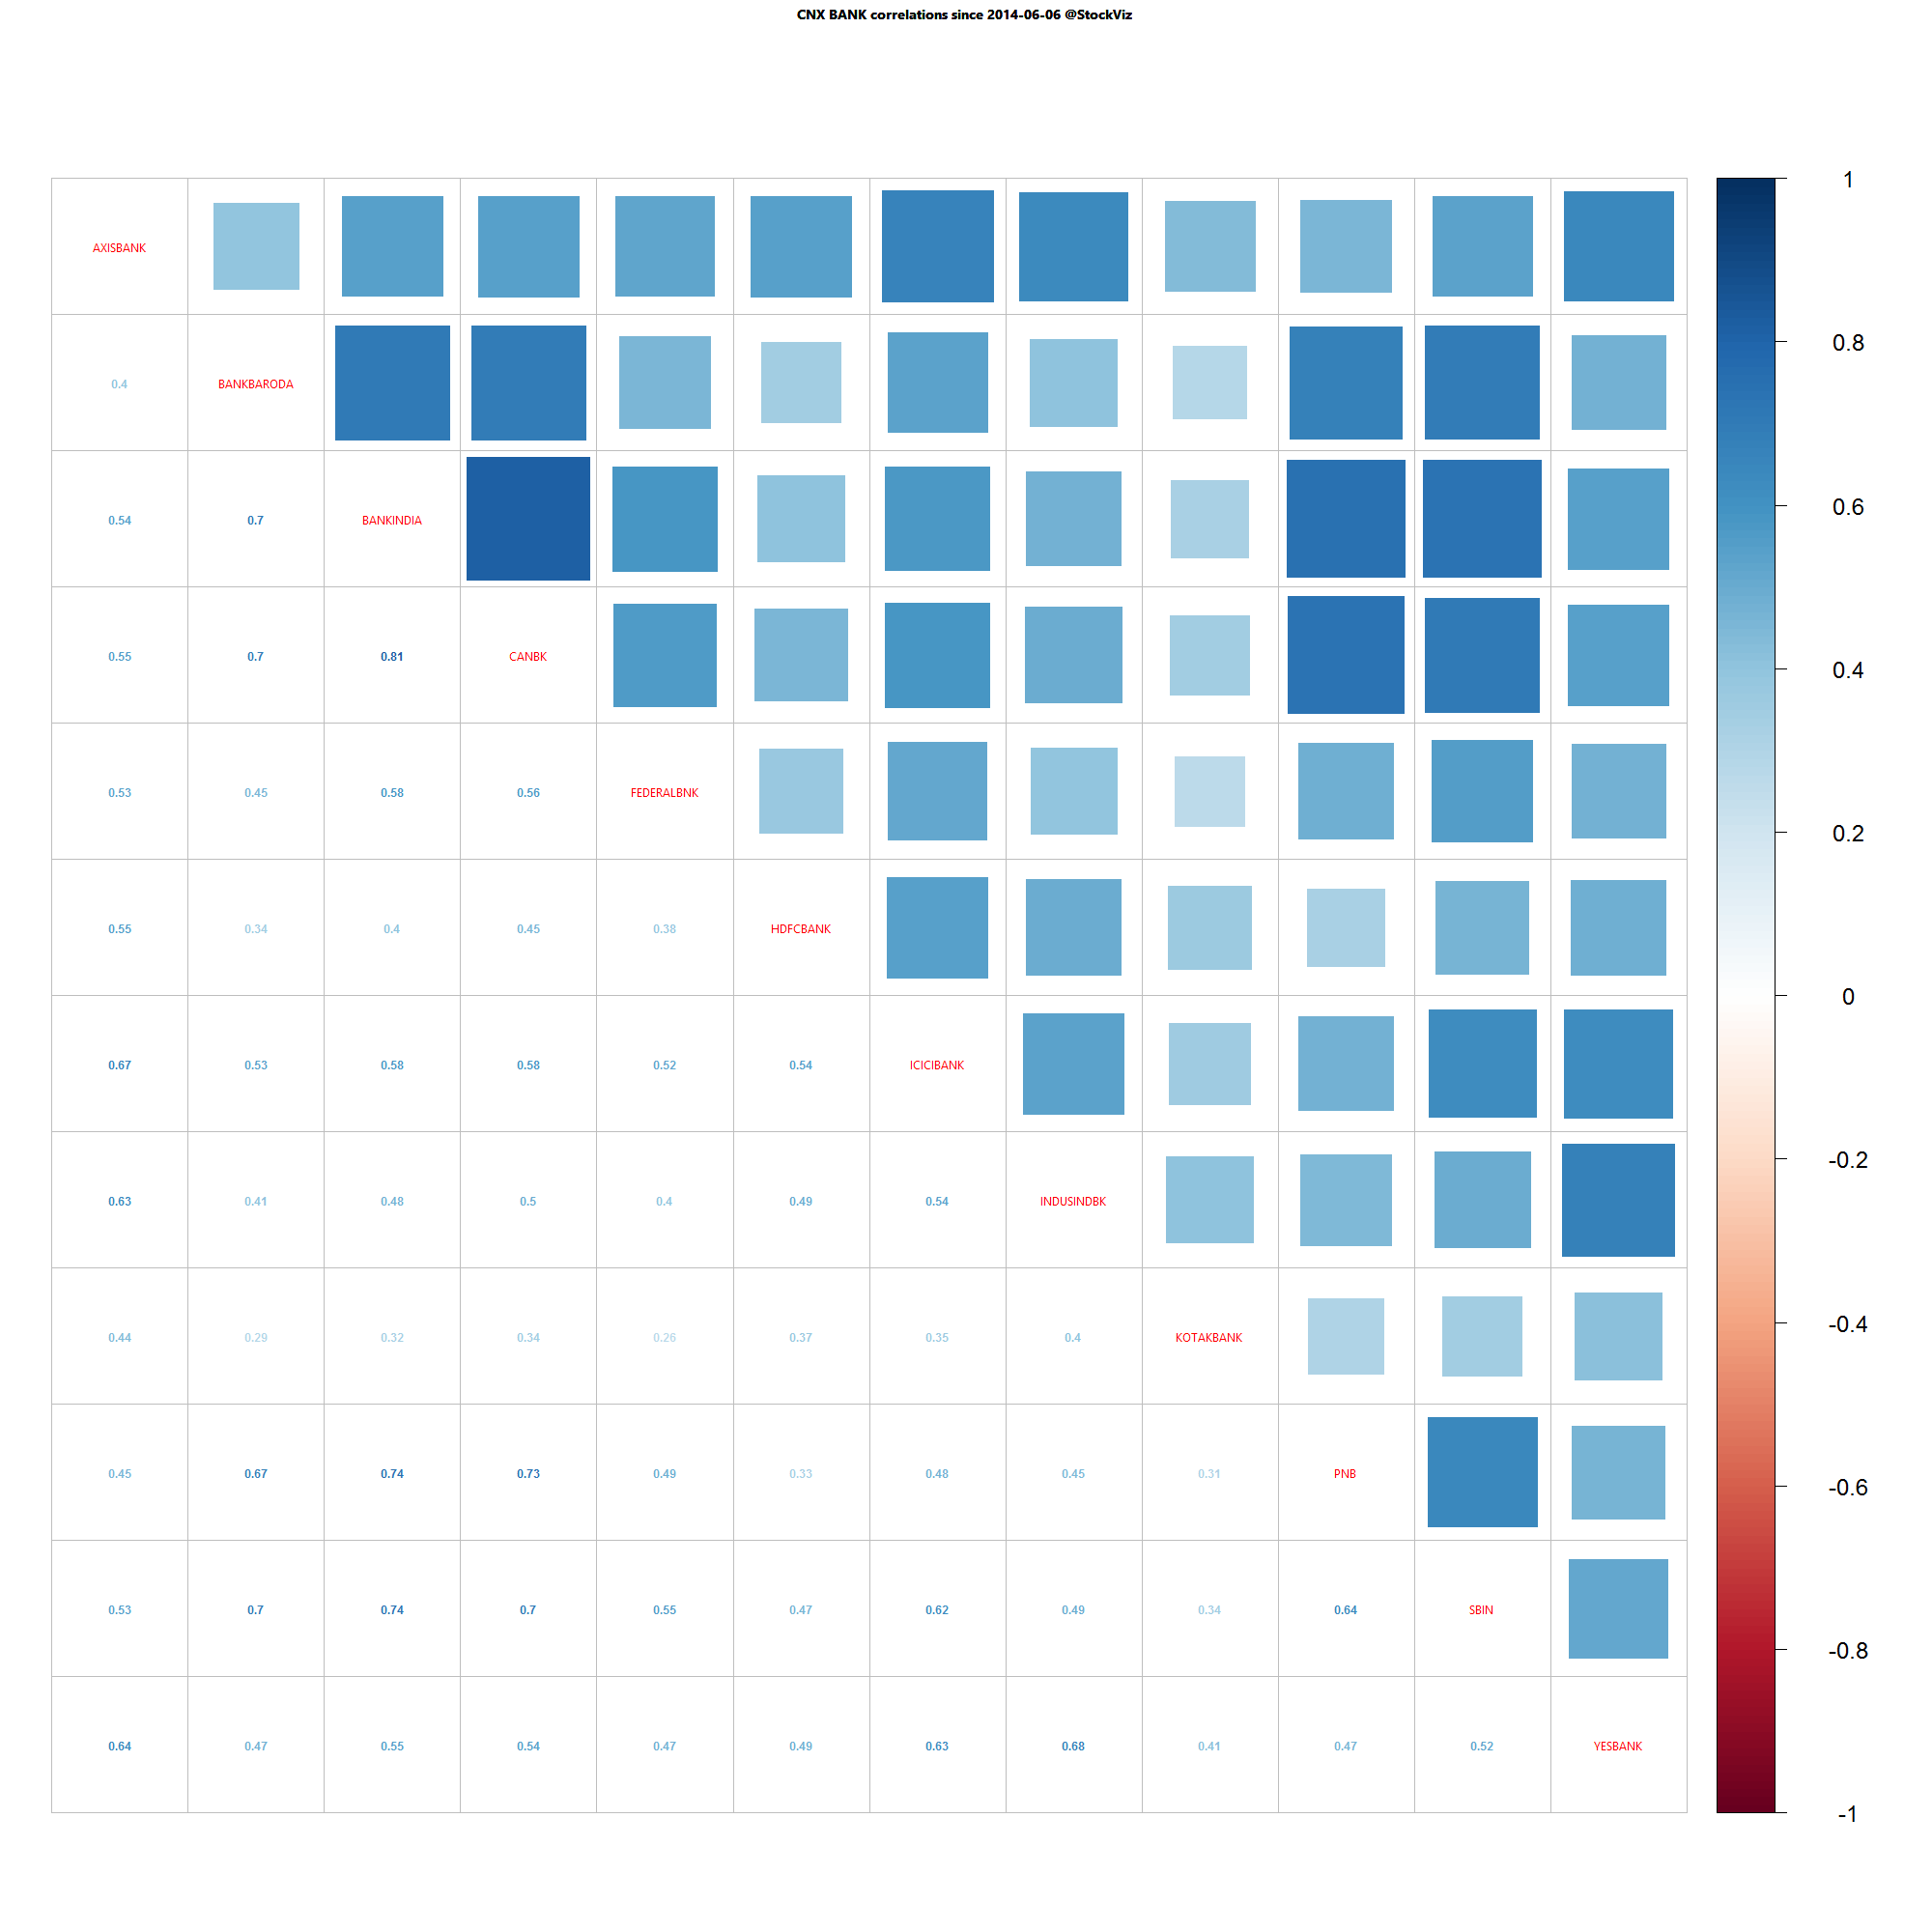
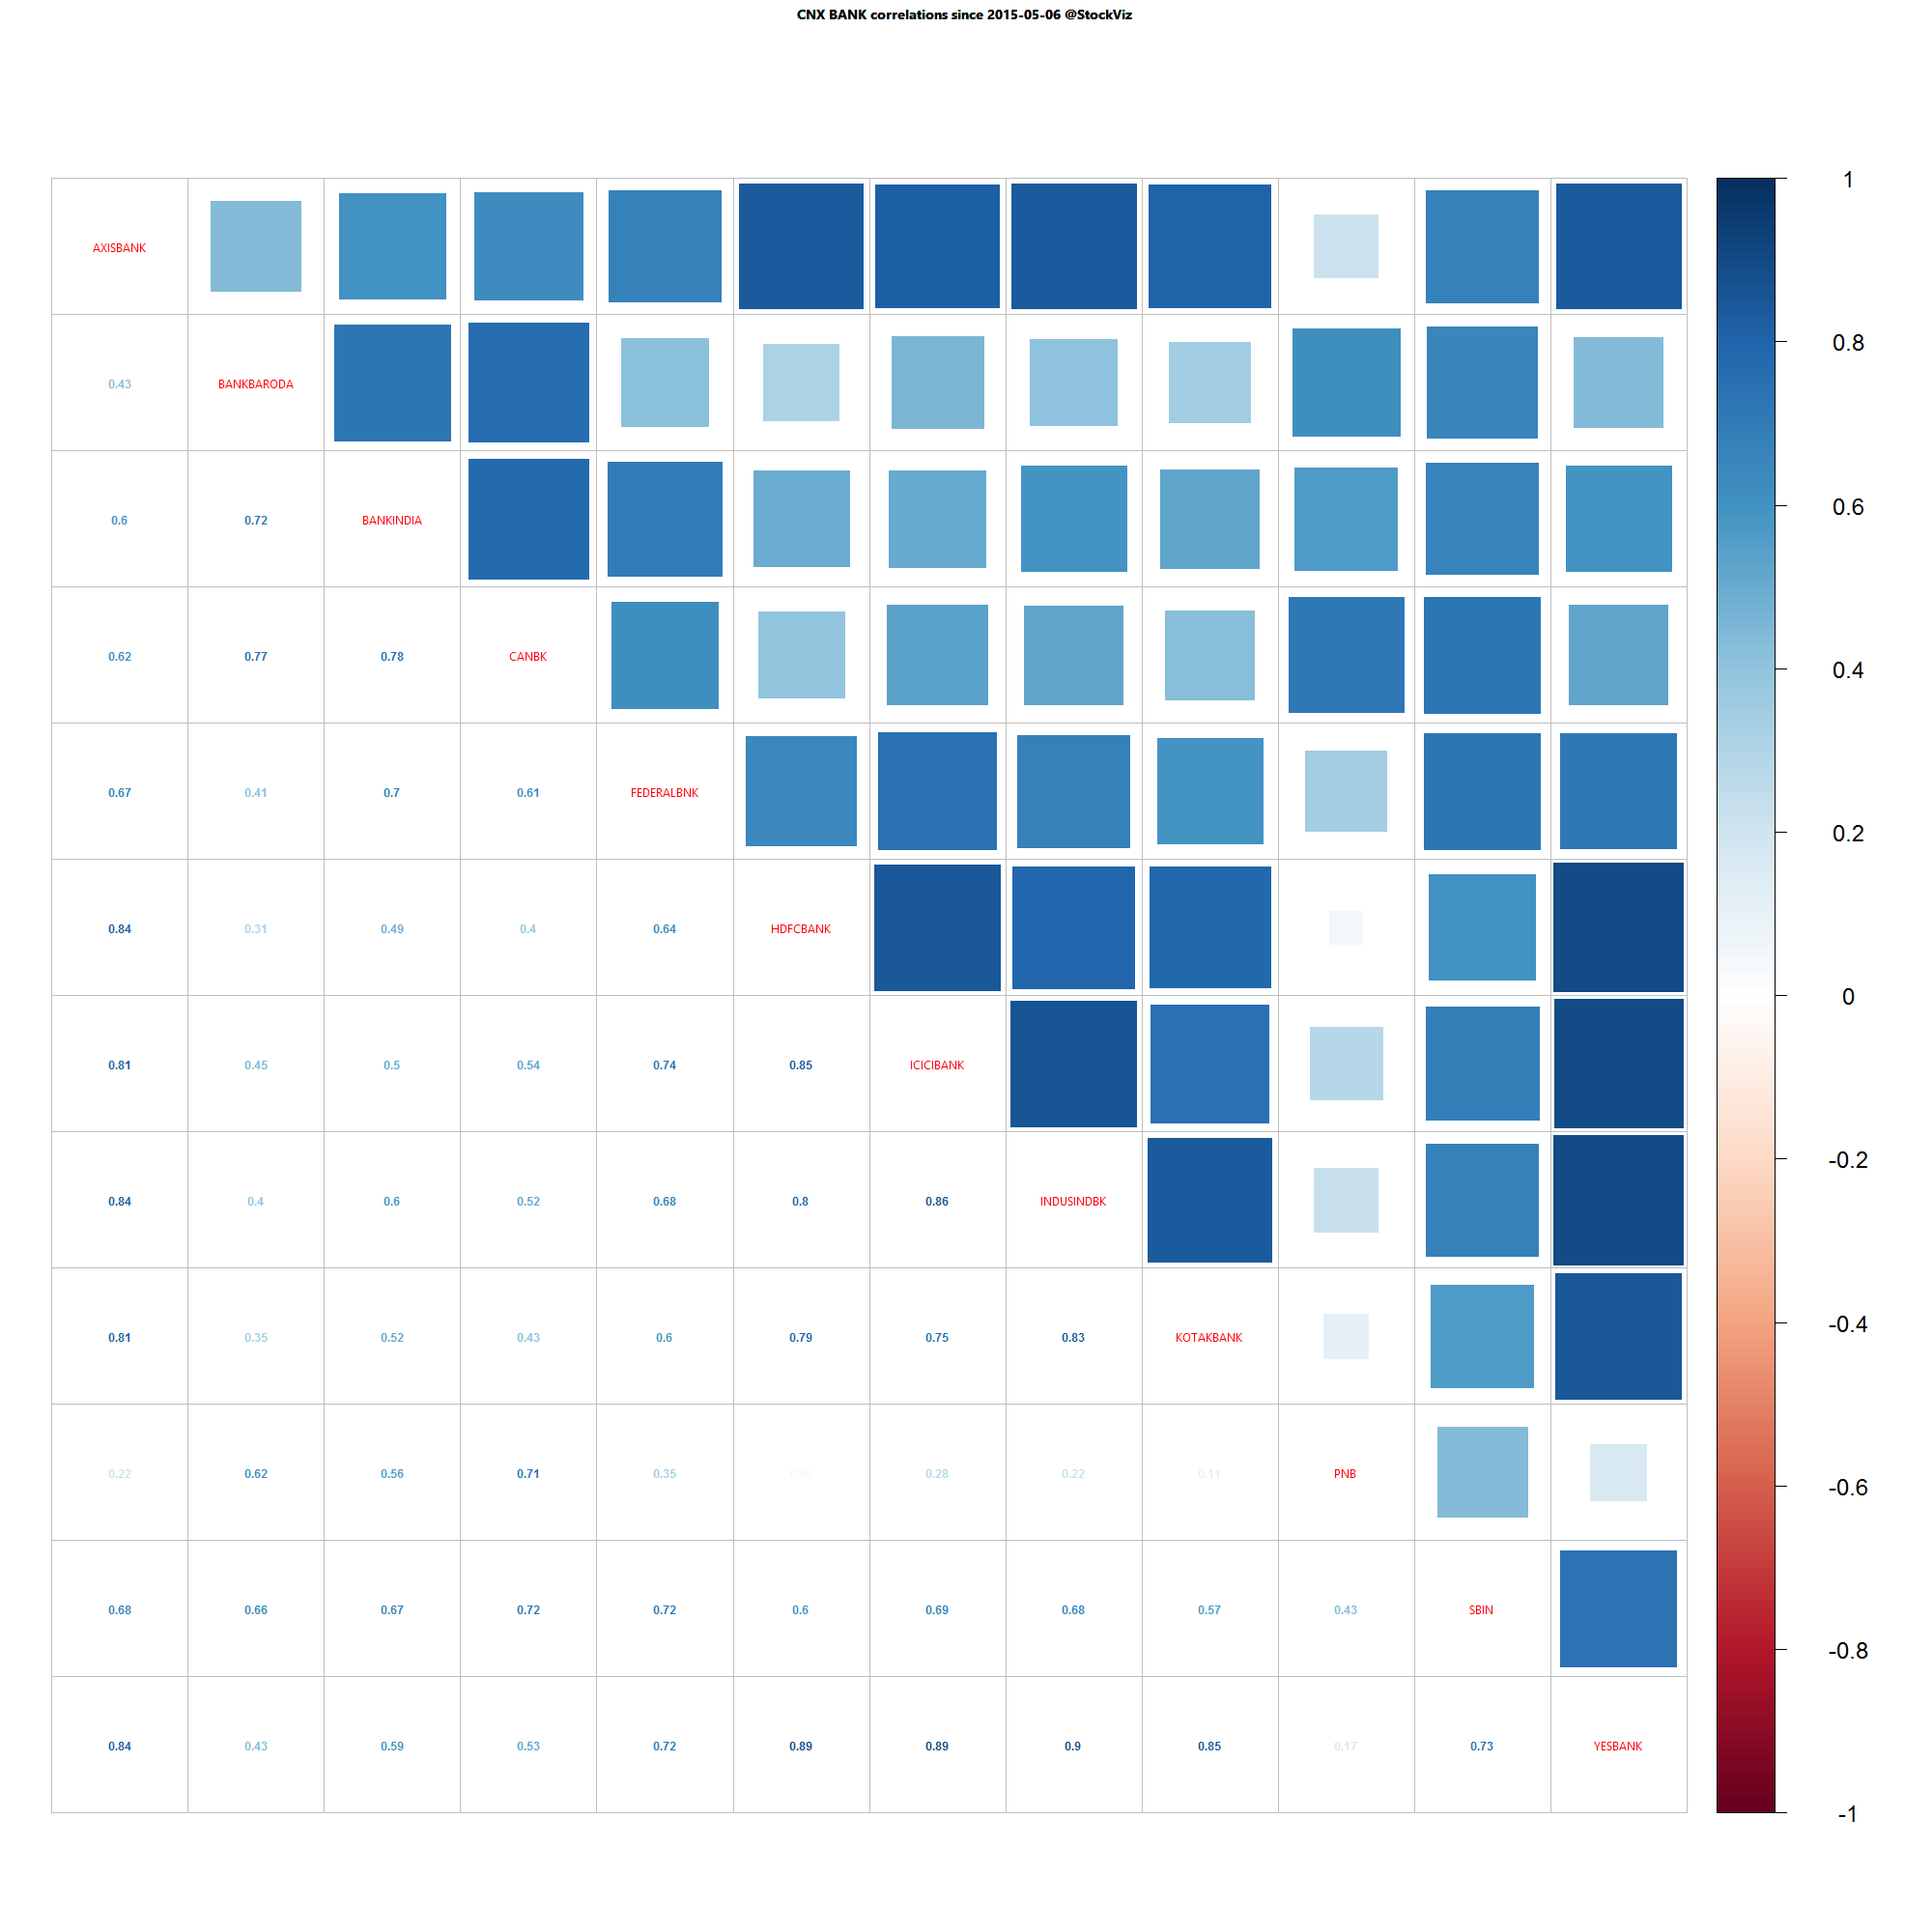
Bank Nifty one year daily return correlations

Bank Nifty one year daily return correlations

Bank Nifty one month daily return correlations

Bank Nifty one month daily return correlations

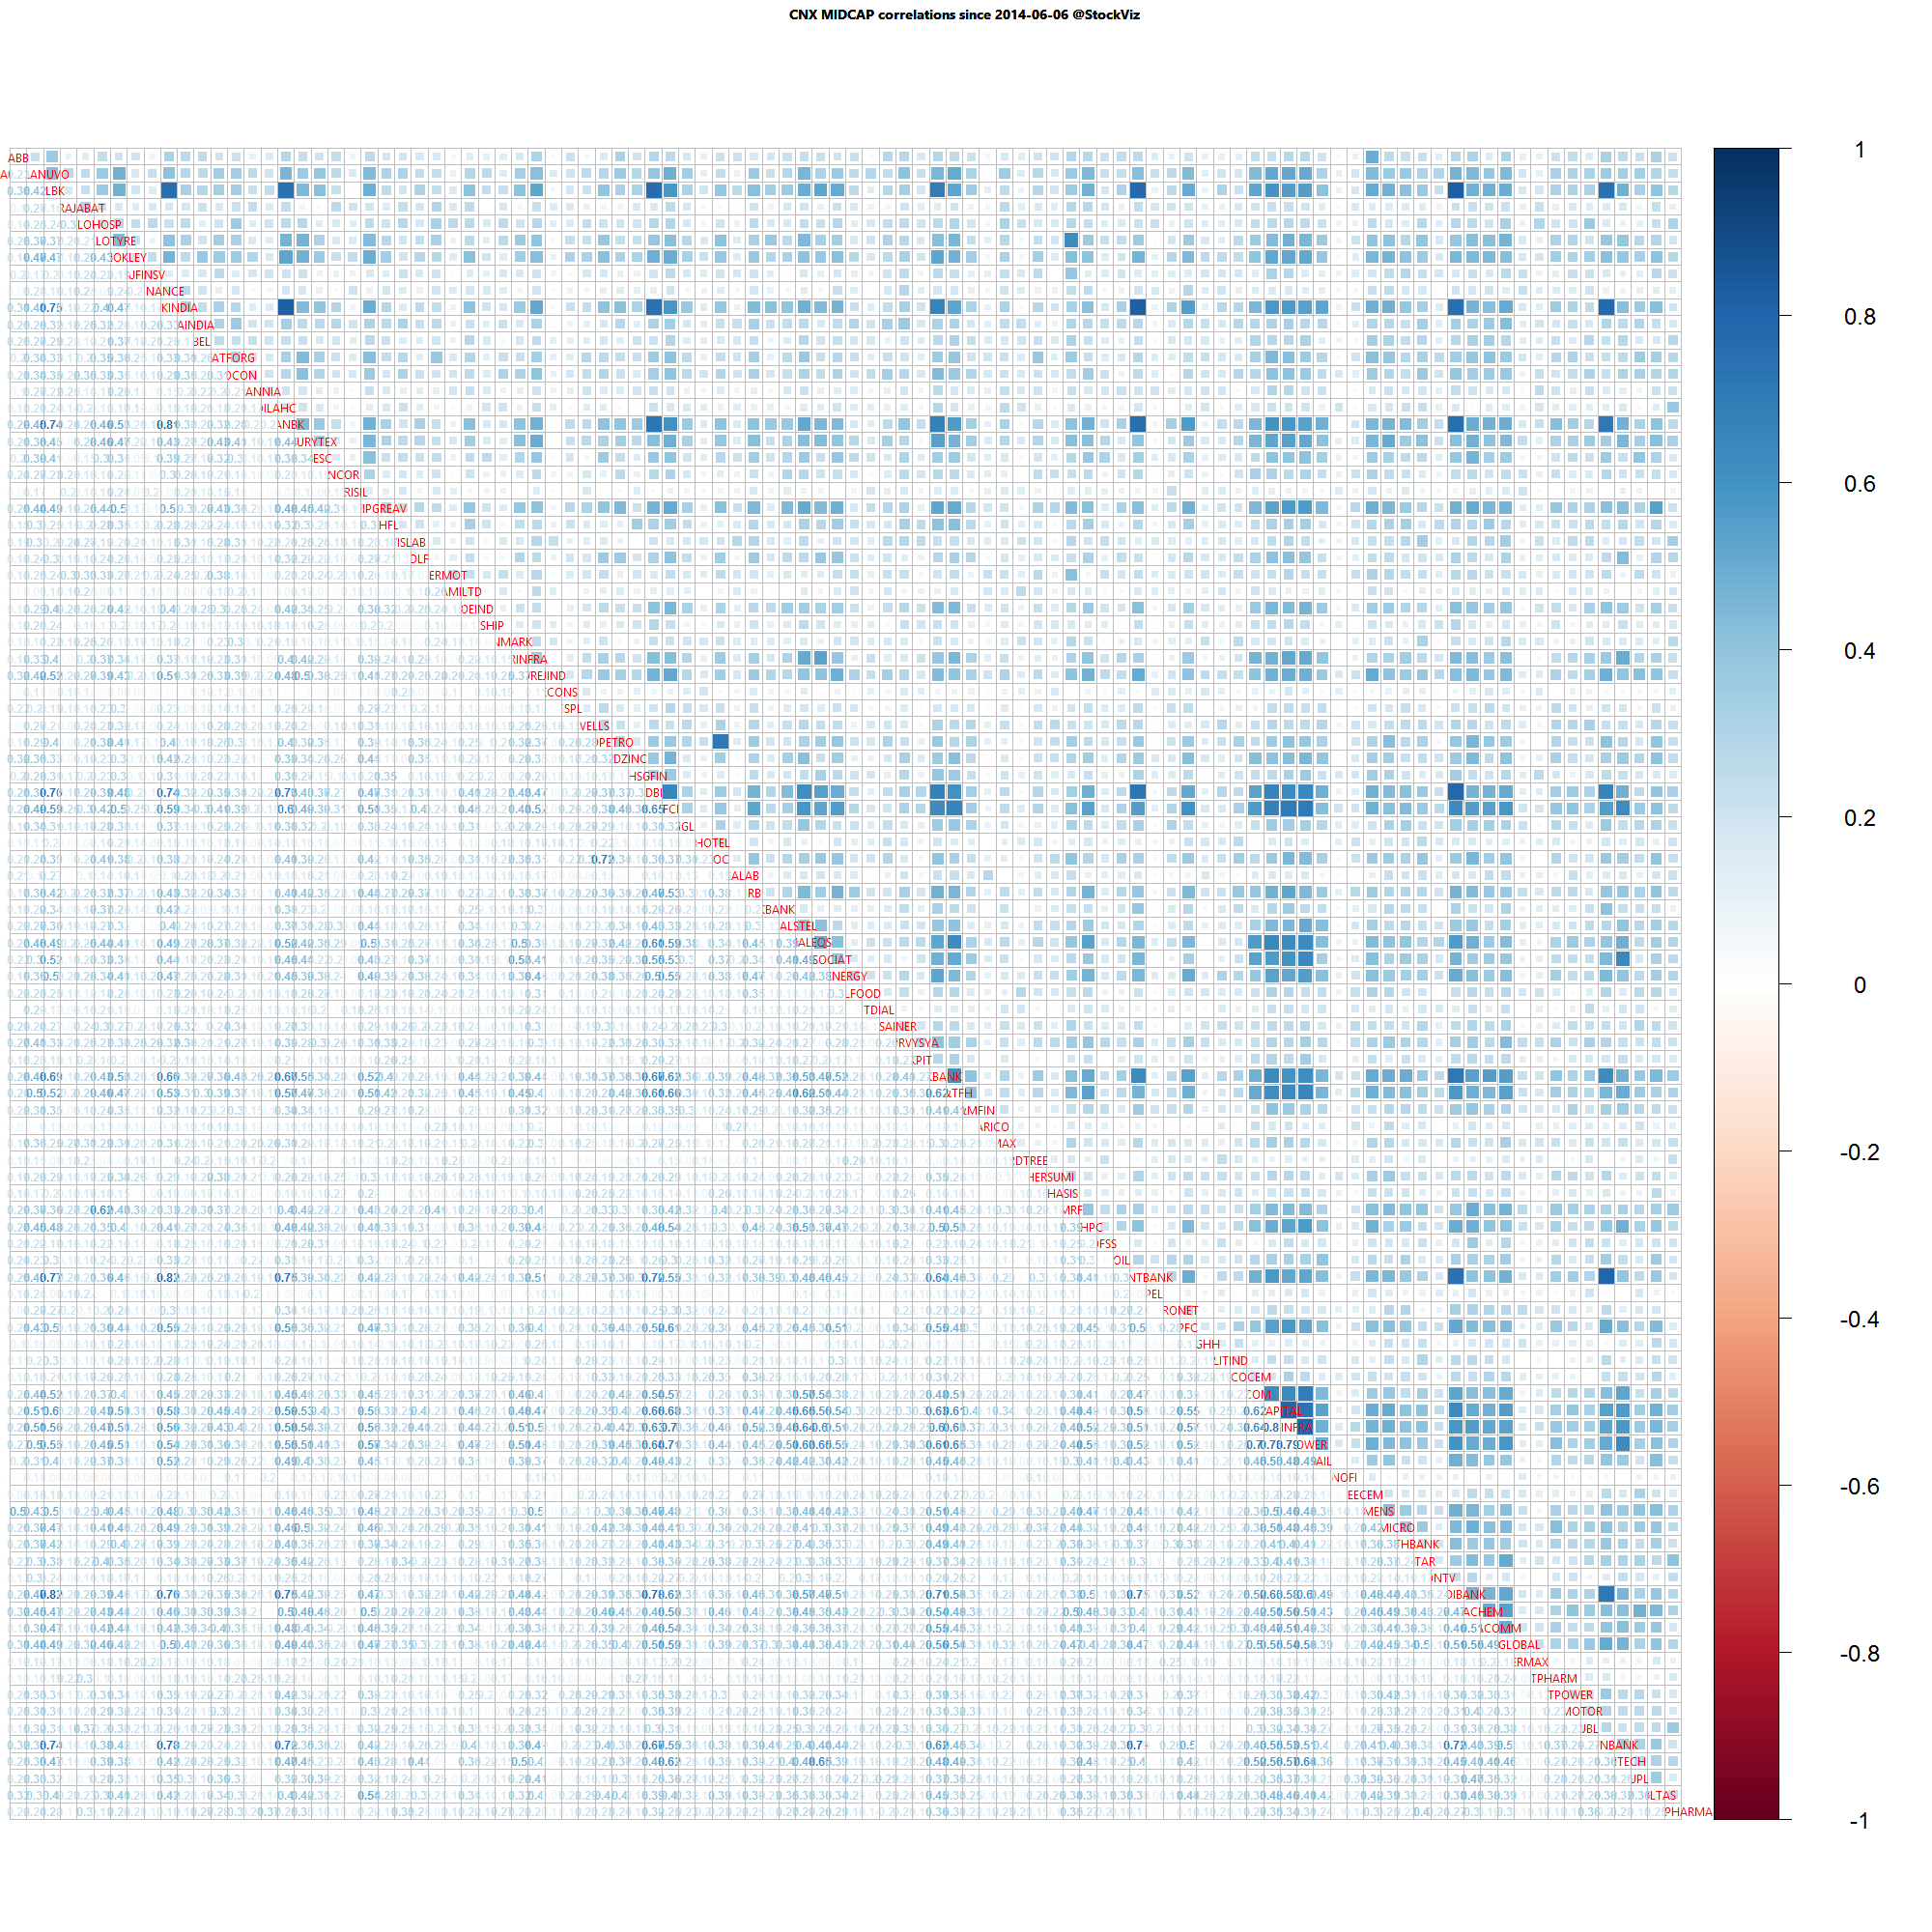
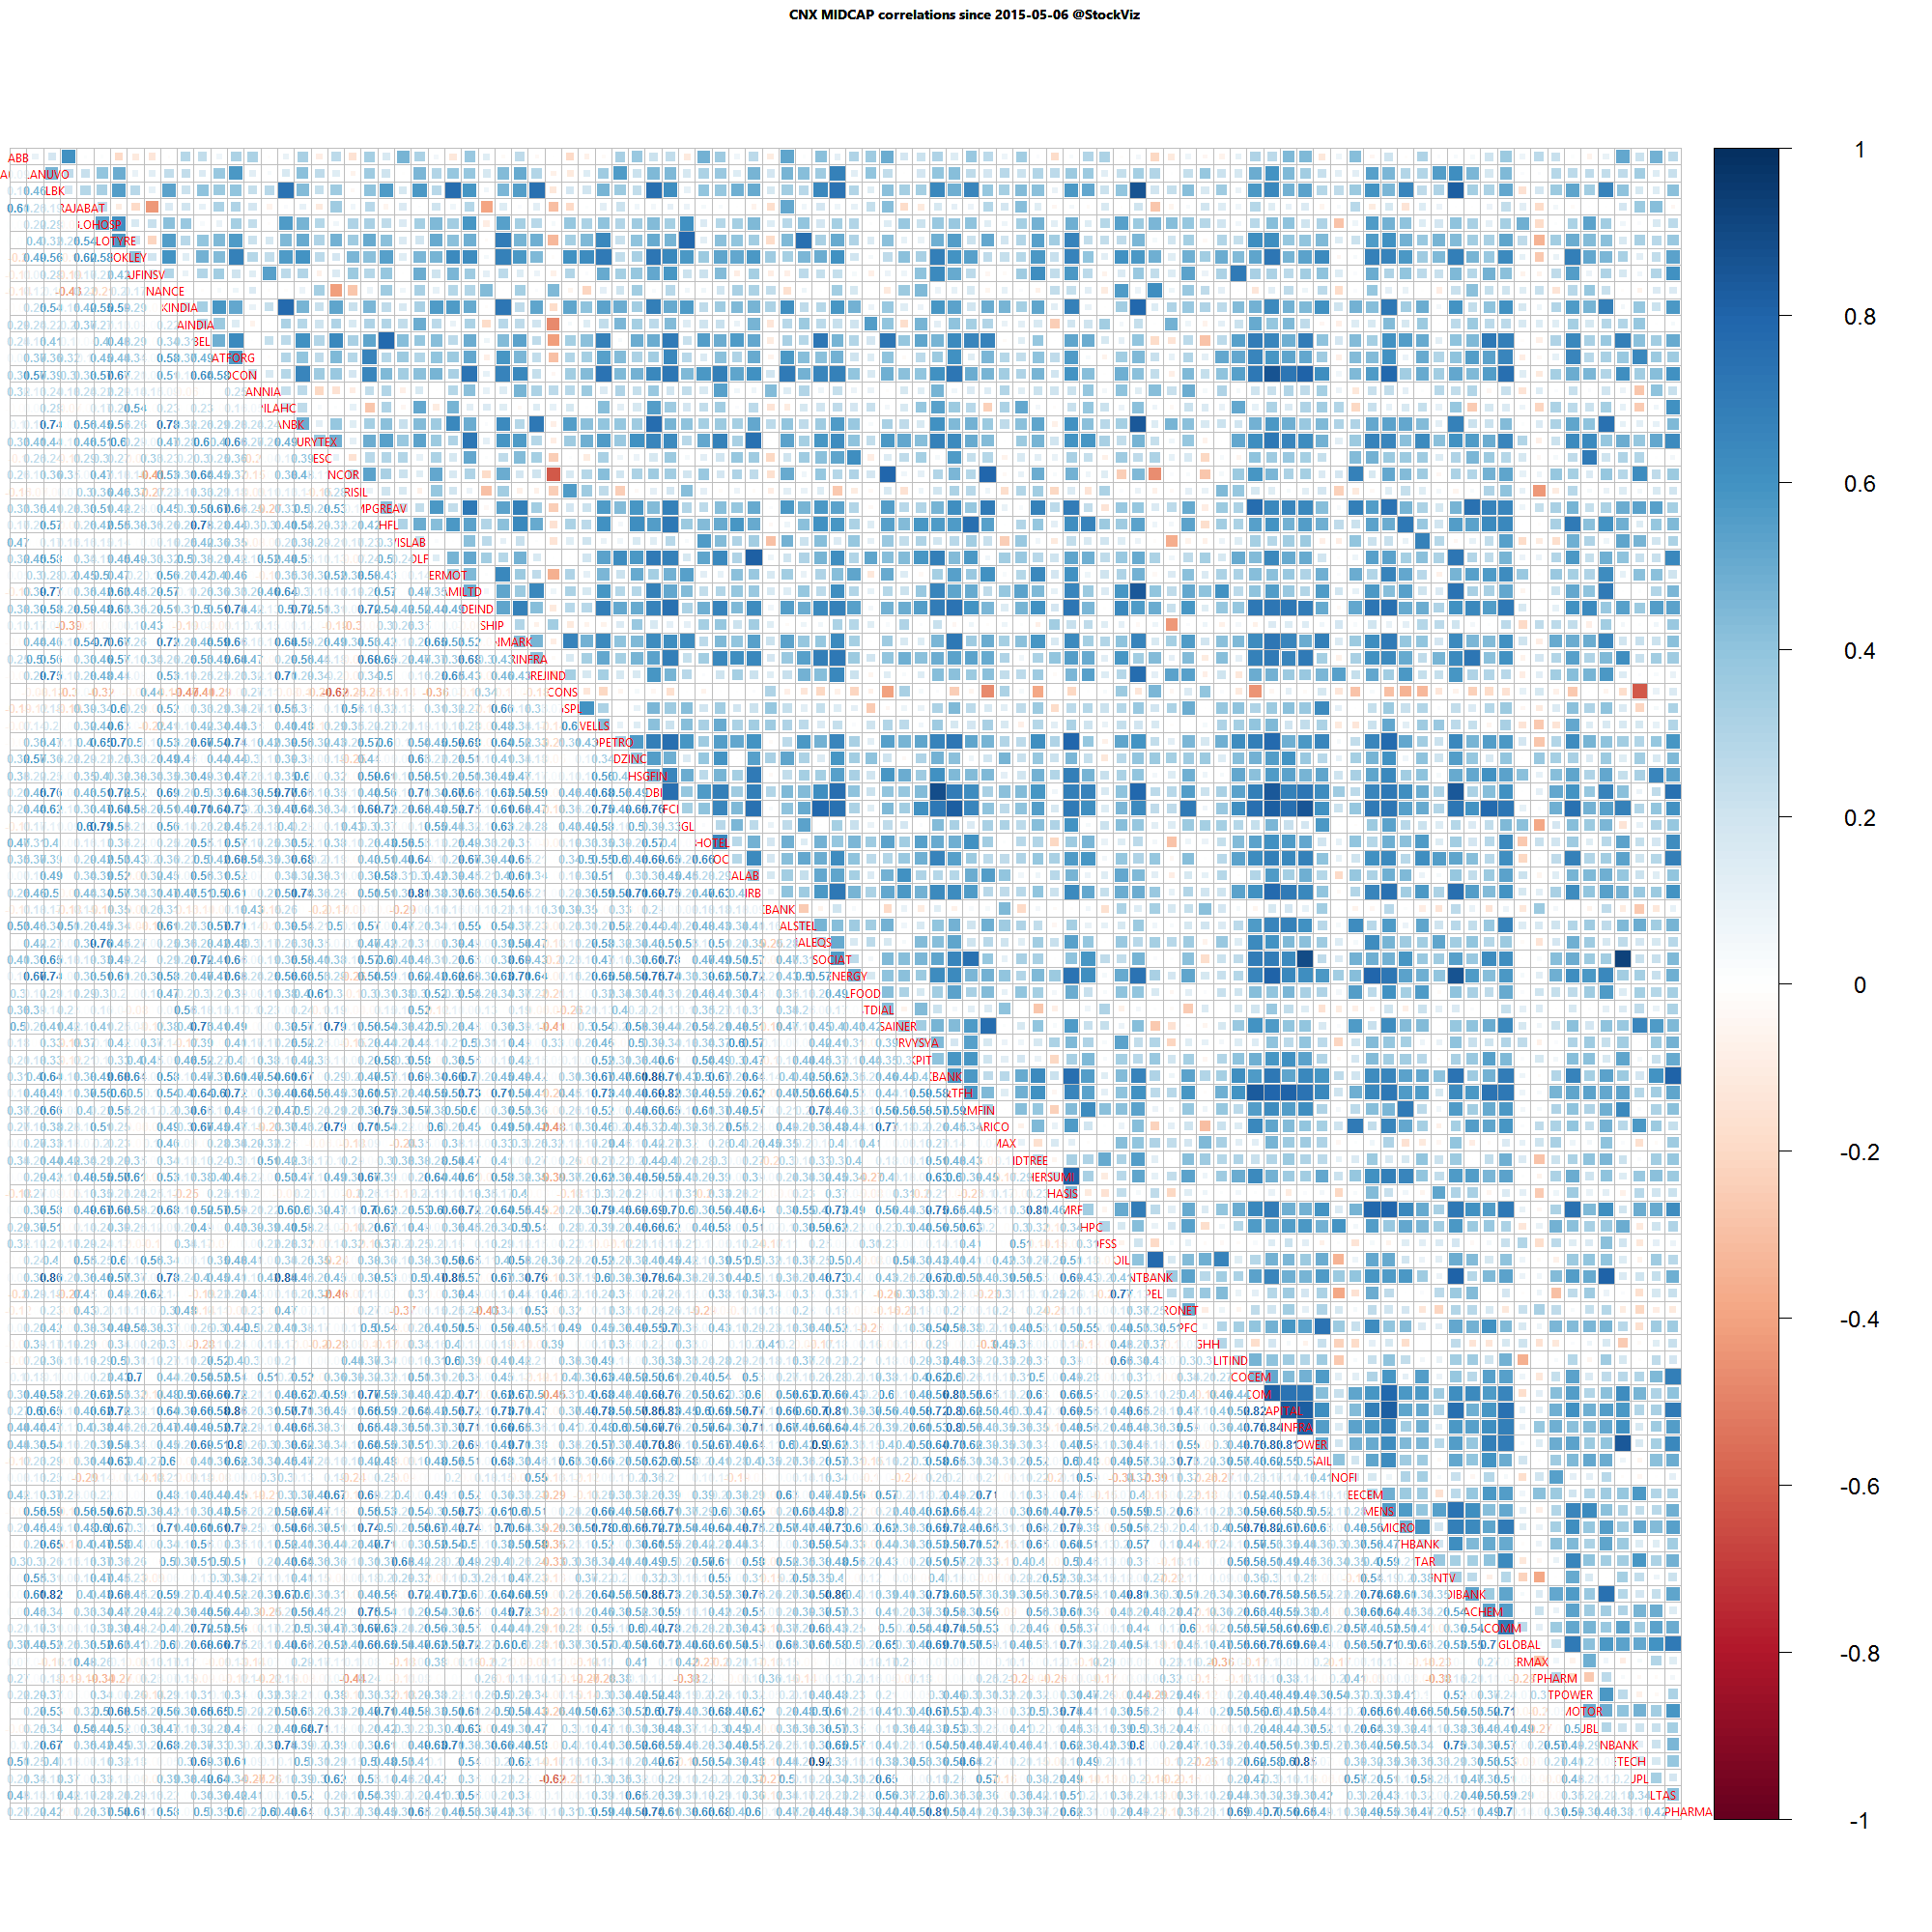
Midcap one year daily return correlations

Midcap one year daily return correlations

Midcap one month daily return correlations

Midcap one month daily return correlations

A lot of thick blue squares mean that positive correlations are high. Red squares mean negative correlations are high. Whites are the doldrums.

The Problem with Balanced Funds

Returns vs. Volatility

Balanced funds are those that invest in both stocks and bonds. The exact allocation is up to the fund manager. For example, the Tata Balanced fund is right now 22.85% in bonds and the rest in equities, according to Morningstar.

tata balanced asset allocation

Balanced funds are pitched as having lesser risk than equity-only funds. But what investors gain in lesser volatility, they give up on lower returns and higher fees.

Tata Balanced vs. ICICI Pru. Value Discovery

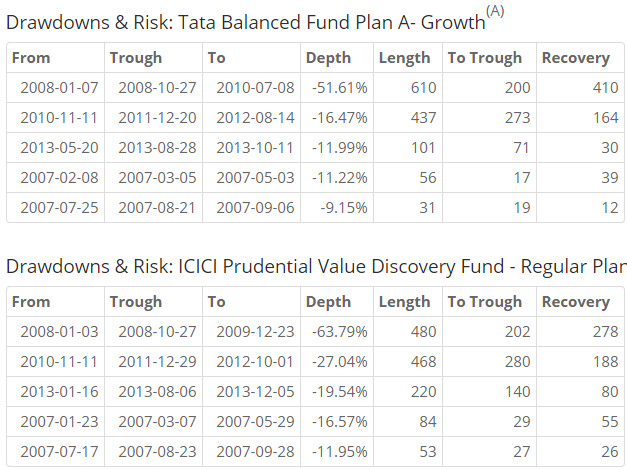
Between 2007-01-02 and 2015-06-02, Tata Balanced Fund has returned a cumulative 235.97% with an IRR of 15.48% vs. ICICI Prudential Value Discovery Fund’s cumulative return of 316.55% and an IRR of 18.47%download

Compare the drawdowns:

drawdowns tatas vs icici

For the moderate-risk taking investor who is typically attracted to balanced funds, a 16% drawdown hurts just as much as a 27% drawdown.

When it comes to fees, Tata’s has an expense ratio of 2.91% vs. ICICI’s 2.34%. Is the extra 50bps worth the safety offered?

HDFC Balanced Fund vs. ICICI Pru. Value Discovery

It is a similar deal with HDFC’s Balanced fund as well: lower returns (IRR: 15.24%) and no escape from double-digit drawdownsdownload

Conclusion

The sales-pitch for balanced funds focus on the investors availability heuristic where people tend to heavily weigh their judgments toward more recent information, making new opinions biased toward that latest news. Ever since the market corrected in March a growing flock of blogs and articles started pitching balanced funds. But before you fall for the marketing pitch, take a step back and ensure that you are not giving too much away for perceived safety.