SSL (Secure Sockets Layer) is the standard security technology for establishing an encrypted link between a web server and a browser. This link ensures that all data passed between the web server and browsers remain private and integral. SSL is an industry standard and is used by millions of websites in the protection of their online transactions with their customers. (ssl.com)
You may have noticed the ‘lock’ icon in your browser address bar followed by ‘https://’ – this indicates that the communication between your browser and the StockViz server is encrypted.
Mixed content
Although everything that is coming from StockViz is encrypted, we depend on external vendors who do not support SSL. Besides, all of our old blog post images are un-encrypted. When both encrypted and un-encrypted data is supplied to your browser, you will get a “mixed content” warning.
You can ignore this warning – both Chrome and Firefox don’t make a big deal out of it. However, Internet Explorer users may face annoying warning messages.
Internet Explorer
IE users will need to go to Internet Options -> Security -> Custom Level -> Display mixed Content and select ‘Enable’
If you run into any issues, send us a WhatsApp or email us.
Excess winter snow-fall in the Himalayas lead to floods in Bangladesh during spring. If we know that that there was excess snow-fall in the Himalayas this season, we can be better prepared to handle the floods four-months from now. This is the idea behind studying lagged correlations.
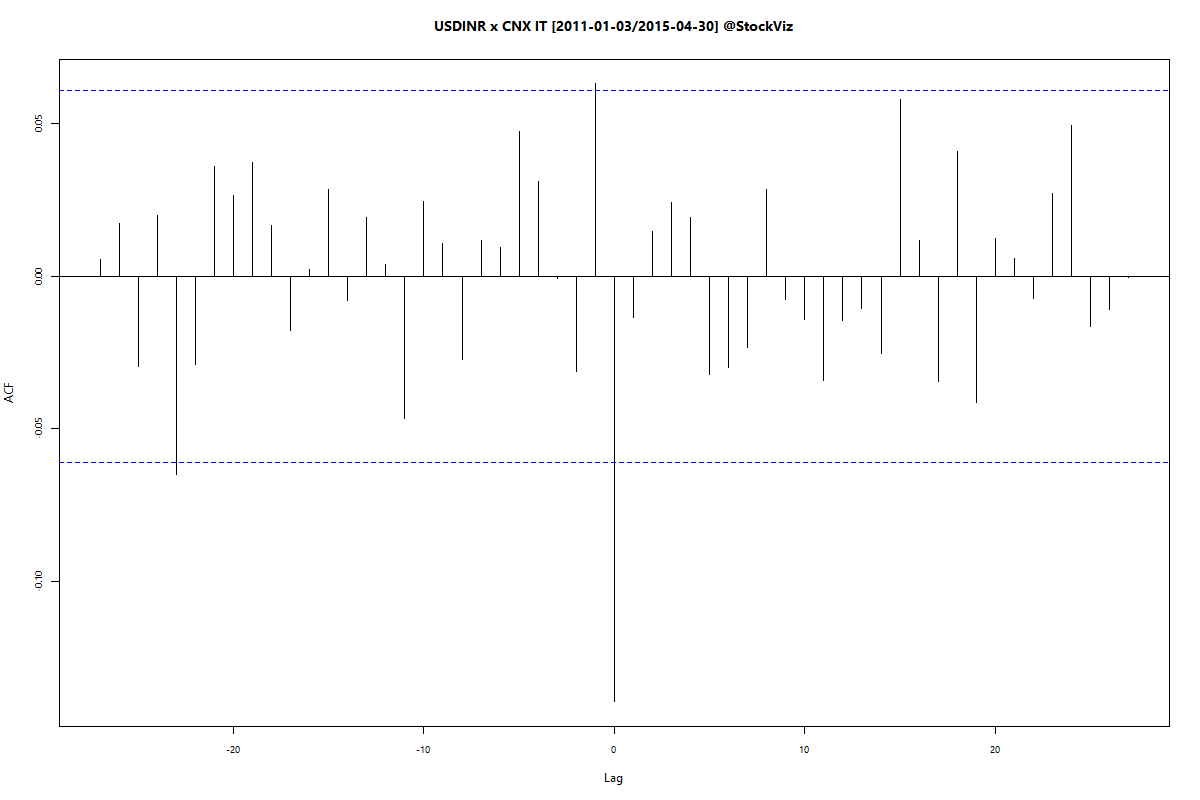
If we took a pair of sector indices and lagged their returns, can we find an index that “leads” an other and profit from it?
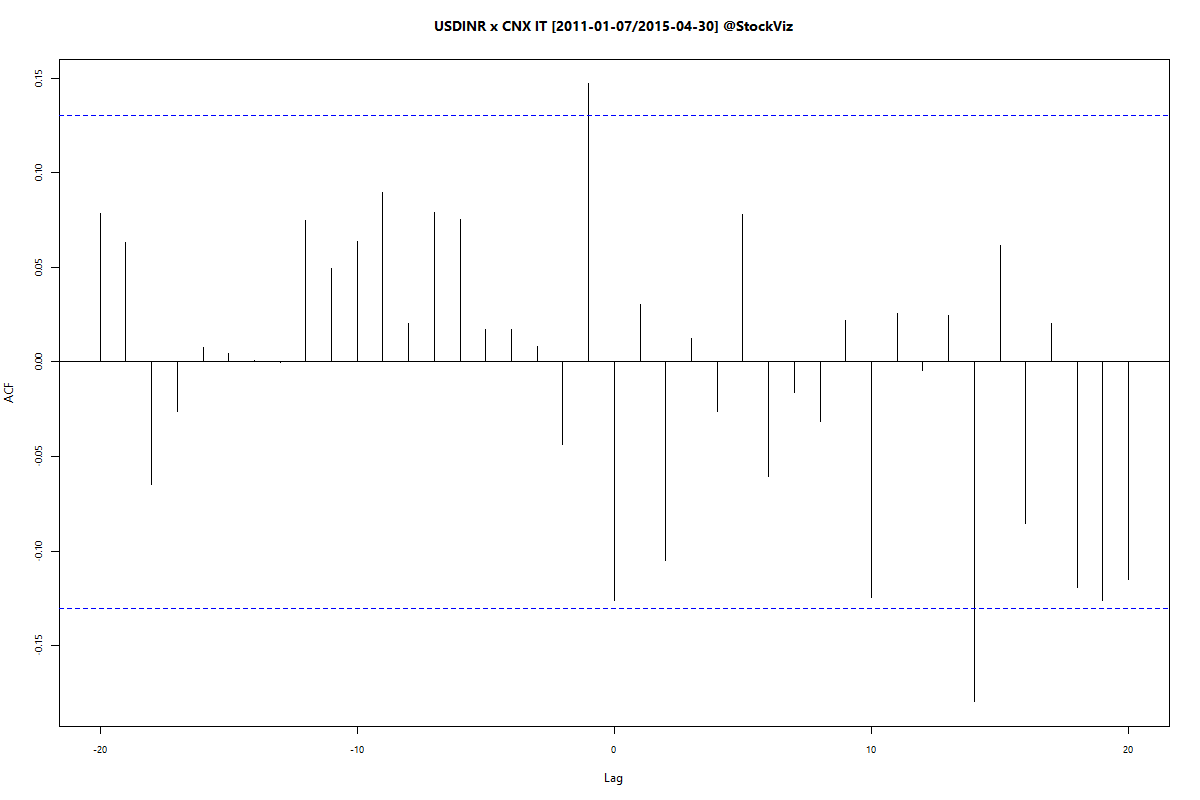
The chart above is called the cross-correlation plot. It shows that there are two lags, 5 and 9, where CNX BANK lags CONSUMPTION. A scatter plot shows how monthly-returns are correlated to each other across different lags and confirms the relationship:
Finding
We found a number of index pairs that lead/follow one another. In addition to the CNX BANK and CNX CONSUMPTION indices above, CNX INFRA and CNX CONSUMPTION, CNX IT and CNX FINANCE, CNX CONSUMPTION and AUTO display this dynamic.
Data mining warning
We cannot draw any conclusion from this “finding.” We mined 20 indices over 5 years to dig these nuggets out. The result is spurious. From a statistical point of view, there is no index that consistently leads or lags another.
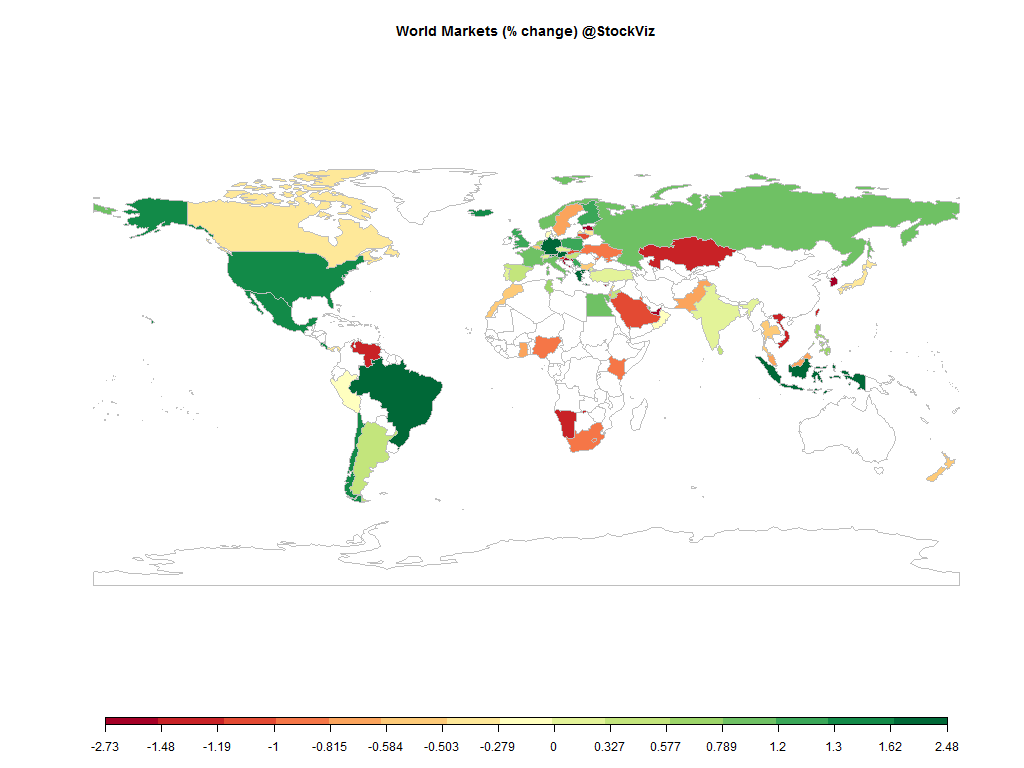
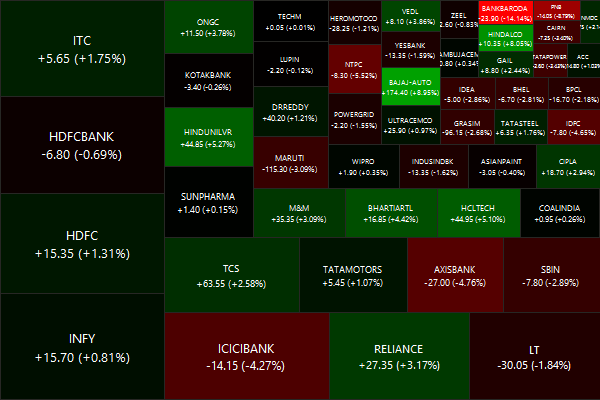
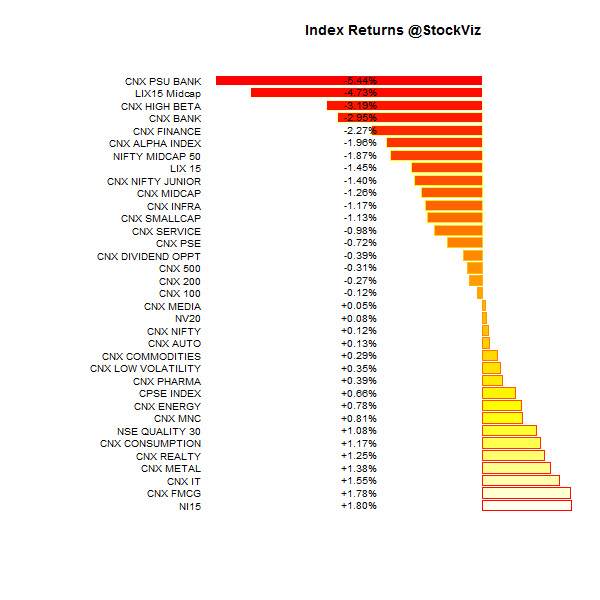
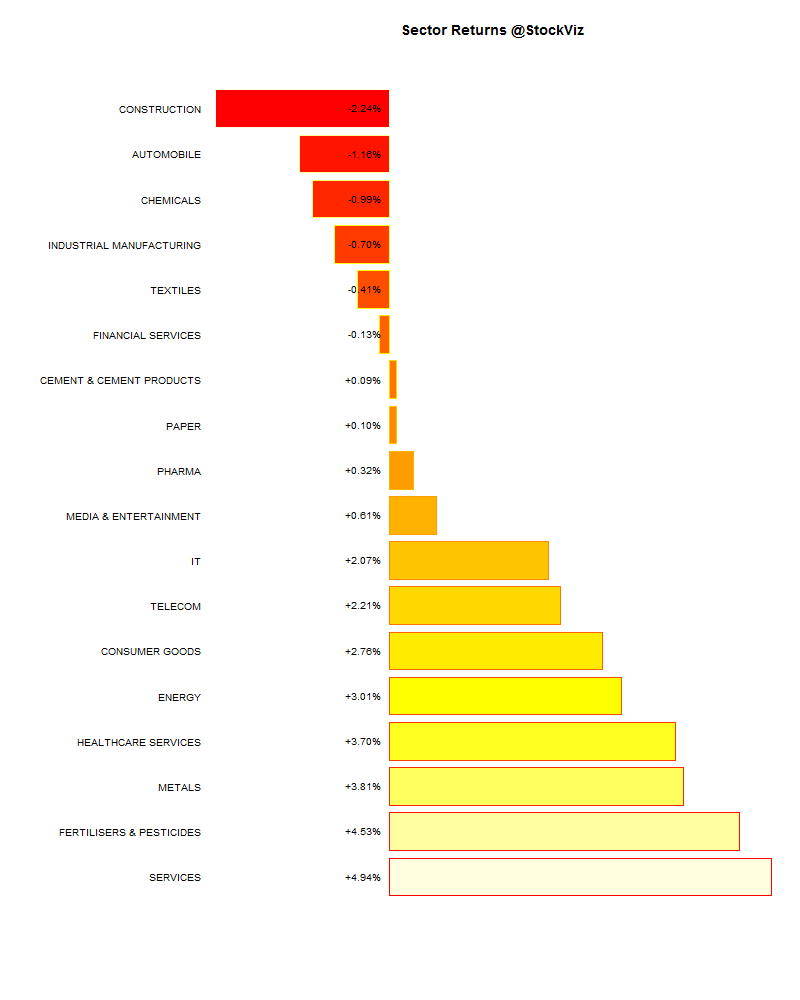
The US Dollar got beat up on Fed’s re-assurance to the markets that it is in no hurry to raise rates. Precious metals rallied and oil caught a break. Most equity markets ended in the green except for India.
Index Returns
Market Cap Decile Performance
Decile
Mkt. Cap.
Adv/Decl
1 (micro)
-5.00%
56/77
2
-4.91%
59/74
3
-4.09%
56/77
4
-2.81%
58/74
5
-4.43%
62/71
6
-3.76%
60/73
7
-3.01%
59/73
8
-1.63%
60/73
9
-0.96%
70/63
10 (mega)
-1.39%
67/66
Mid- and small-cap stocks took it on the chin this week on the sudden realization that the (earnings) emperor has no clothes.
“Lucky” people are adept at creating and noticing chance opportunities (such as meeting an important businessman at a café), listen to their intuition, have positive expectations that create self-fulfilling prophesies, and have a relaxed and resilient attitude about life’s trials. Poor unlucky souls are more tense and anxious than lucky ones.
MNC funds invest in the Indian listed shares of foreign firms, like Bosch, Britannia and Colgate Palmolive. The funds are bench-marked against the CNX MNC Index.
The MNC index has out-performed pretty much every other market-cap index. We had discussed this previously and had pointed out that the UTI MNC Fund is decent place to get exposure to this asset class.
UTI vs Birla Sun Life
Thankfully, there are only two funds that track this asset class – one is the UTI MNC Fund and the other is the Birla Sun Life MNC Fund. Here’s how their growth schemes compare:
Between 2006-07-03 and 2015-03-19, BSL MNC Fundhas returned a cumulative 478.61% with an IRR of 22.31% vs. UTI MNC Fund’s cumulative return of 427.17% and an IRR of 21.02%. (http://svz.bz/1Exk126)
The difference in performance between the two funds is de minimis when you consider that the period of comparison is almost eight years. The main thing to focus on here is that an IRR of ~22% is extremely hard to achieve in any asset class over that stretch of time.
Active Management
SYMBOL
Birla Sunlife MNC Fund
UTI MNC Fund
CNX MNC
INGVYSYABK
8.97
3.01
–
ICRA
8.67
–
–
HONAUT
8.53
3.48
–
BAYERCROP
8.33
–
–
BOSCHLTD
5.99
7.19
9.22
GILLETTE
5.89
2.71
–
GLAXO
5.48
1.44
2.59
PFIZER
5.15
1.38
–
MARUTI
3.62
7.16
18.09
STERLINH
3.61
–
–
CRISIL
3.01
2.92
–
HINDUNILVR
2.74
4.21
24.37
CUMMINSIND
2.73
4.36
4.38
WABCOINDIA
2.47
0.32
–
ACC
1.96
–
–
BATAINDIA
1.65
–
–
HITACHIHOM
1.64
–
–
FAGBEARING
1.47
–
–
KANSAINER
1.45
–
–
COLPAL
1.39
1.33
5.02
PGHH
1.35
1.92
–
OFSS
1.15
2.43
2.62
SMLISUZU
1.15
0.12
–
AMBUJACEM
1.11
3.64
7.25
NESTLEIND
0.94
1.38
–
ALSTOMT&D
0.72
1.76
–
BLUEDART
0.71
0.58
–
SIEMENS
0.7
3.04
4.66
FMGOETZE
0.69
–
–
ITC
0.66
–
–
AIL
0.59
0.17
–
DISAQ
0.57
–
–
AKZOINDIA
0.53
1.6
–
FULFORD
0.52
–
–
ABB
0.49
–
2.51
SANOFI
0.46
1.41
–
ITDCEM
0.46
2.31
–
CASTROLIND
0.45
2.97
2.59
RANBAXY
0.36
0.58
–
SCHNEIDER
0.26
–
–
MPHASIS
0.07
2.33
1.2
EICHERMOT
–
6.28
–
BRITANNIA
–
4.17
4.84
MCDOWELL-N
–
2.53
–
SKFINDIA
–
2.47
–
MAHINDCIE
–
2.13
–
SSLT
–
1.95
7.96
INGERRAND
–
1.49
–
MONSANTO
–
1.13
–
TIMKEN
–
1.07
–
CLNINDIA
–
0.97
–
GSKCONS
–
0.9
2.69
AUTOAXLES
–
0.38
–
WHIRLPOOL
–
0.21
–
Both funds are actively managed. There is no “index-hugging” going on here. However, between the two, the Birla Sunlife fund significantly differs from the CNX MNC index.
Portfolio trajectories
Both have allowed their winners to run and have different positions that have worked out well for them. Here’s how the Birla Sunlife Fund looks like:
And this is how the UTI Fund looks like:
The View
You will do well to have either fund in your portfolio. But given the narrow focus of these funds, these should complement your portfolio rather than dominate it. If you have any questions, feel free to get in touch!