MOMENTUM
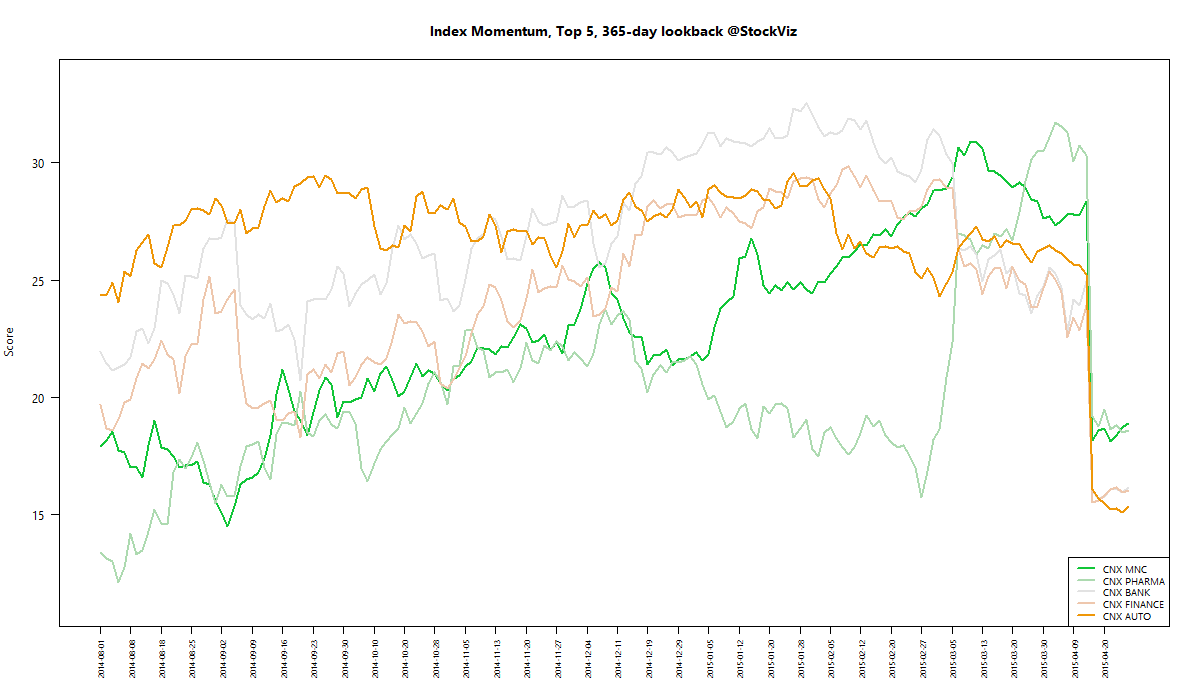
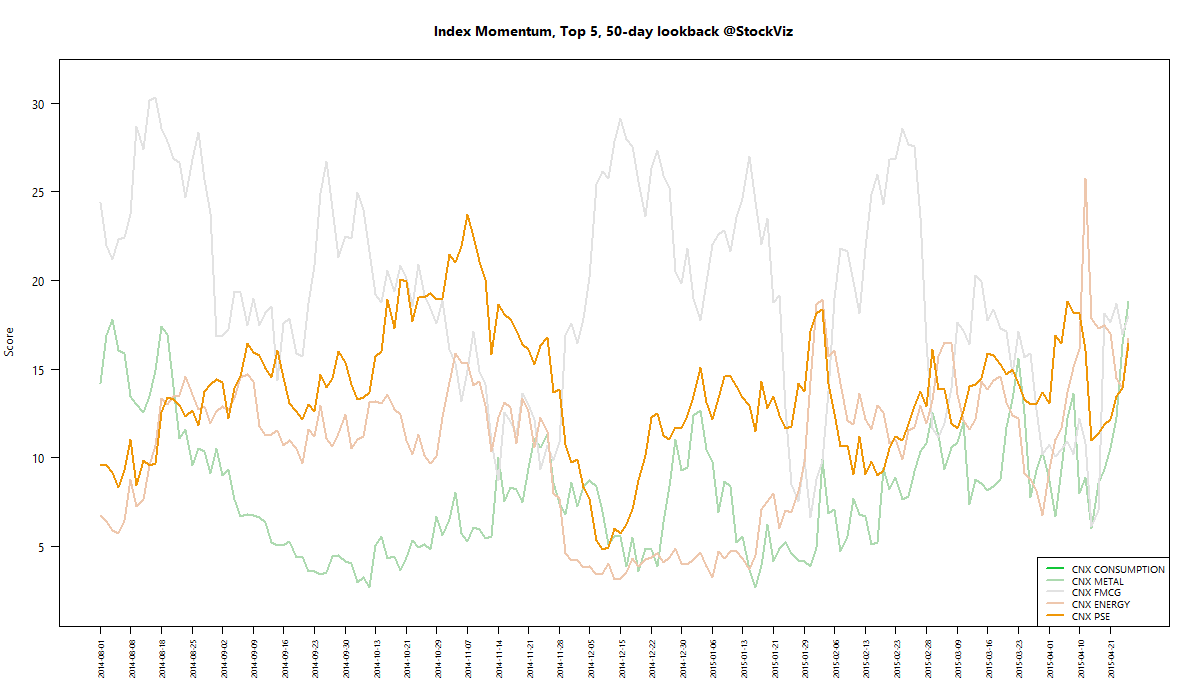
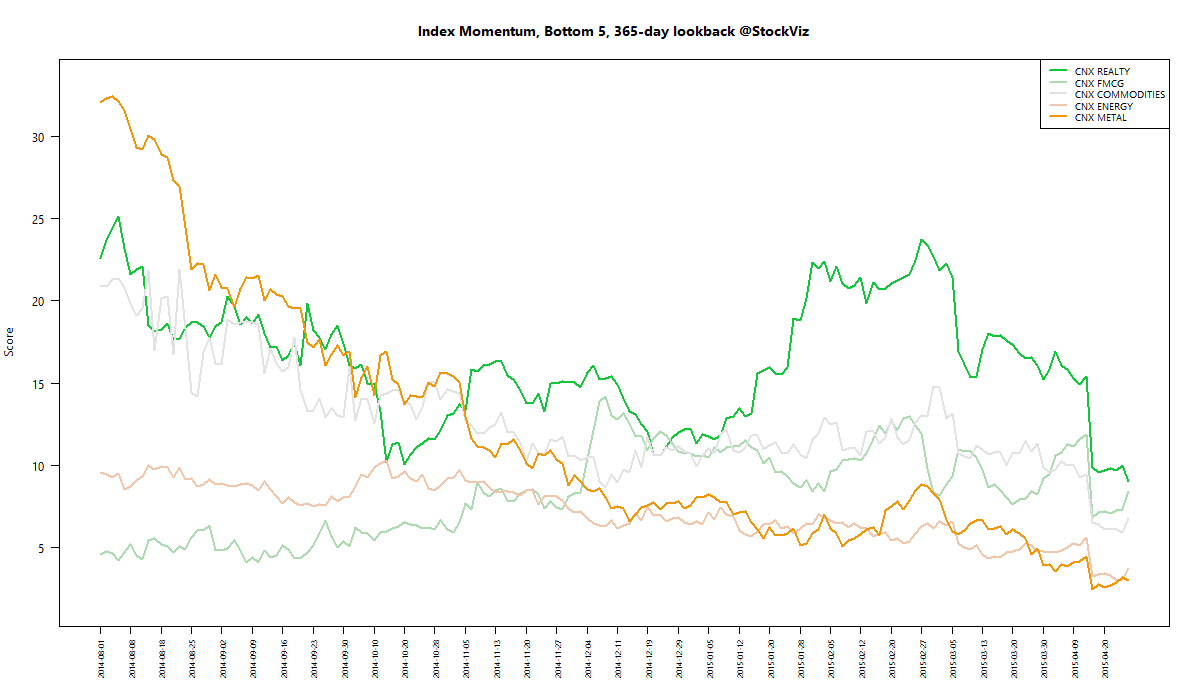
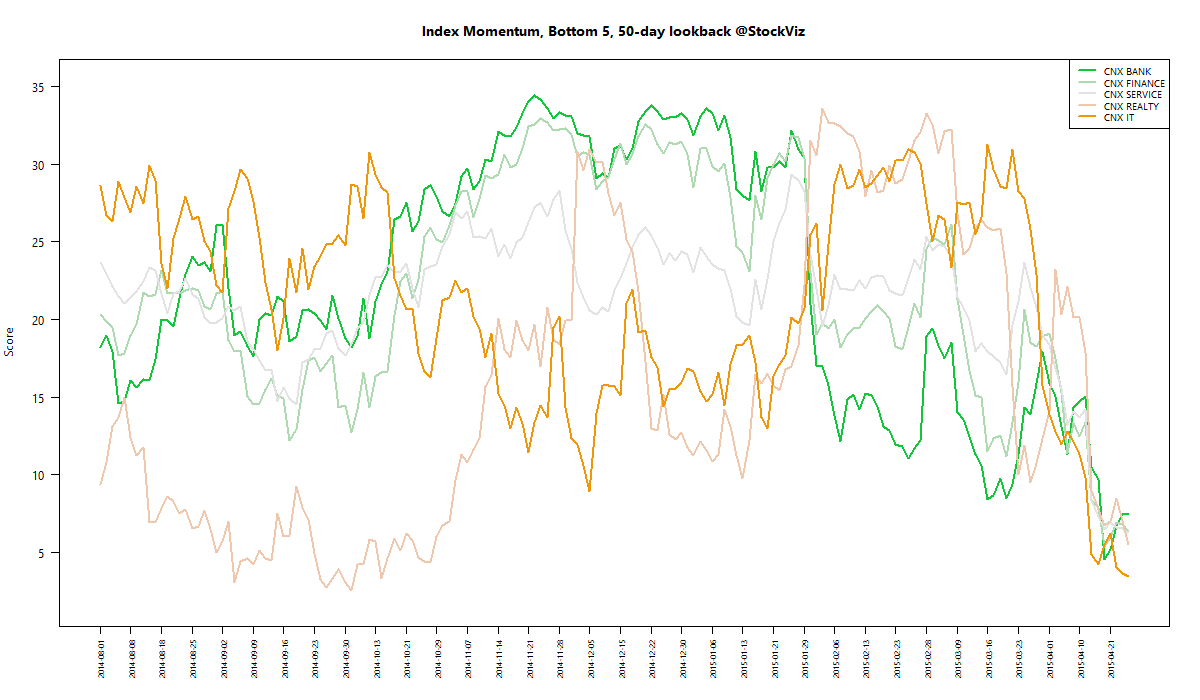
We run our proprietary momentum scoring algorithm on indices just like we do on stocks. You can use the momentum scores of sub-indices to get a sense for which sectors have the wind on their backs and those that are facing headwinds.
Traders can pick their longs in sectors with high short-term momentum and their shorts in sectors with low momentum. Investors can use the longer lookback scores to position themselves using our re-factored index Themes.
You can see how the momentum algorithm has performed on individual stocks here.
Here are the best and the worst sub-indices:
Refactored Index Performance
50-day performance, from February 10, 2015 through April 24, 2015:
Trend Model Summary
| Index | Signal | % From Peak | Day of Peak |
|---|---|---|---|
| CNX AUTO | SHORT |
10.28
|
2015-Jan-27
|
| CNX BANK | SHORT |
12.42
|
2015-Jan-27
|
| CNX ENERGY | SHORT |
29.16
|
2008-Jan-14
|
| CNX FMCG | SHORT |
7.58
|
2015-Feb-25
|
| CNX INFRA | SHORT |
48.62
|
2008-Jan-09
|
| CNX MEDIA | SHORT |
28.84
|
2008-Jan-04
|
| CNX METAL | SHORT |
55.32
|
2008-Jan-04
|
| CNX MNC | SHORT |
6.69
|
2015-Mar-12
|
| CNX NIFTY | SHORT |
7.68
|
2015-Mar-03
|
| CNX PHARMA | SHORT |
11.72
|
2015-Apr-08
|
| CNX PSE | SHORT |
25.79
|
2008-Jan-04
|
ENERGY, INFRA, MEDIA, METAL and PSE sub-indices are well below their 2008 boom-era heights. Banks and Pharma have been badly hit this year. Will MNCs provide cover?
Our trend model is short on all indices right now, probably indicating that the market is over-sold…
Our trend model is short on all indices right now, probably indicating that the market is over-sold…