Tag: BANKNIFTY

Options Weekly 04.03.2023

Summary: Mar NIFTY 18000 calls added 65,14,850 contracts while 17400 calls shed 44,21,500. On the Put side of the equation, the 17500 strike added 80,10,000 while the 16850’s shed 4,60,800.

MAR NIFTY OI

MAR NIFTY OI chart

MAR BANKNIFTY OI

MAR BANKNIFTY OI chart

MAR NIFTY Volatility

MAR NIFTY Volatility chart

MAR BANKNIFTY Volatility

MAR BANKNIFTY Volatility chart
Dotted lines indicated actual underlying volatility. Solid lines are IVs.

VIX Density Plot

VIX kernel density plot

Nifty 50 Returns Density Plot

NIFTY 50 kernel density plot

Chart: One and Two Percent Moves

  1. Prev. Close-to-Open: c2o – overnight events
  2. Close-to-Close: c2c – fundamental
  3. Open-to-Close: o2c – sentiment
  4. High-to-Low: h2l – uncertainty

NIFTY 50

One percent:
NIFTY%2050.DAILY.1pct

Two percent:
NIFTY%2050.DAILY.2pct

BANK NIFTY

One percent:
NIFTY%20BANK.DAILY.1pct

Two percent:
NIFTY%20BANK.DAILY.2pct

A lot of traders close out their positions by the end of the day. It certainly reduces the risk embedded in overnight moves (c2o) but that has been falling over the years. So has the o2c range. Perhaps it is an artifact of the bull market and reversion to the 2011-2013 range is imminent. Something to keep an eye on.

Code and charts on github.

Related: Is the Low Volatility Regime Breaking?

The Treasure in Treasury Operations

Treasury Operations of Banks

First the Wikipedia definition: Treasury management (or treasury operations) includes management of an enterprise’s holdings, with the ultimate goal of managing the firm’s liquidity and mitigating its operational, financial and reputational risk. Treasury Management includes a firm’s collections, disbursements, concentration, investment and funding activities. In larger firms, it may also include trading in bonds, currencies, financial derivatives and the associated financial risk management.

For a bank, this means asset/liability management, hedging interest rate risk, managing reserve and capital requirements, etc. It is also something banks provide as a value added service for their clients.

Revenue from Treasury Operations

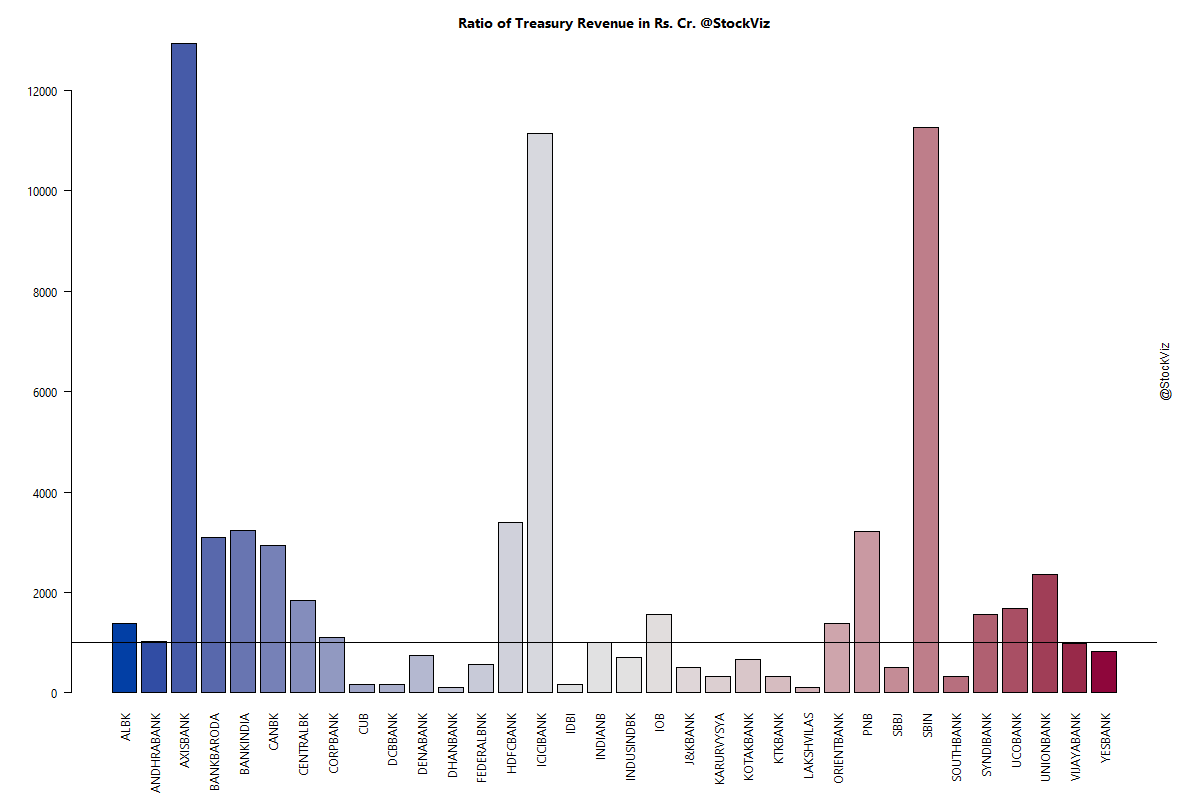
Banks break out segment revenues that include revenue derived from treasury operations. However, they don’t carve out how much of it was proprietary trading. This is the average quarterly revenue from treasury operations since June 2014 (in Rs. Cr.) of major Indian banks:

bank.treasury.revenue

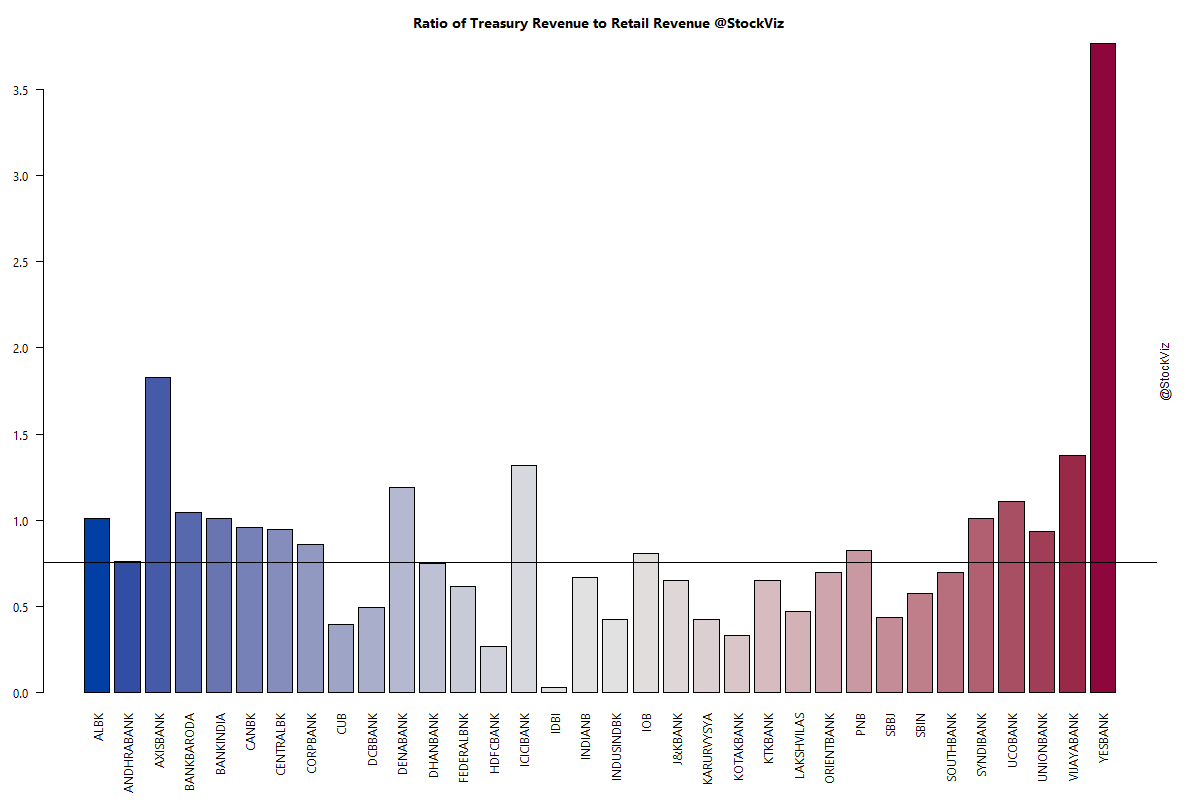
In fact, for a few of them, revenue from treasury operations exceed from those from retail banking.

bank.treasury.retail.revenue

The need for more disclosure

The revenue from treasury ops is a black box. If most of that revenue is derived from prop trading, then investors need better disclosure of the risks that were taken. Recently, YESBANK got pummeled on a UBS report that raised doubts over their exposure to stressed companies. As a retail investor, we really don’t have a clue about the risks involved in holding equity in what could turn out to be a hedge fund in bank’s clothing.

BANKNIFTY Butterflies

Introduction

So far, we have focused on the NIFTY for selling butterflies (Part I, II, III.) How would this look on the BANKNIFTY?

CNX BANK Index Returns

First, let’s have a look at the 30-day rolling returns of the CNX BANK Index, from 2010 to the present, the whole population:

day-30-rolling.BANKNIFTY.2010-2015
Median: 1.79%

2014-present:
day-30-rolling.BANKNIFTY.2014-2015
Median: 2.21%

Beginning of 2015-present:
day-30-rolling.BANKNIFTY.2015-2015
Median: flat

Currently, the index is around 18700. That means a 100-point move translates to 100/18700 ~0.5%

Expiry-to-Expiry Back-test

If we do the same back-test we did to the NIFTY, this is what we find:

butterfly.returns.BANKNIFTY

Conclusion

As with the NIFTY, the trade makes money if you know how to cut your losses. However, when the trade is live, how do we know what the future volatility of the underlying is going to look like? Without risk-management, a short-call butterfly strategy will encounter out-sized losses that wipe out all prior incremental gains.

Machine Learning Long-Short Trend Following

Introduction

Our previous post discussed how a simple SMA On/Off Switch based tactical algo can be enhanced by a volatility metric. We generated significant alpha by following a simple rule:

Go short if either or the volatility signal or the 50-DMA indicates a negative bias and long otherwise.

But what if we trained a machine on the same data and allowed it to decide when to go long and short?

Support Vector Machines

We fed an SVM our volatility metric and the percentage distance from 50-day SMA. A 5-year training set was used to predict the next year daily long/short. We will not delve into the details of how SVMs work, Wikipedia does a decent job introducing the concept.

Performance

To make it easier to compare, we plot the wealth-charts for the NIFTY and BANKNIFTY indices side-by-side.

The black line is the Machine Learning Long-Short Model and the blue line is buy-and-hold. NIFTY and BANKNIFTY since 2011:

nifty.machine.learning.2011

banknifty.machine.learning.2011

NIFTY and BANKNIFTY since 2013:

nifty.machine.learning.2013

banknifty.machine.learning.2013

Cumulative Returns

Buy-and-hold has two big advantages over a trading strategy: transaction costs and tax treatment. Here is how the different strategies compare with buy and hold:

NIFTY SVM

BANKNIFTY SVM

It appears that the ML(V + 50-DMA) Long Short strategy works better on the BankNifty than on the Nifty. The out-performance of the ML model on the BankNifty more than compensates for transaction costs and taxation.

Conclusion

The ML model outperformed the NIFTY by an average of 12% in the last 4-years and the BANKNIFTY by 94% in the same period. The out-performance on the BANKNIFTY is considerable enough to warrant further exploration.