Category: Your Money

Weekly Recap: May Day

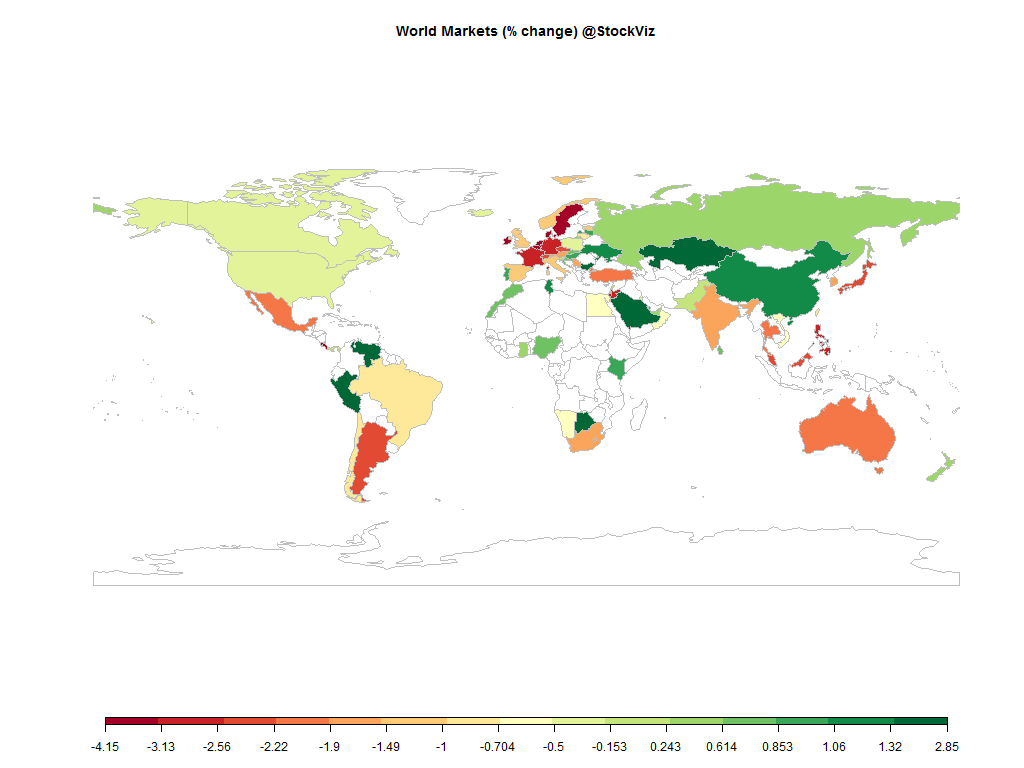
world.2015-04-24.2015-05-01

Equities

Major
DAX(DEU) -3.02%
CAC(FRA) -2.98%
UKX(GBR) -1.20%
NKY(JPN) -2.44%
SPX(USA) -0.49%
MINTs
JCI(IDN) -6.42%
INMEX(MEX) -1.97%
NGSEINDX(NGA) +0.64%
XU030(TUR) -1.90%
BRICS
IBOV(BRA) -0.74%
SHCOMP(CHN) +1.09%
NIFTY(IND) -1.49%
INDEXCF(RUS) +0.34%
TOP40(ZAF) -1.57%

Commodities

Energy
Heating Oil +3.51%
Ethanol -0.06%
Brent Crude Oil +2.61%
Natural Gas +9.66%
RBOB Gasoline +2.36%
WTI Crude Oil +3.93%
Metals
Gold 100oz +0.07%
Palladium +0.62%
Copper +6.91%
Platinum +0.85%
Silver 5000oz +1.90%

Currencies

USDEUR:-2.96% USDJPY:+1.06%

MINTs
USDIDR(IDN) +0.20%
USDMXN(MEX) +1.01%
USDNGN(NGA) -0.26%
USDTRY(TUR) -0.40%
BRICS
USDBRL(BRA) +1.68%
USDCNY(CHN) +0.14%
USDINR(IND) -0.22%
USDRUB(RUS) +1.76%
USDZAR(ZAF) -0.36%
Agricultural
Cocoa +0.61%
Coffee (Arabica) -7.30%
Coffee (Robusta) -3.84%
Cotton +1.74%
Cattle -7.32%
Lean Hogs +6.12%
Lumber -1.59%
Orange Juice -0.83%
Soybeans -0.05%
Sugar #11 -1.75%
Feeder Cattle -0.68%
Wheat -3.04%
White Sugar -0.35%
Corn -1.17%
Soybean Meal +0.13%

Credit Indices

Index Change
Markit CDX EM -0.13%
Markit CDX NA HY -0.15%
Markit CDX NA IG +1.38%
Markit iTraxx Asia ex-Japan IG -0.23%
Markit iTraxx Australia +0.03%
Markit iTraxx Europe +0.76%
Markit iTraxx Europe Crossover +7.53%
Markit iTraxx Japan +0.72%
Markit iTraxx SovX Western Europe -0.02%
Markit LCDX (Loan CDS) +0.00%
Markit MCDX (Municipal CDS) -0.41%
Are world markets prepping for “sell in May and go away?”

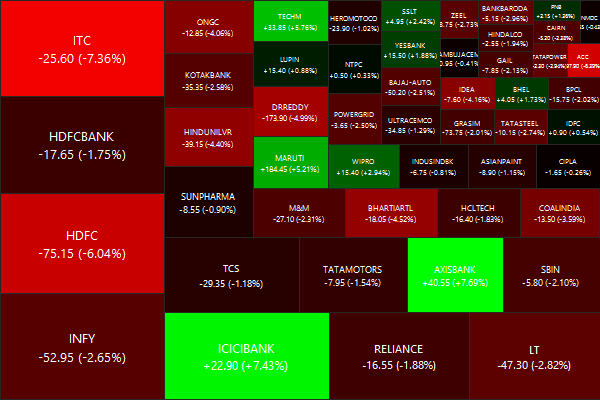
Nifty Heatmap

CNX NIFTY.2015-04-24.2015-04-30

Index Returns

For a deeper dive into indices, check out our weekly Index Update.
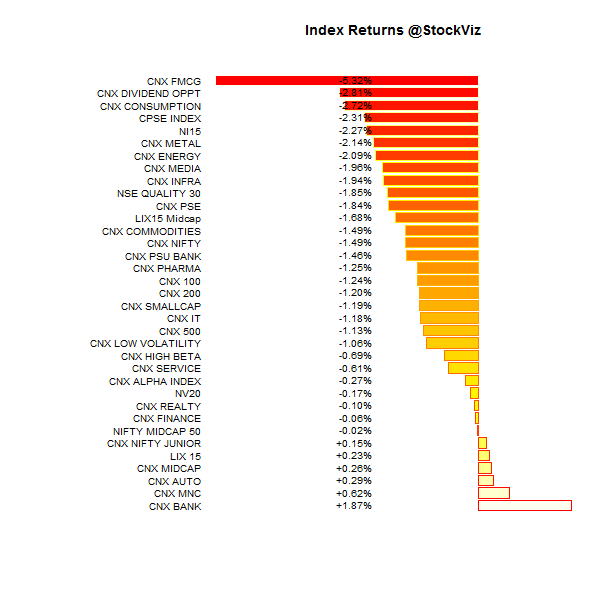
index performance.2015-04-24.2015-04-30

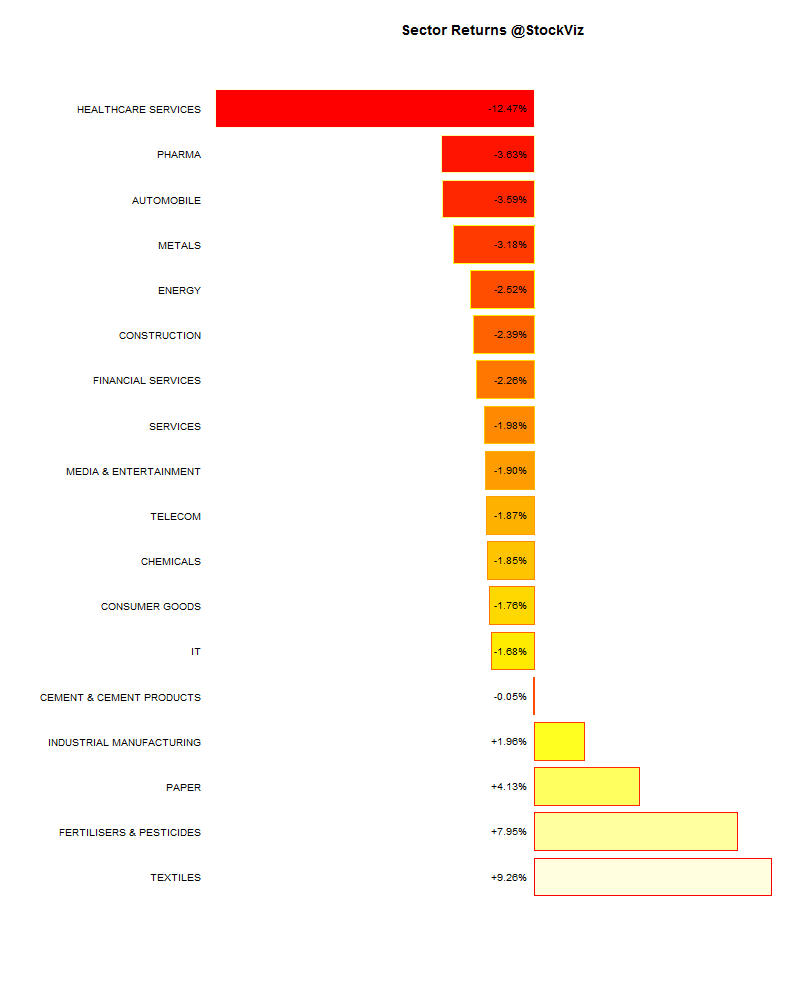
Sector Performance

sector performance.2015-04-24.2015-04-30

Advance Decline

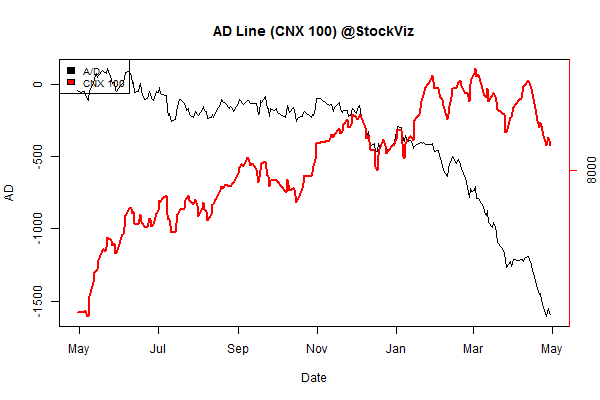
advance.decline.line2.2015-04-24.2015-04-30

Market Cap Decile Performance

Decile Mkt. Cap. Adv/Decl
1 -8.22% 64/68
2 -5.11% 56/75
3 -5.87% 50/81
4 -3.93% 57/74
5 -4.40% 62/69
6 -3.90% 61/70
7 -3.51% 56/75
8 -4.70% 64/67
9 -4.26% 59/72
10 -1.21% 70/62
An ocean of red, nary a green in sight…

Top Winners and Losers

MOTHERSUMI +7.93%
SIEMENS +10.80%
UPL +12.87%
UBL -12.70%
APOLLOHOSP -12.21%
ITC -7.36%
What’s next for ITC?

ETF Performance

BANKBEES +2.20%
GOLDBEES +1.00%
JUNIORBEES -0.71%
NIFTYBEES -1.19%
PSUBNKBEES -1.47%
CPSEETF -2.27%
INFRABEES -3.91%
Have banks found a bottom?

Yield Curve

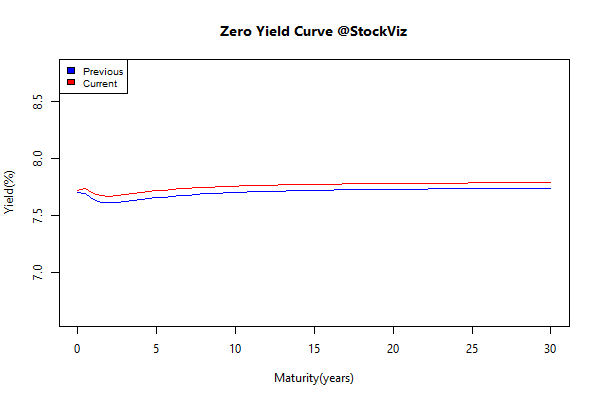
yield Curve.2015-04-24.2015-04-30

Bond Indices

Sub Index Change in YTM Total Return(%)
GSEC TB -0.18 +0.18%
GSEC SUB 1-3 -0.04 +0.34%
GSEC SUB 3-8 -0.00 +0.26%
GSEC SUB 8 +0.02 +0.12%
Rates went down a smidgen…

Investment Theme Performance

Magic Formula turned into Tragic Formula thanks to the cliff dive in KPIT stock. But the specks of green may be indicating that the current correction is on its last legs…

Equity Mutual Funds

Bond Mutual Funds

Thought for the weekend

The issue of inequality has never been about the fairness of the results, but should focus on the equality of opportunity.

The neo-classical solutions that the markets will take care of everything risks the kind of social instability seen in places like Ferguson, Baltimore, or worse.

You can use comparative advantages, such as low labor costs and convenient geographic proximity to markets, to spur development. But the Porter-Jacobs framework doesn’t explain why India and China succeeded and Kenya and Egypt didn’t.

You are left with culture: both the Jews and the Romani (Gypsies) have historically been outcasts in Europe. How did one group succeed and acquire power (e.g., the Rothchilds) and the other remains shunned throughout the region?
Source: May Day thoughts on inequality (and development)

Index Update 02.05.2015

MOMENTUM

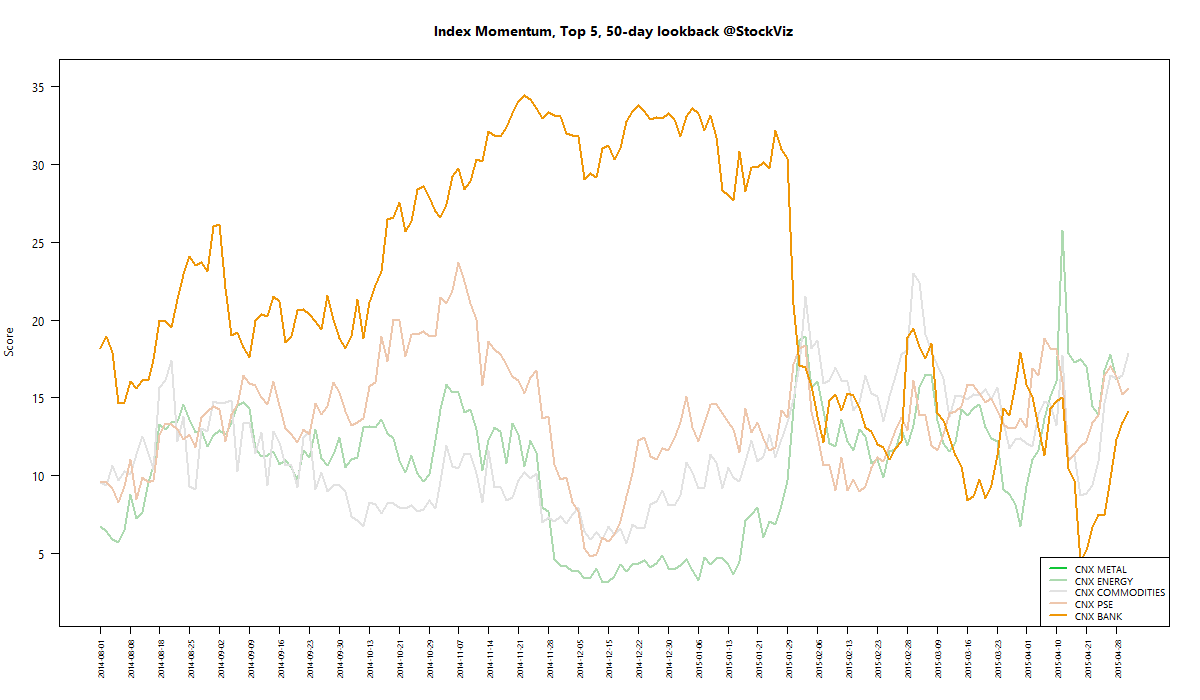
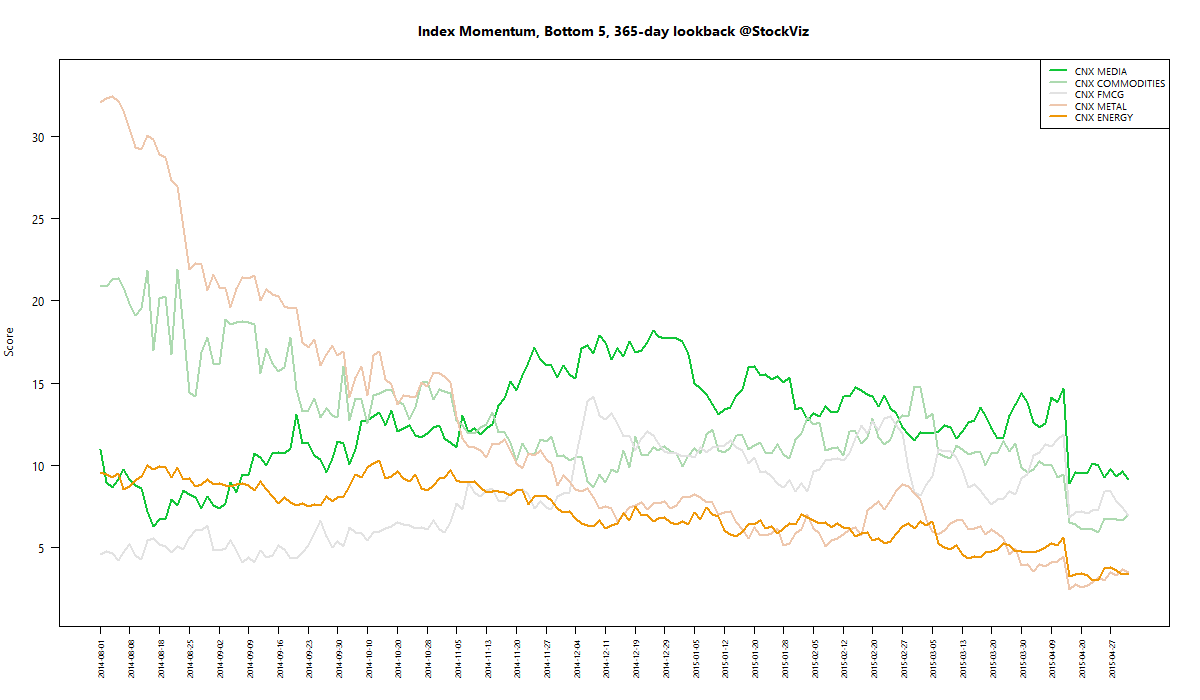
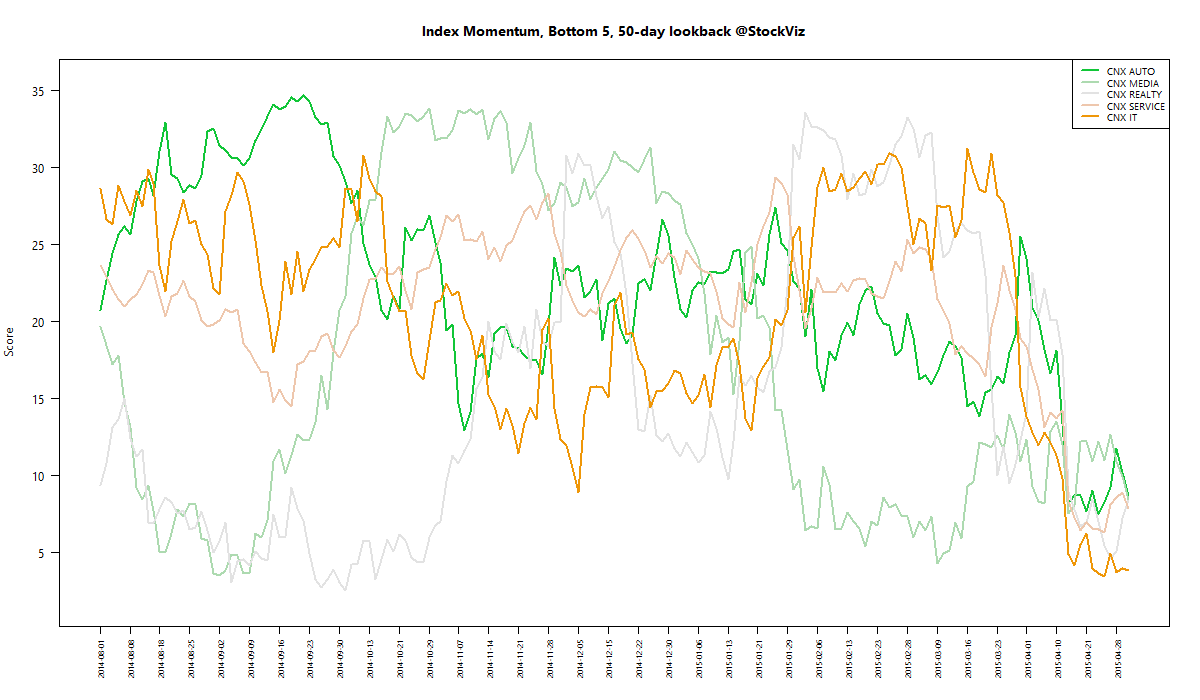
We run our proprietary momentum scoring algorithm on indices just like we do on stocks. You can use the momentum scores of sub-indices to get a sense for which sectors have the wind on their backs and those that are facing headwinds.

Traders can pick their longs in sectors with high short-term momentum and their shorts in sectors with low momentum. Investors can use the longer lookback scores to position themselves using our re-factored index Themes.

You can see how the momentum algorithm has performed on individual stocks here.

Here are the best and the worst sub-indices:

index momentum best 365 2015-04-30 png

index momentum best 50 2015-04-30 png

index momentum worst 365 2015-04-30 png

index momentum worst 50 2015-04-30 png

Refactored Index Performance

50-day performance, from February 16, 2015 through April 30, 2015:

Trend Model Summary

Index Signal % From Peak Day of Peak
CNX AUTO SHORT
10.02
2015-Jan-27
CNX BANK SHORT
10.79
2015-Jan-27
CNX ENERGY SHORT
30.64
2008-Jan-14
CNX FMCG SHORT
12.49
2015-Feb-25
CNX INFRA SHORT
49.61
2008-Jan-09
CNX IT SHORT
88.48
2000-Feb-21
CNX MEDIA SHORT
30.24
2008-Jan-04
CNX METAL SHORT
56.27
2008-Jan-04
CNX MNC SHORT
6.12
2015-Mar-12
CNX NIFTY SHORT
9.06
2015-Mar-03
CNX PHARMA SHORT
12.82
2015-Apr-08
CNX PSE SHORT
27.16
2008-Jan-04
CNX REALTY SHORT
89.10
2008-Jan-14
MNCs remain an oasis of calm in a desert landscape filled with fallen stars. Every other sector index has experienced double digit drawdowns from this year’s highs. Some indices are yet to recover from their 2008 blow offs. Are we due for a reversal?

Correlation Update 02.05.2015

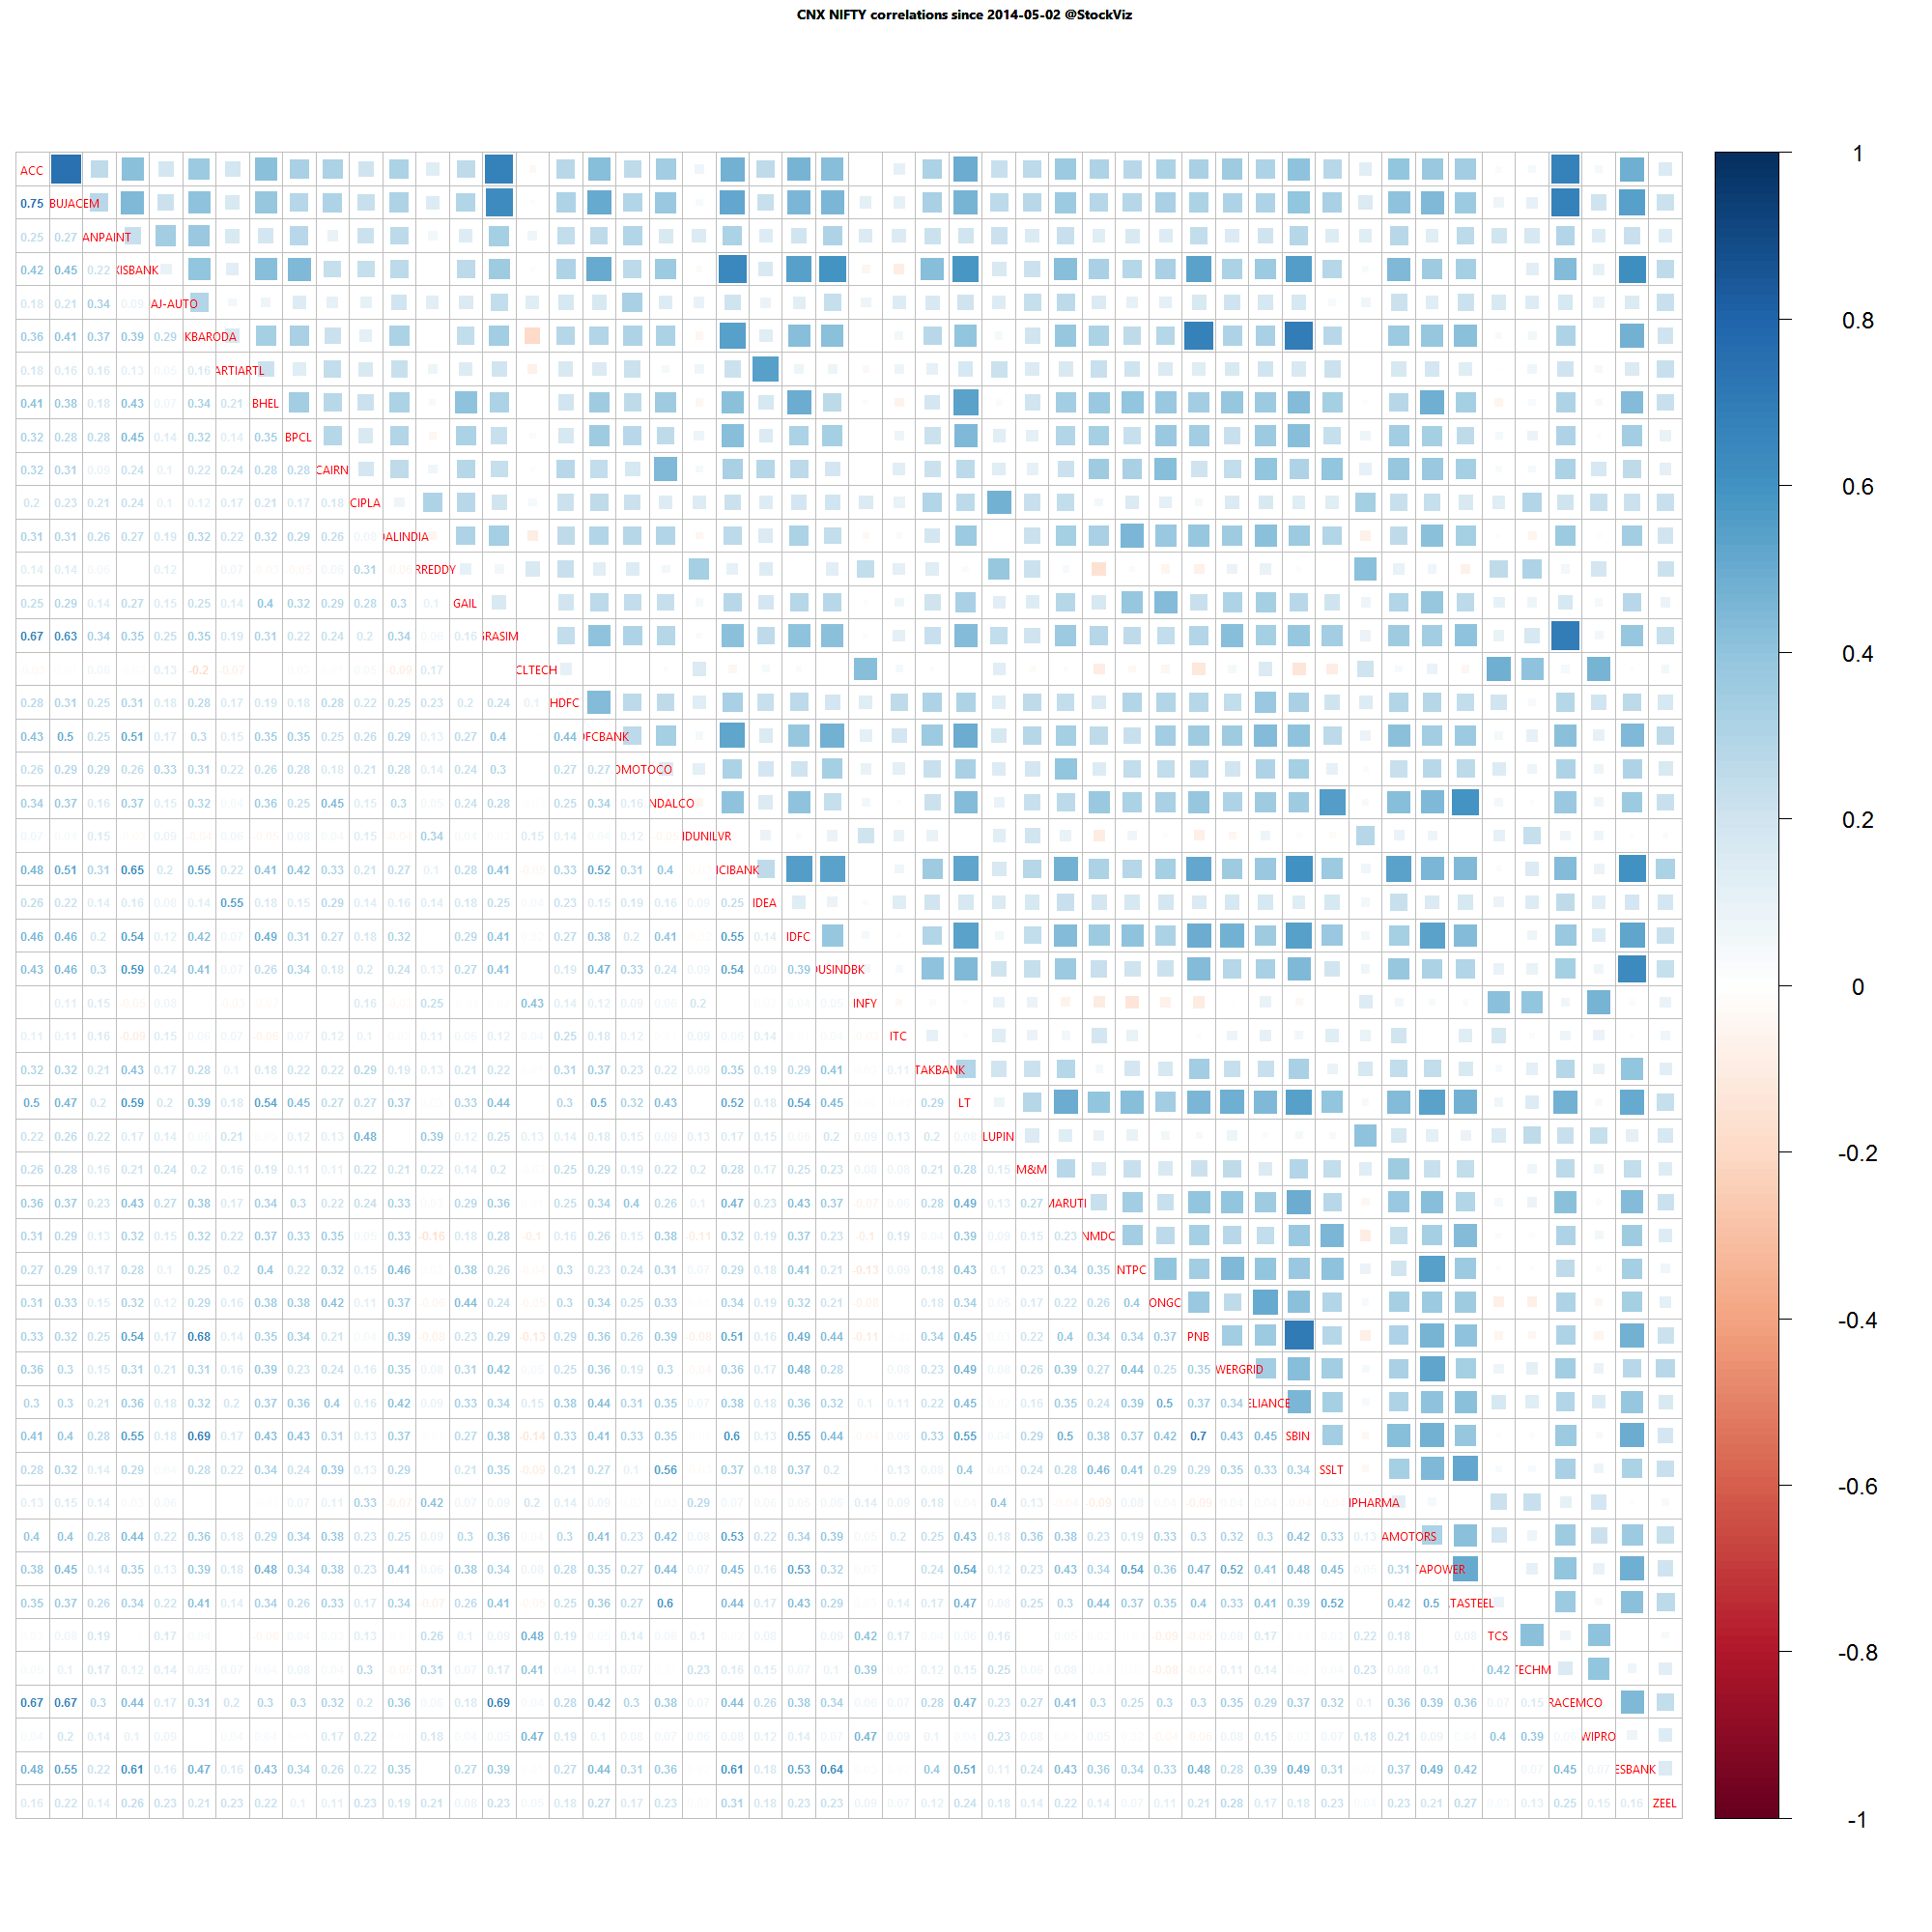
Nifty one year daily return correlations

Nifty one year daily return correlations

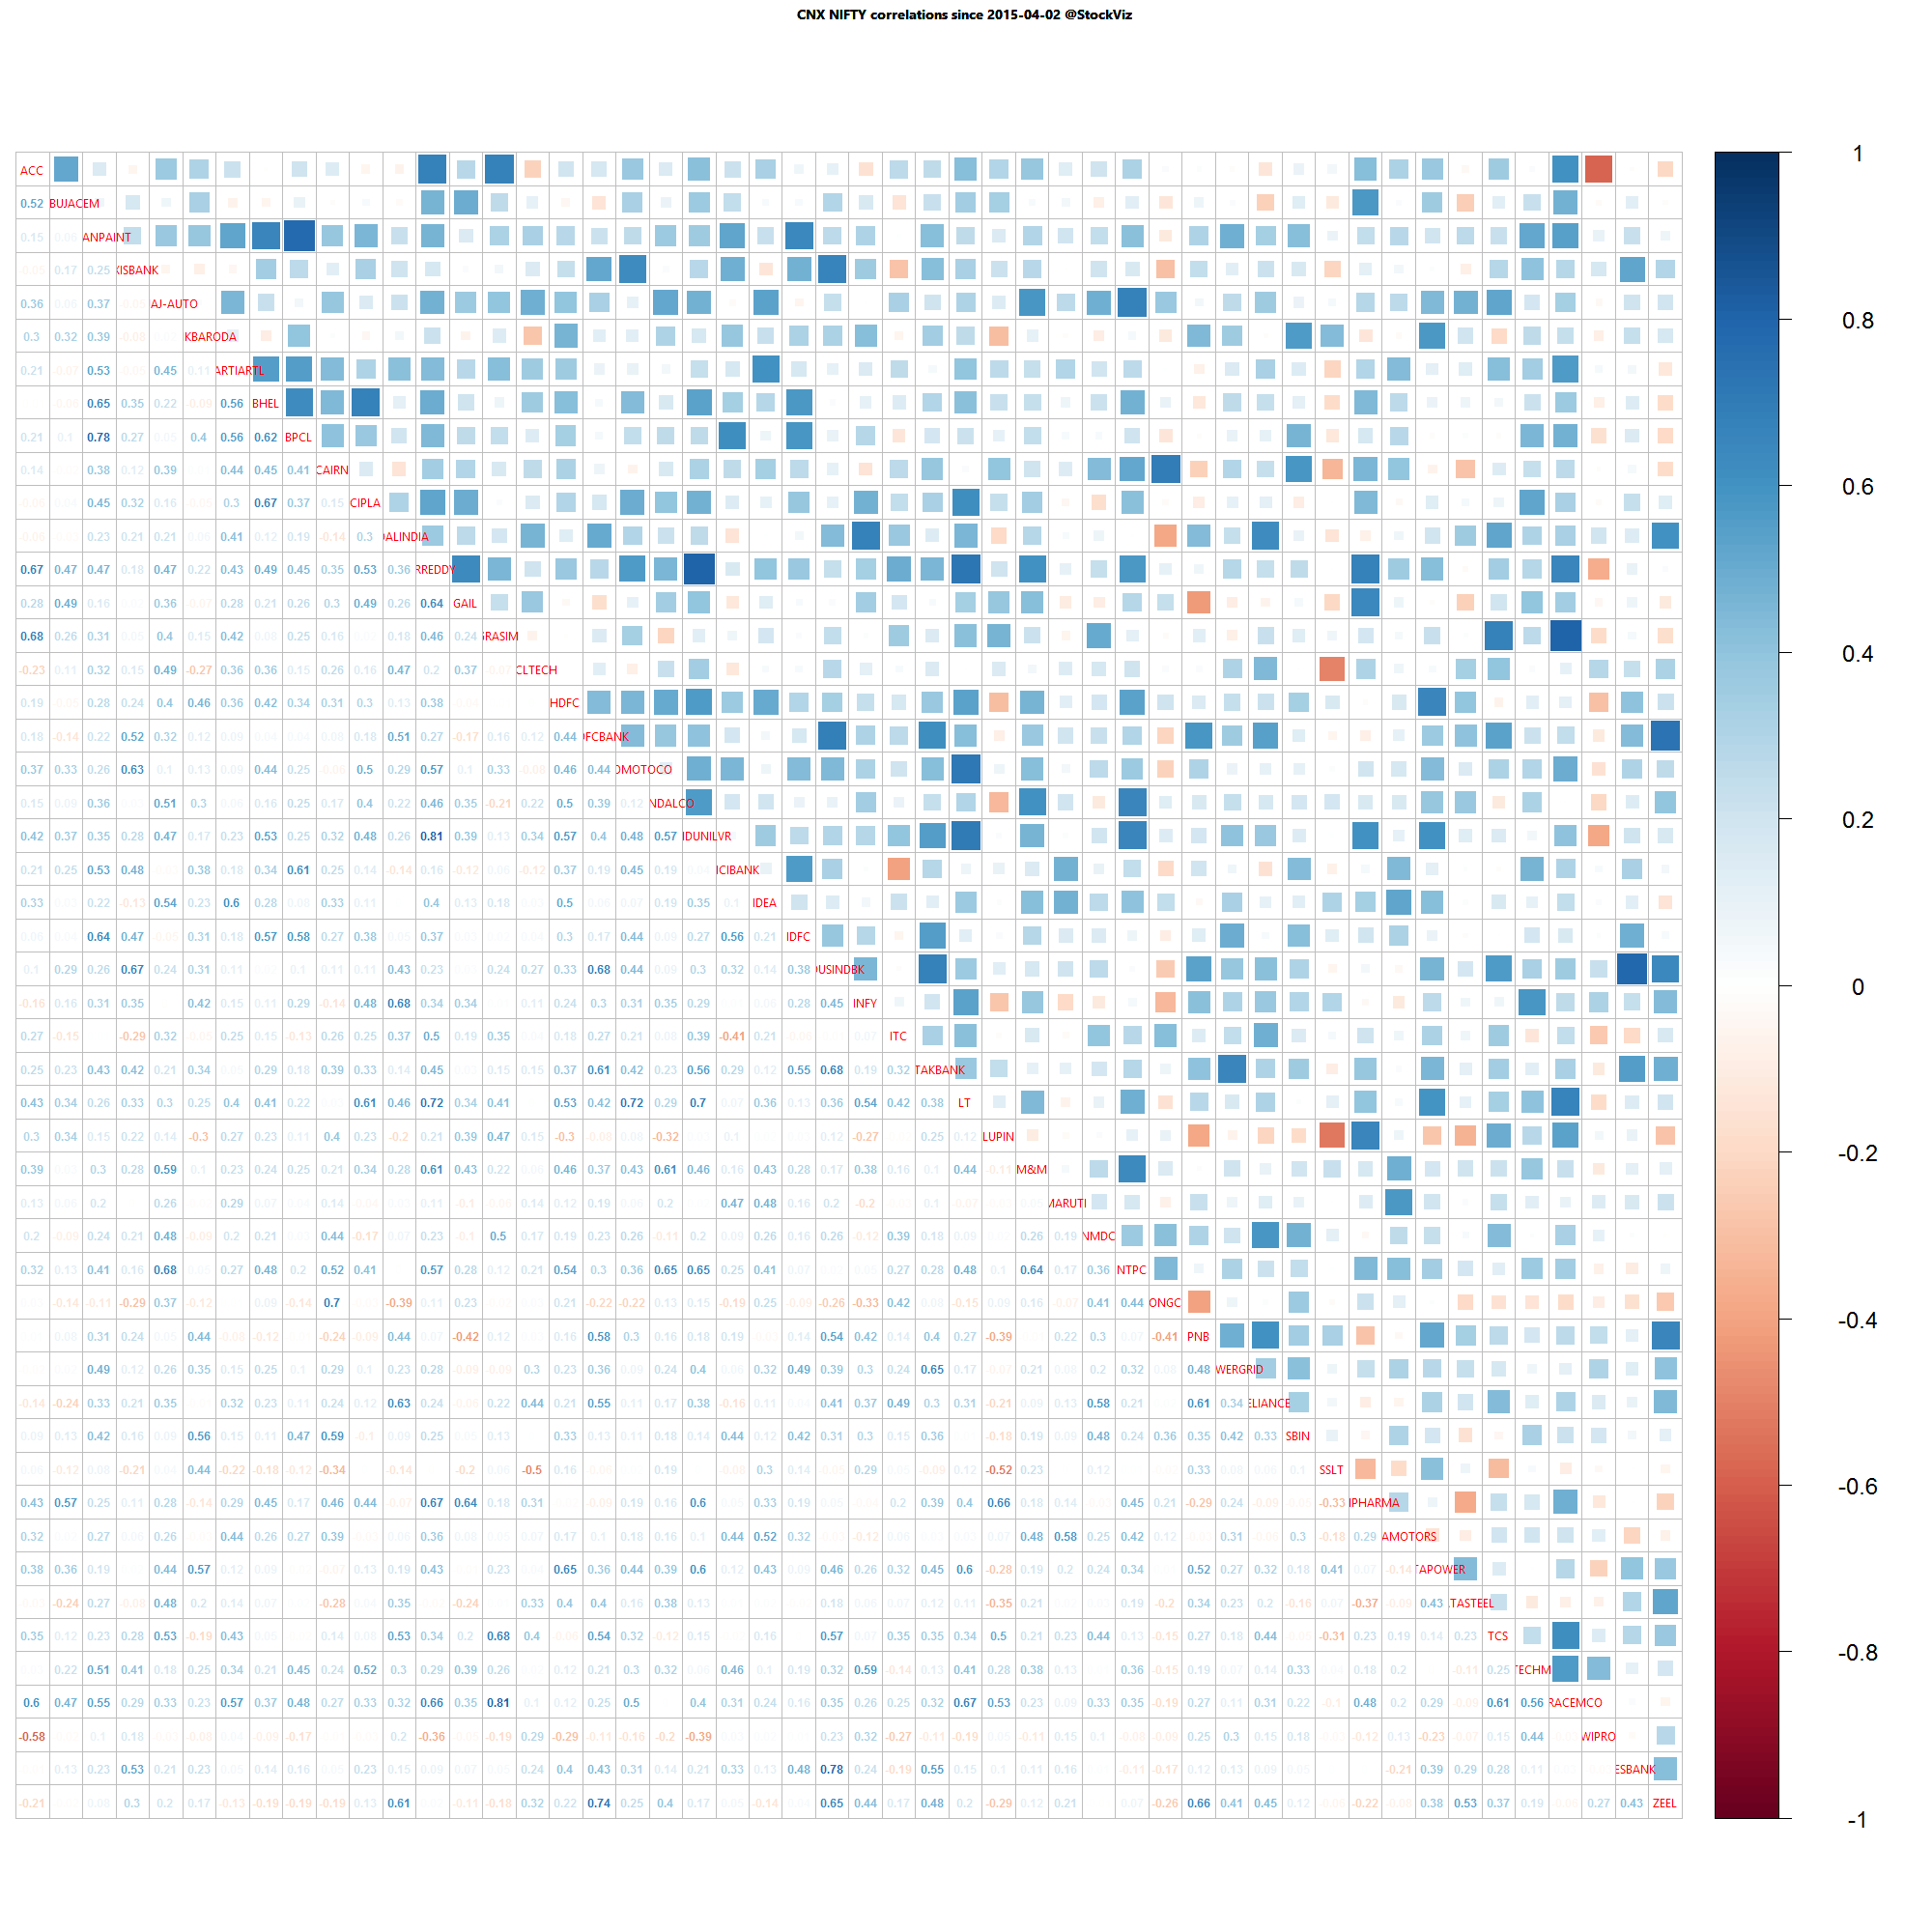
Nifty one month daily return correlations

Nifty one month daily return correlations

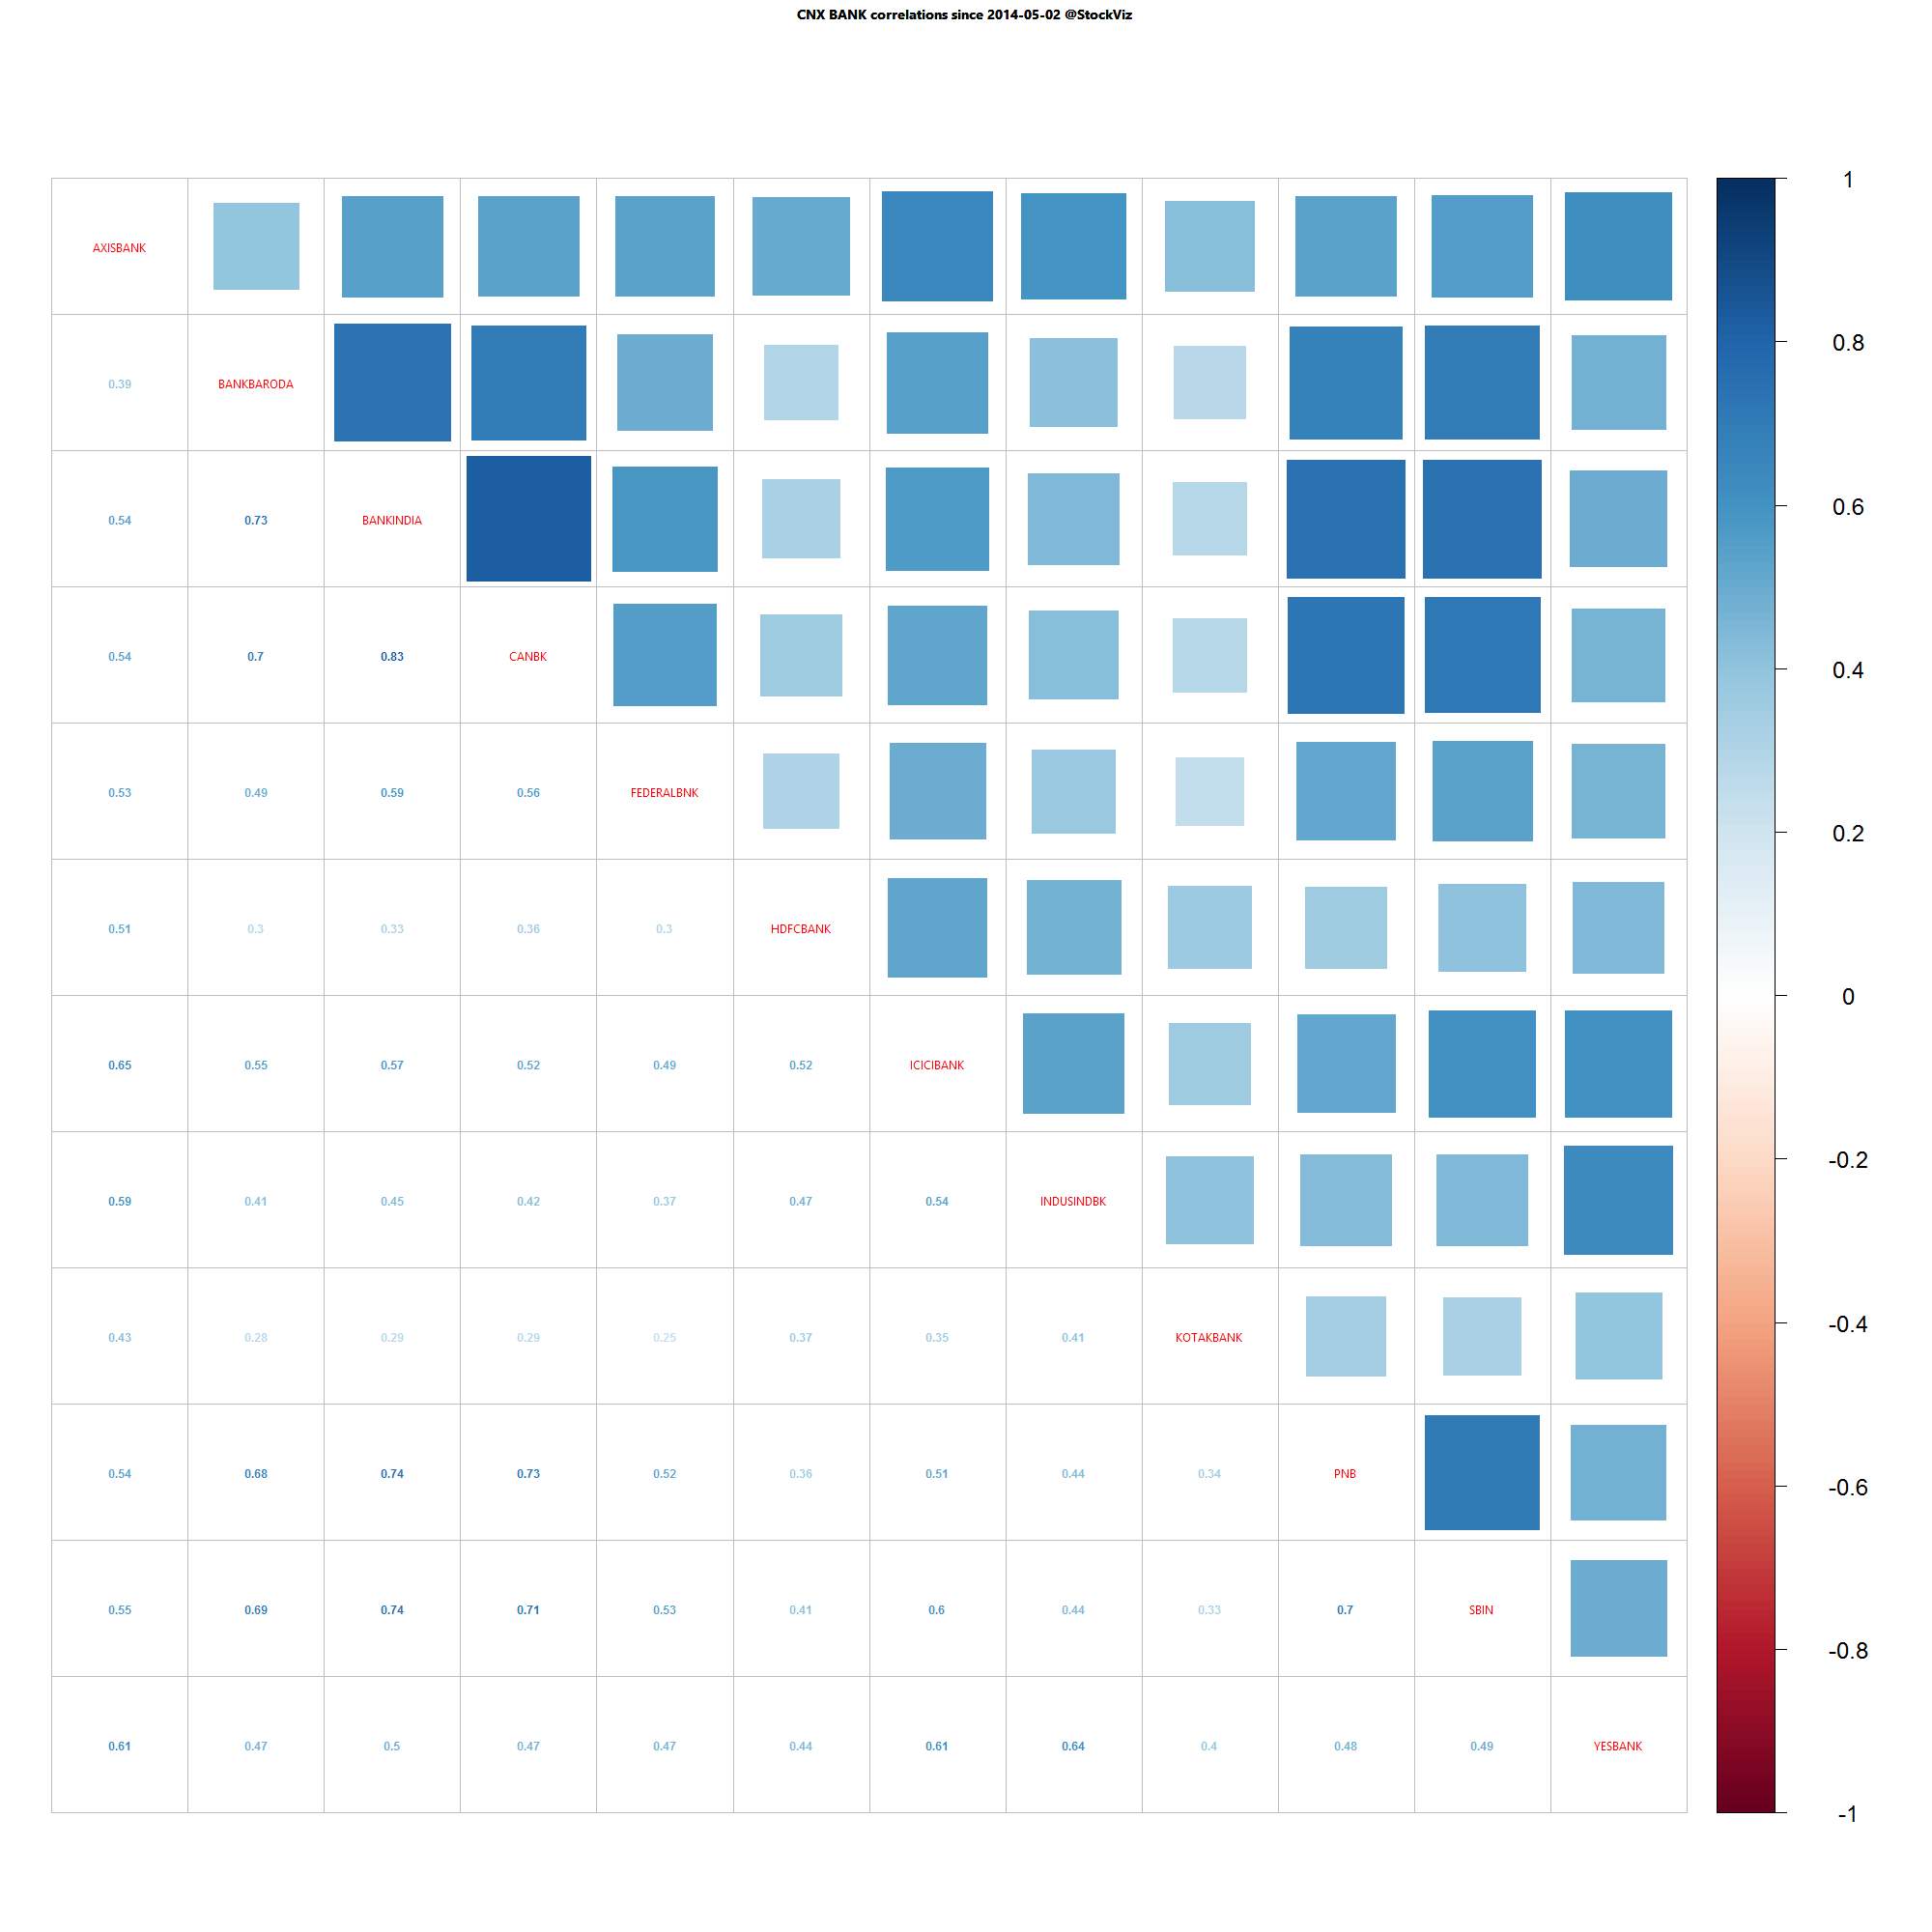
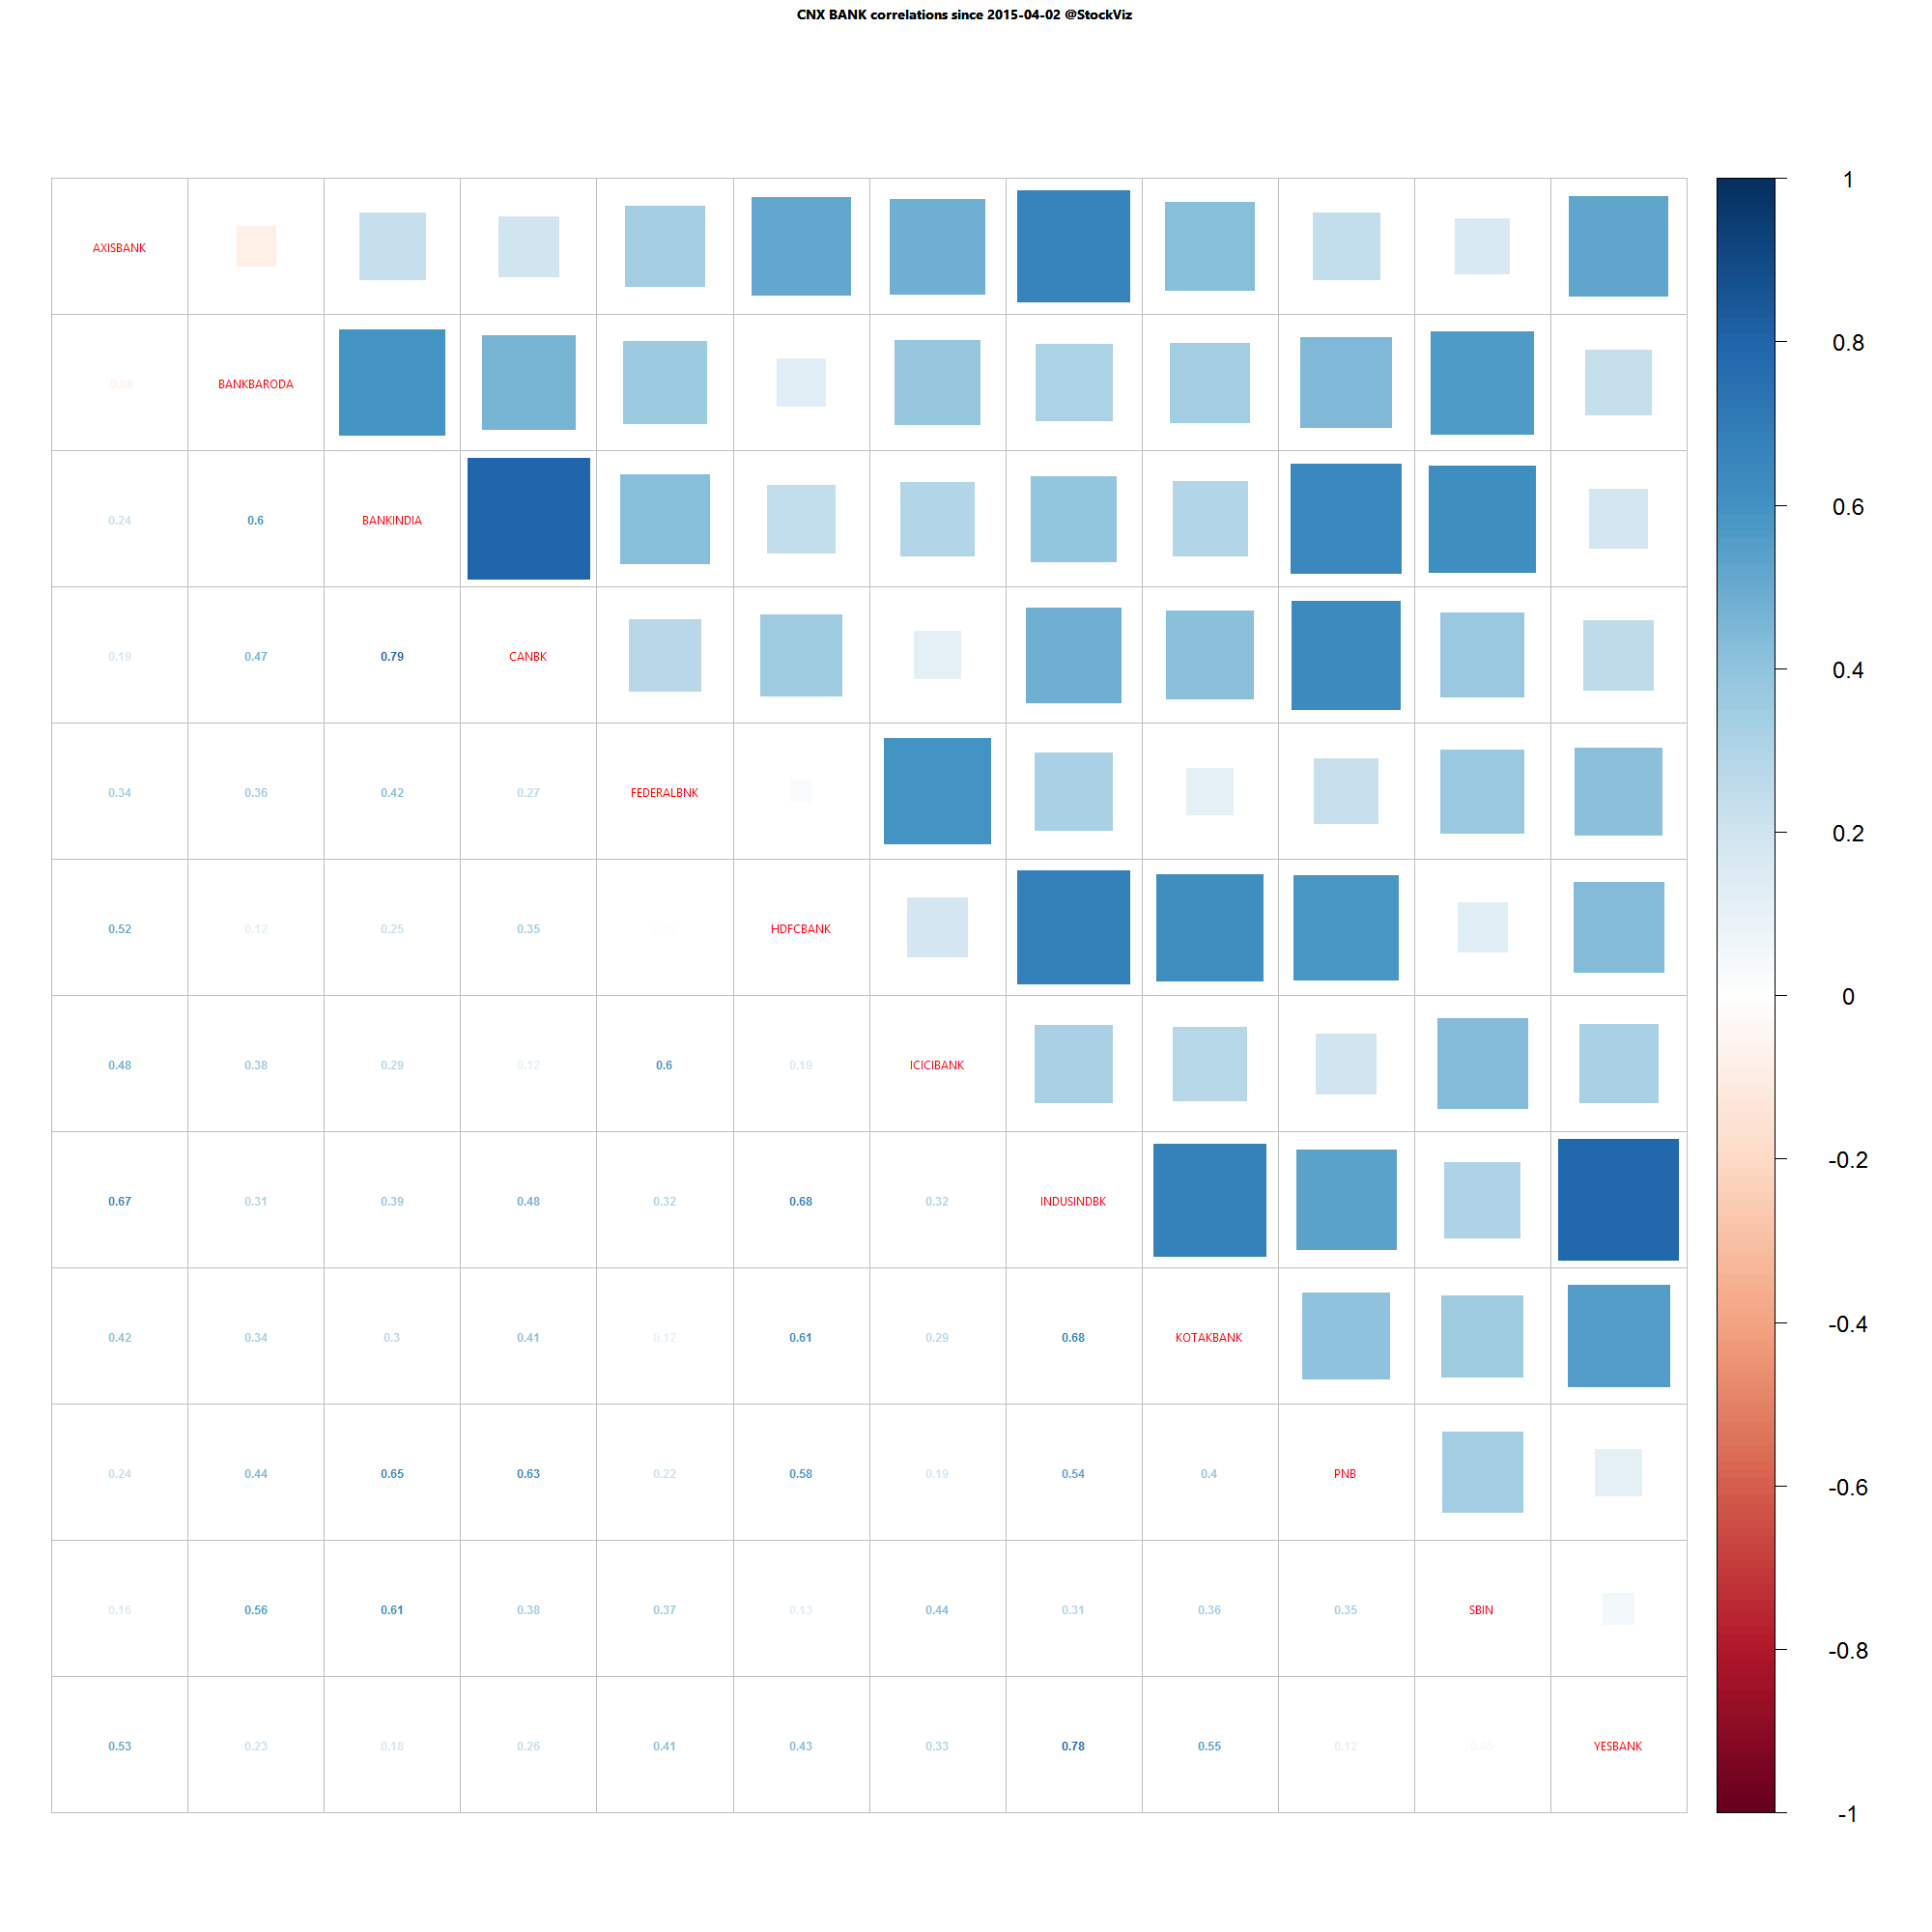
Bank Nifty one year daily return correlations

Bank Nifty one year daily return correlations

Bank Nifty one month daily return correlations

Bank Nifty one month daily return correlations

Midcap one year daily return correlations

Midcap one year daily return correlations

Midcap one month daily return correlations

Midcap one month daily return correlations

A lot of thick blue squares mean that positive correlations are high. Red squares mean negative correlations are high. Whites are the doldrums.

Gaps and the Pre-Open Call Auction

tl;dr

You should not treat opening prices before and after October 18, 2010 the same.

Call Auction in the pre-open session

If you don’t know how the pre-open session works, here’s a good explainer from BSE:

When you run back-tests that use the opening price, this change will most likely trip you up.

Before and after

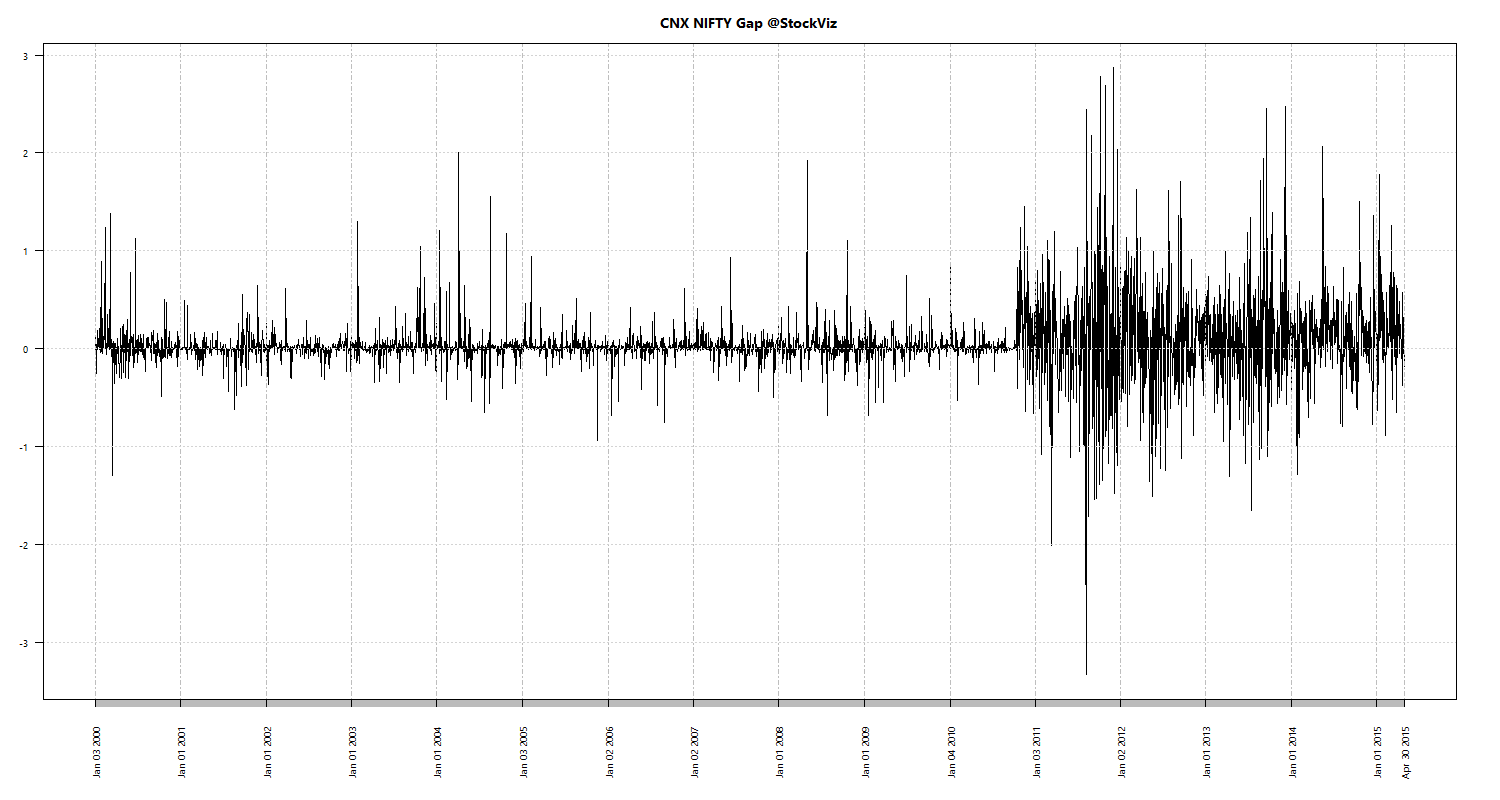
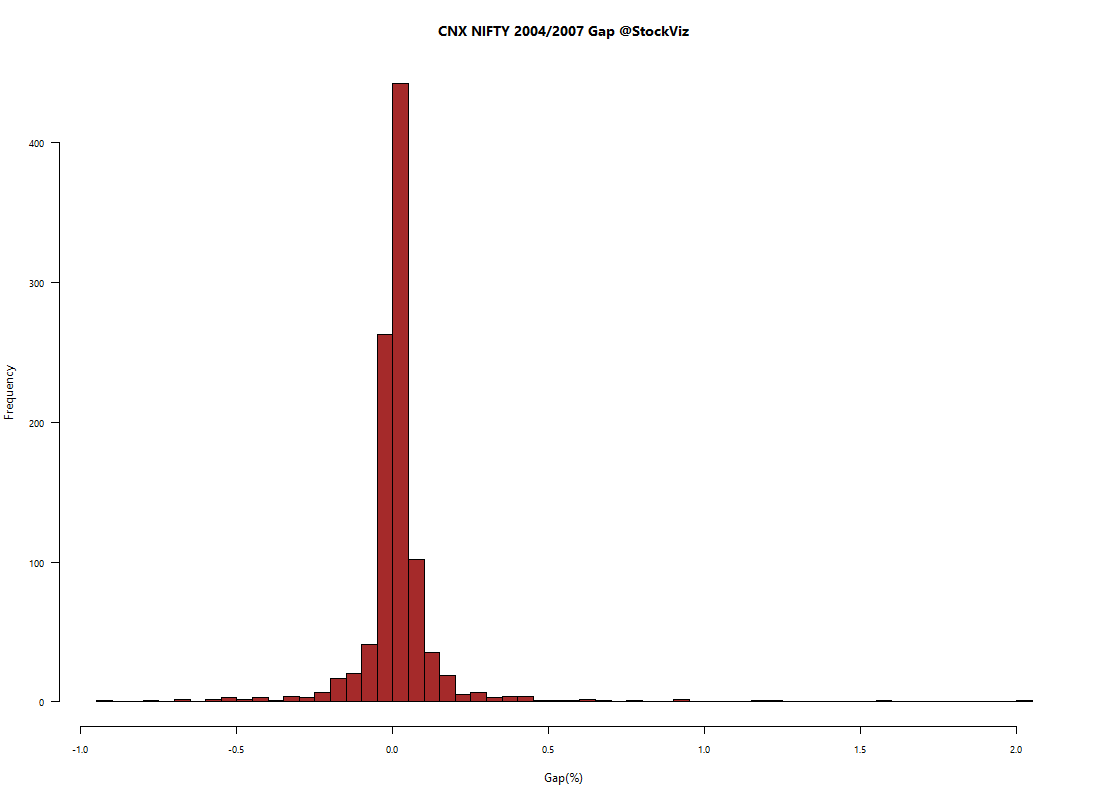
Nifty opening gaps since 2000:

CNX NIFTY.gap

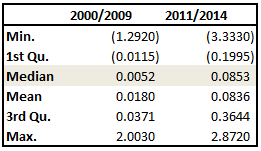
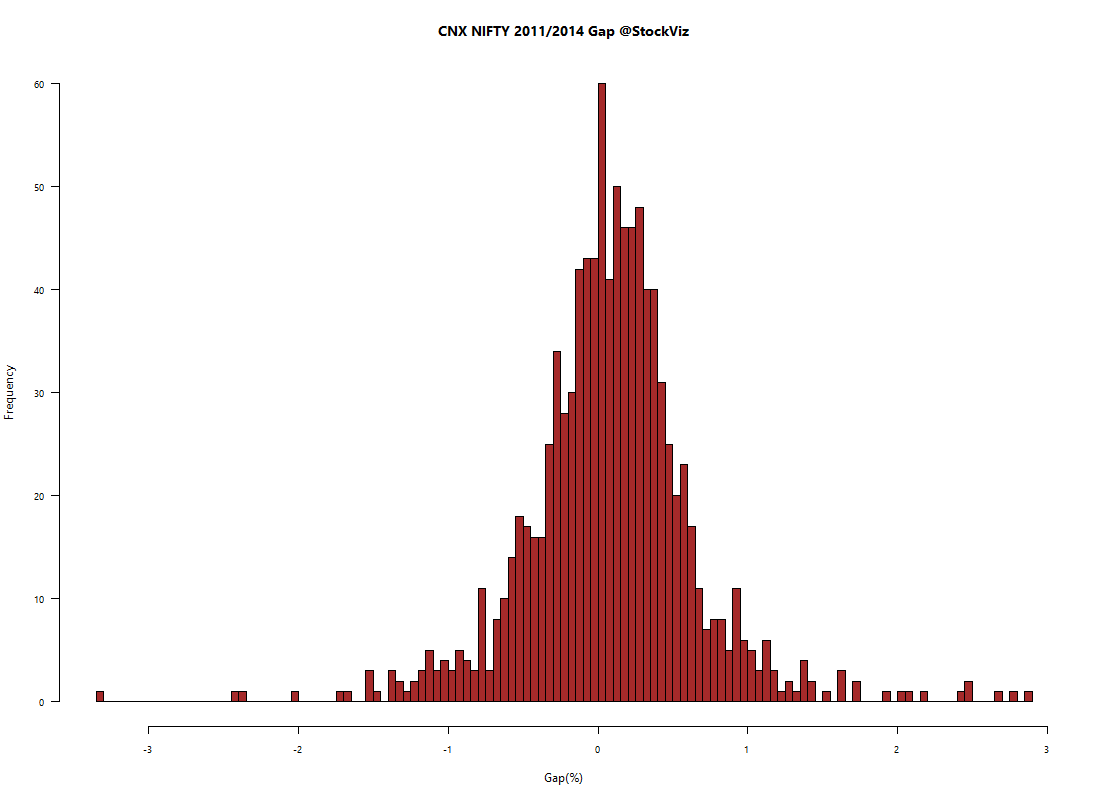
Notice the shift in the median before and after the auction was introduced (all figures in %):
gap summary

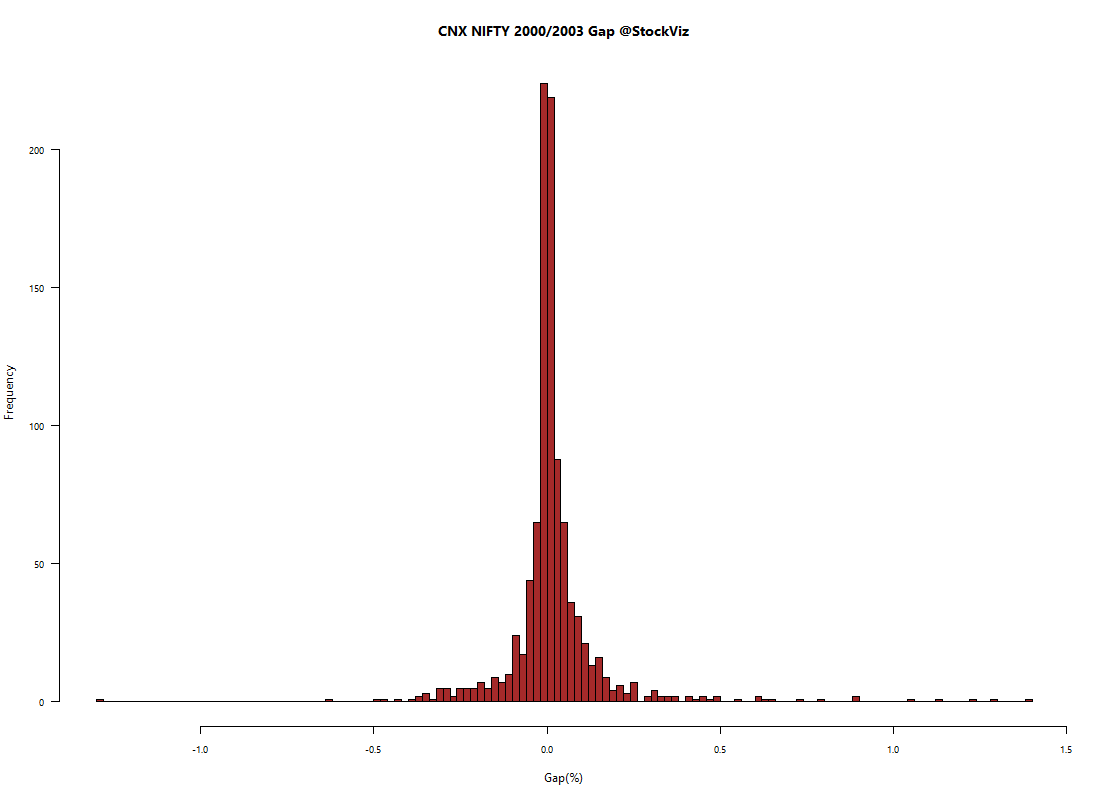
Before:
CNX NIFTY.hist.2

CNX NIFTY.hist.3

After:

CNX NIFTY.hist.4

Conclusion

One way to make the opening prices comparable is to take tick-level data and compute a synthetic opening price yourself, just like how the closing price in computed. And you can use this synthetic open across your entire data set.

Otherwise, you will have to take you back-test results with a healthy dose of skepticism and make sure that there is enough room in your analysis to account for this.

Long-Short Trend Following

Prior Work

We had discussed the SMA On/Off Switch and its ability to escape the worst days. Based on this finding, we setup a Tactical Theme that would go long NIFTYBEES and JUNIORBEES if the CNX 100 index is trading above its 50-day SMA and move into LIQUIDBEES otherwise.

What if, we could go long and short?

Naive Long-Short

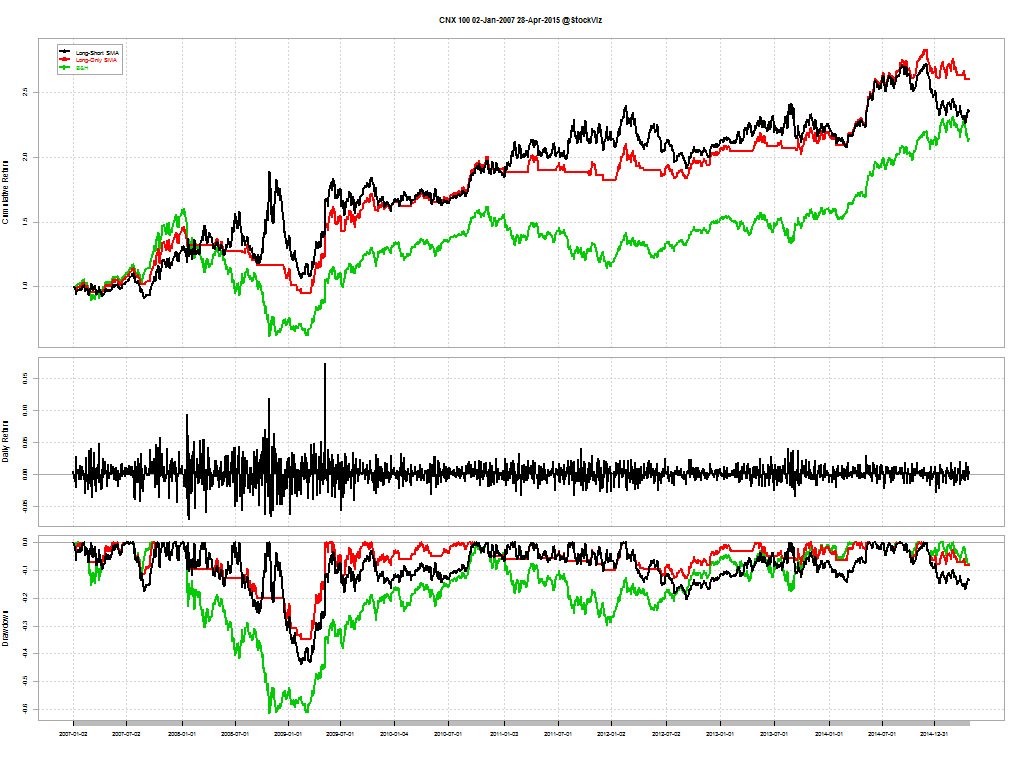
Here’s how going long above 50-DMA and short below 50-DMA on the CNX 100 since 2001 compares:

CNX 100.02-Jan-2007.28-Apr-2015.long.short
Long-Short SMA (black), Long-Only SMA (red) and Buy & Hold (green)

It looks like going both long and short is not significantly better than a long-only tactical strategy.

Long-Short with Volatility

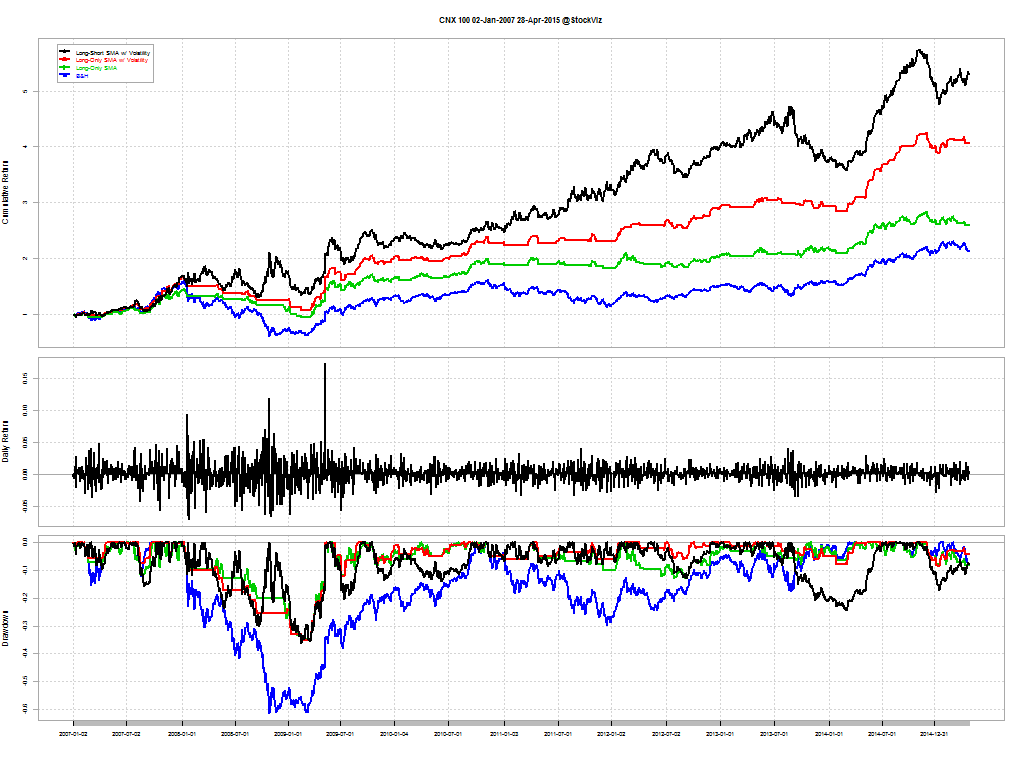
But what if, we add a volatility metric into the mix? The logic here is that corrections are preceded by a bout of volatility. So if you go short if either or the volatility signal or the 50-DMA indicates a negative bias and long otherwise:

CNX 100.02-Jan-2007.28-Apr-2015.long.short.volatility
Long-Short SMA w/ Volatility (black), Long-Only SMA w/ Volatility (red), Long-Only SMA (green) and Buy & Hold (blue)

It looks like there is significant alpha in the combination approach.

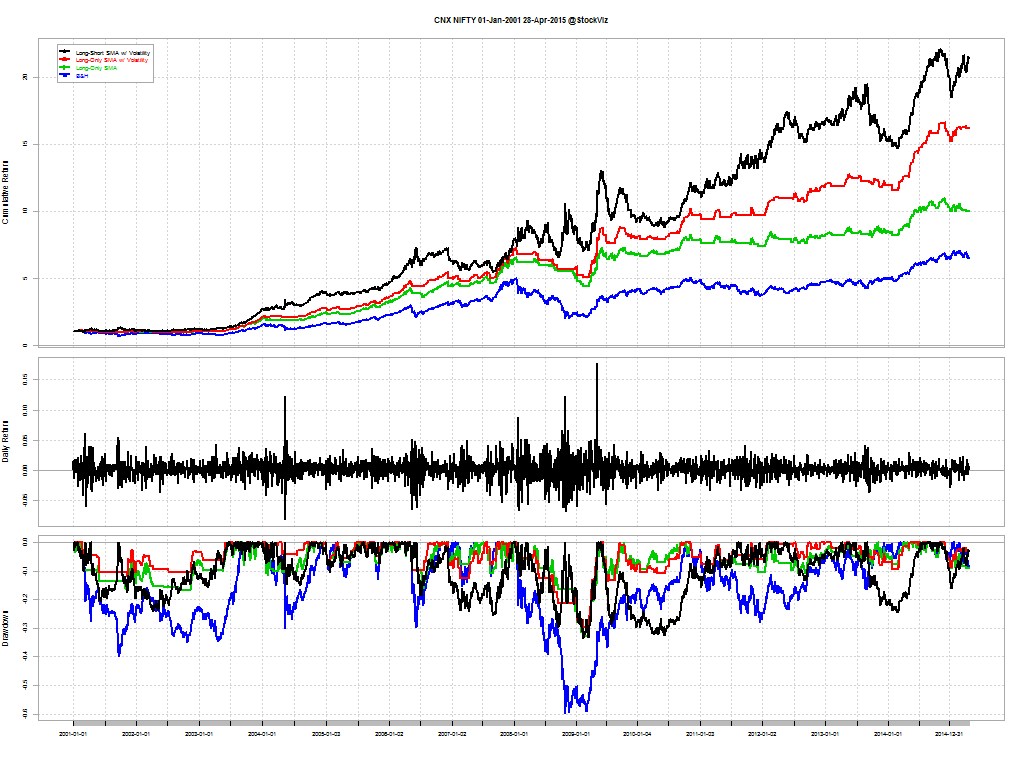
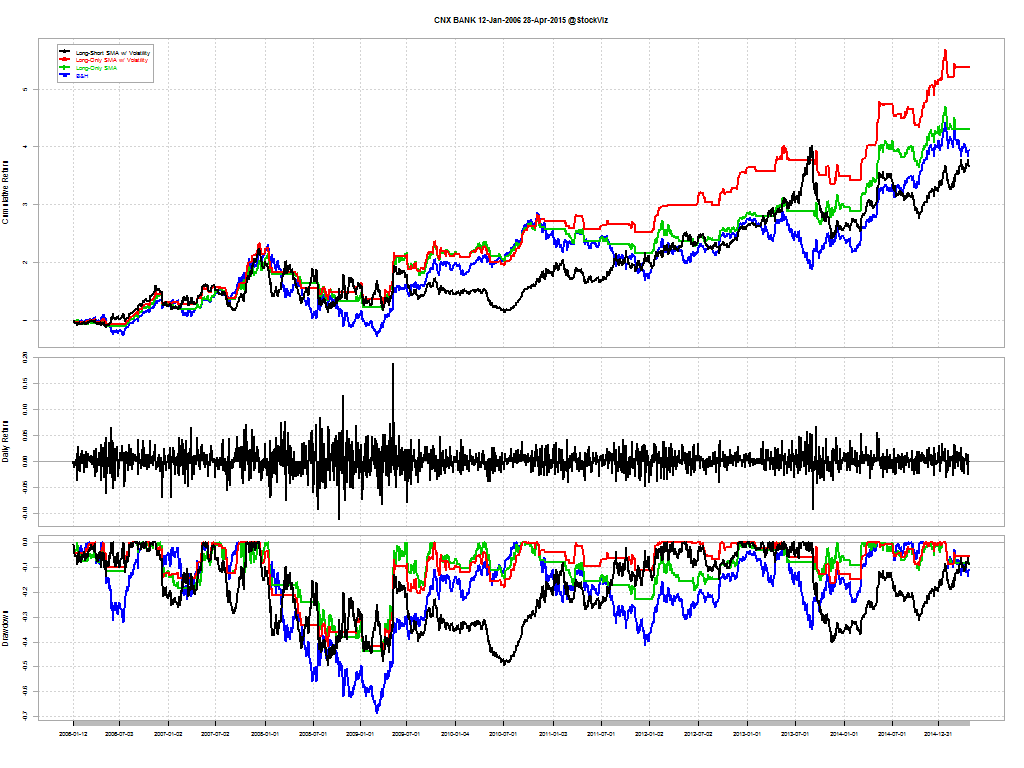
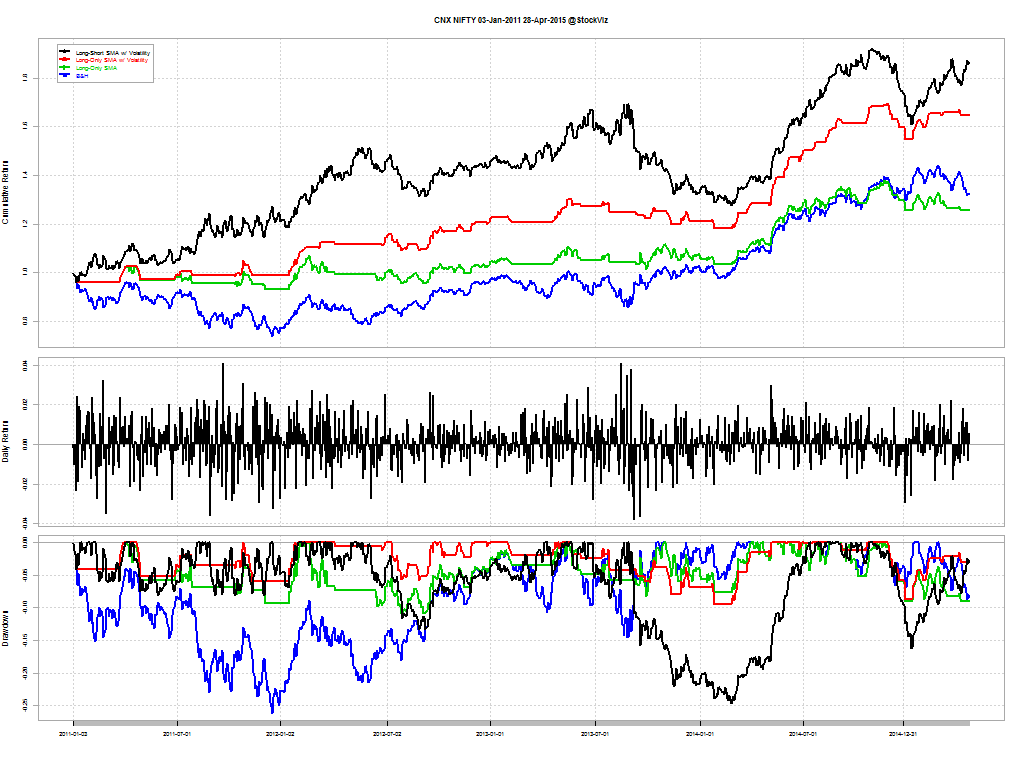
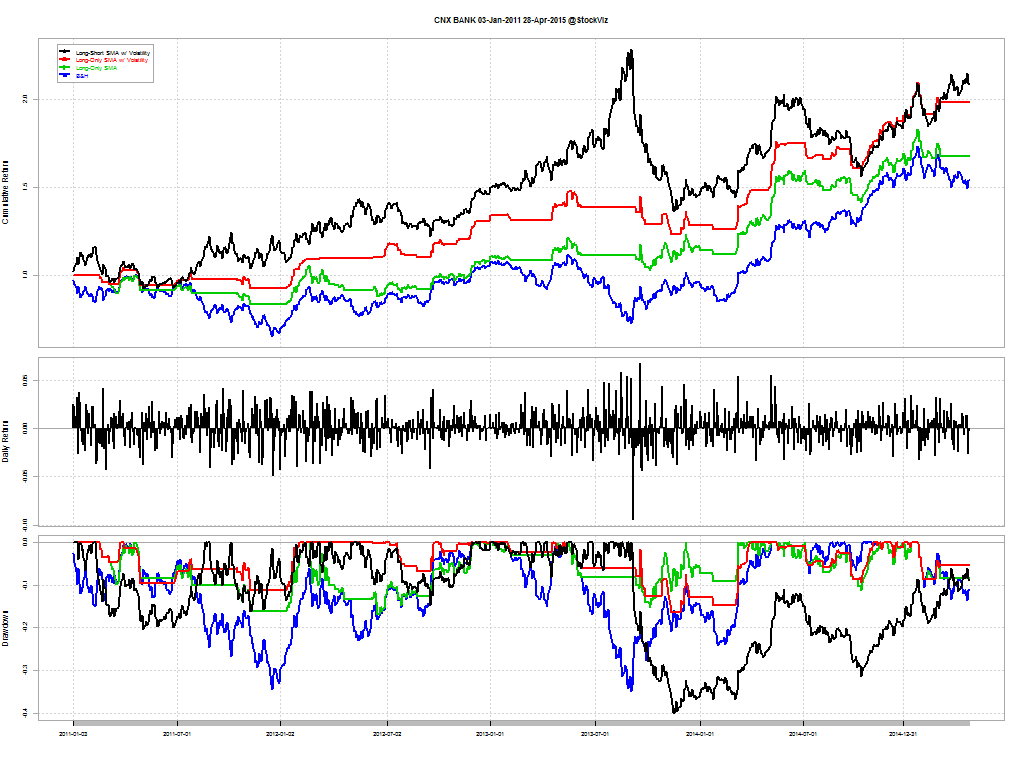
Long-Short NIFTY and BANKNIFTY

NIFTY returns since 2001:
CNX NIFTY.01-Jan-2001.28-Apr-2015.long.short.volatility

And the same for the BANK NIFTY since 2006:

CNX BANK.12-Jan-2006.28-Apr-2015.long.short.volatility

NIFTY and BANKNIFTY since 2011:

CNX NIFTY.03-Jan-2011.28-Apr-2015.long.short.volatility

CNX BANK.03-Jan-2011.28-Apr-2015.long.short.volatility

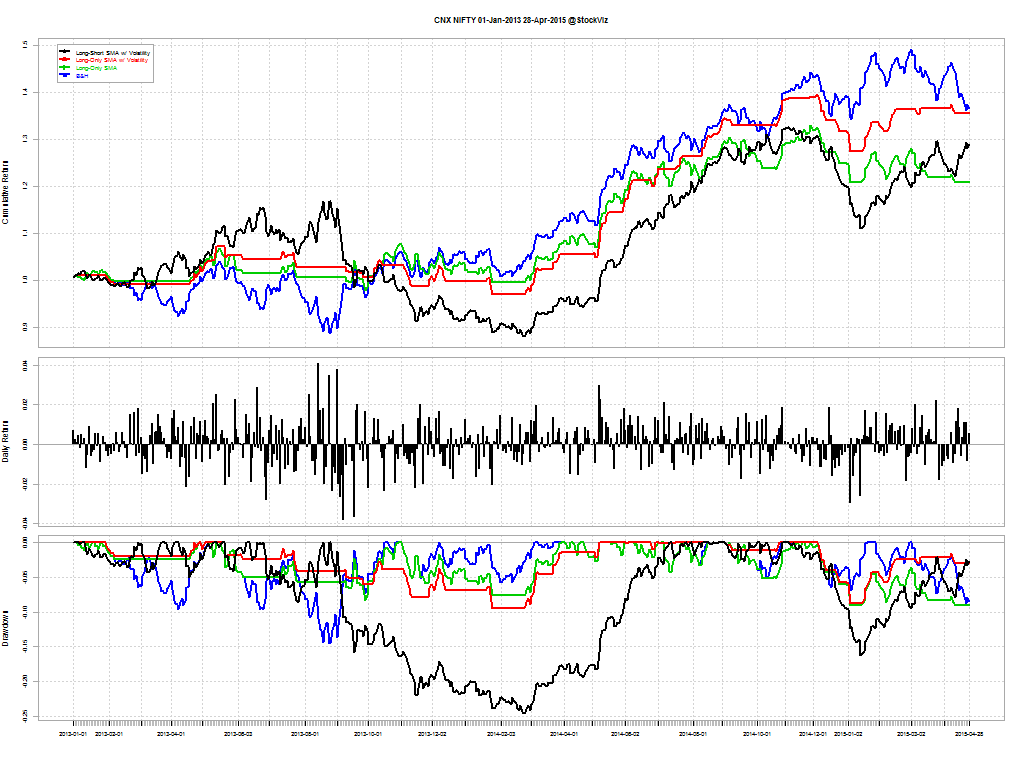
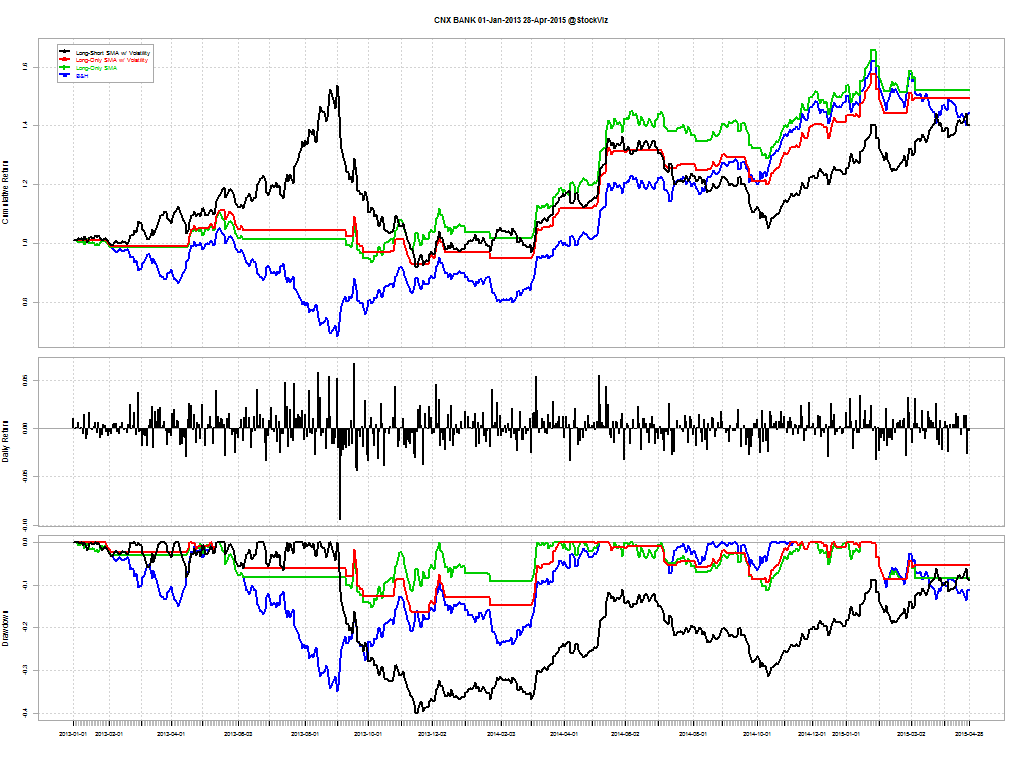
NIFTY and BANKNIFTY since 2013:

CNX NIFTY.01-Jan-2013.28-Apr-2015.long.short.volatility

CNX BANK.01-Jan-2013.28-Apr-2015.long.short.volatility
Long-Short Combo (black), Long-Only Combo (red), Long-Only Tactical (green) and Buy & Hold (blue)

Conclusion

It appears that there is long-term alpha in using a combination of volatility and 50-DMA to implement a long-short strategy. To put this to test using real-time data, we have created a theme to make it easy for you to follow along: Trend Long-Short.