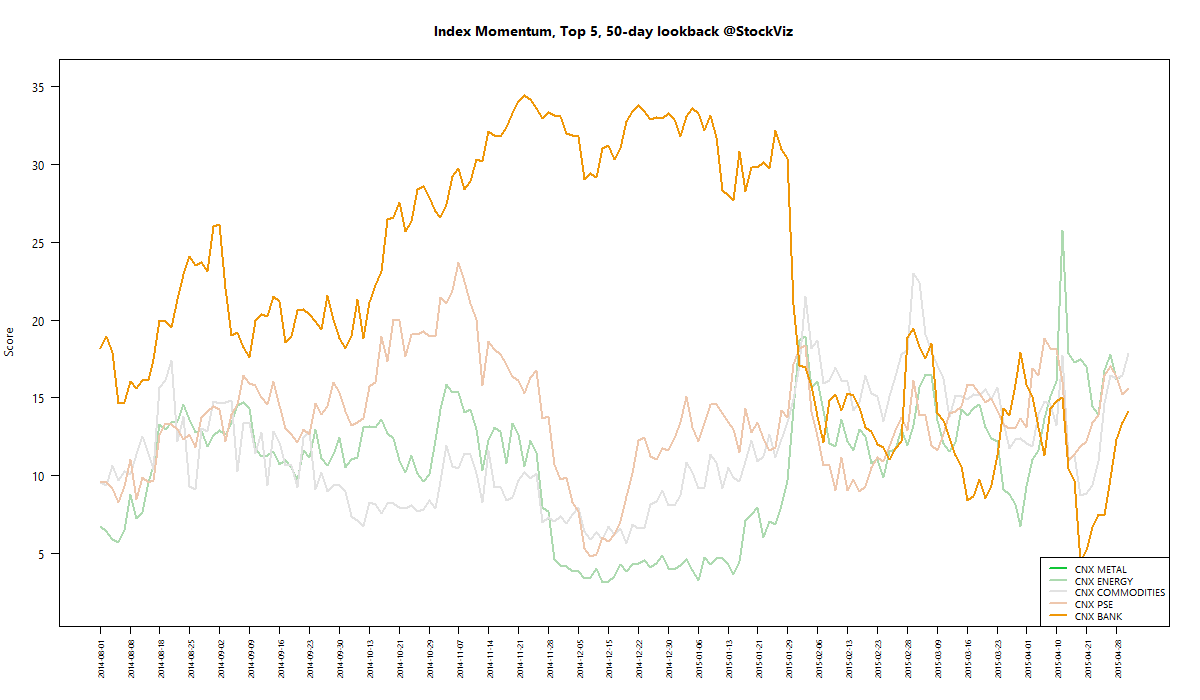
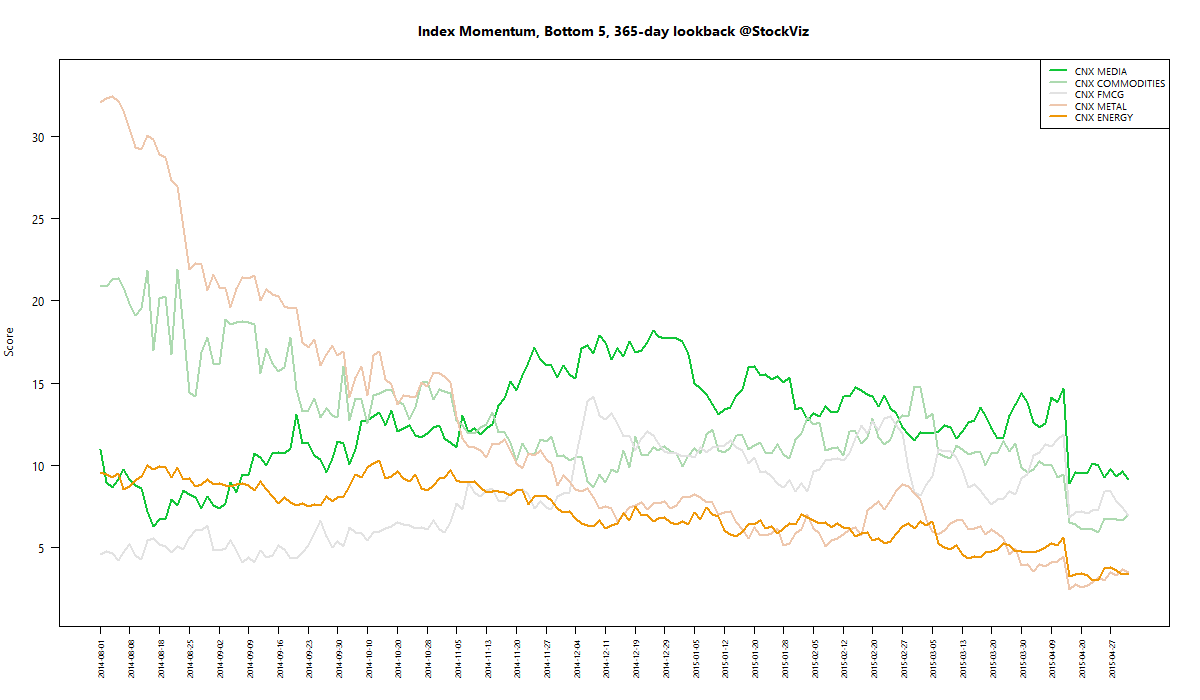
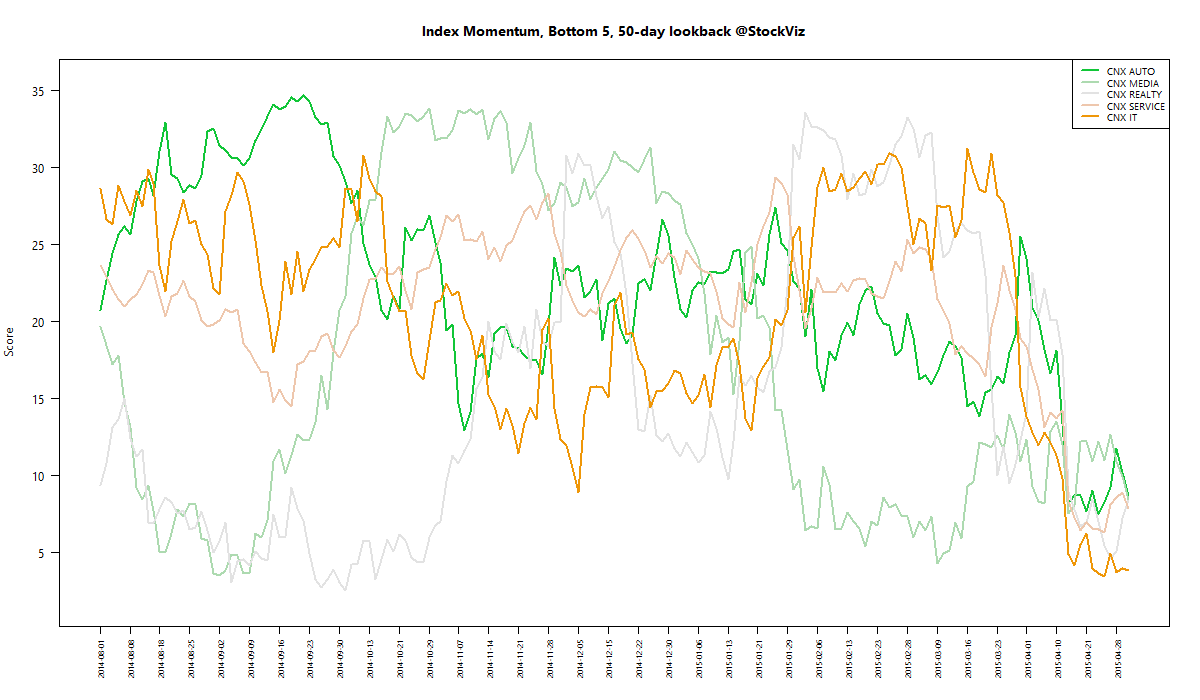
MOMENTUM
We run our proprietary momentum scoring algorithm on indices just like we do on stocks. You can use the momentum scores of sub-indices to get a sense for which sectors have the wind on their backs and those that are facing headwinds.
Traders can pick their longs in sectors with high short-term momentum and their shorts in sectors with low momentum. Investors can use the longer lookback scores to position themselves using our re-factored index Themes.
You can see how the momentum algorithm has performed on individual stocks here.
Here are the best and the worst sub-indices:

Refactored Index Performance
50-day performance, from February 16, 2015 through April 30, 2015:
Trend Model Summary
| Index | Signal | % From Peak | Day of Peak |
|---|---|---|---|
| CNX AUTO | SHORT |
10.02
|
2015-Jan-27
|
| CNX BANK | SHORT |
10.79
|
2015-Jan-27
|
| CNX ENERGY | SHORT |
30.64
|
2008-Jan-14
|
| CNX FMCG | SHORT |
12.49
|
2015-Feb-25
|
| CNX INFRA | SHORT |
49.61
|
2008-Jan-09
|
| CNX IT | SHORT |
88.48
|
2000-Feb-21
|
| CNX MEDIA | SHORT |
30.24
|
2008-Jan-04
|
| CNX METAL | SHORT |
56.27
|
2008-Jan-04
|
| CNX MNC | SHORT |
6.12
|
2015-Mar-12
|
| CNX NIFTY | SHORT |
9.06
|
2015-Mar-03
|
| CNX PHARMA | SHORT |
12.82
|
2015-Apr-08
|
| CNX PSE | SHORT |
27.16
|
2008-Jan-04
|
| CNX REALTY | SHORT |
89.10
|
2008-Jan-14
|
MNCs remain an oasis of calm in a desert landscape filled with fallen stars. Every other sector index has experienced double digit drawdowns from this year’s highs. Some indices are yet to recover from their 2008 blow offs. Are we due for a reversal?