Category: Investing Insight

Investing insight to make you a better investor.

Long-Short Trend Following

Prior Work

We had discussed the SMA On/Off Switch and its ability to escape the worst days. Based on this finding, we setup a Tactical Theme that would go long NIFTYBEES and JUNIORBEES if the CNX 100 index is trading above its 50-day SMA and move into LIQUIDBEES otherwise.

What if, we could go long and short?

Naive Long-Short

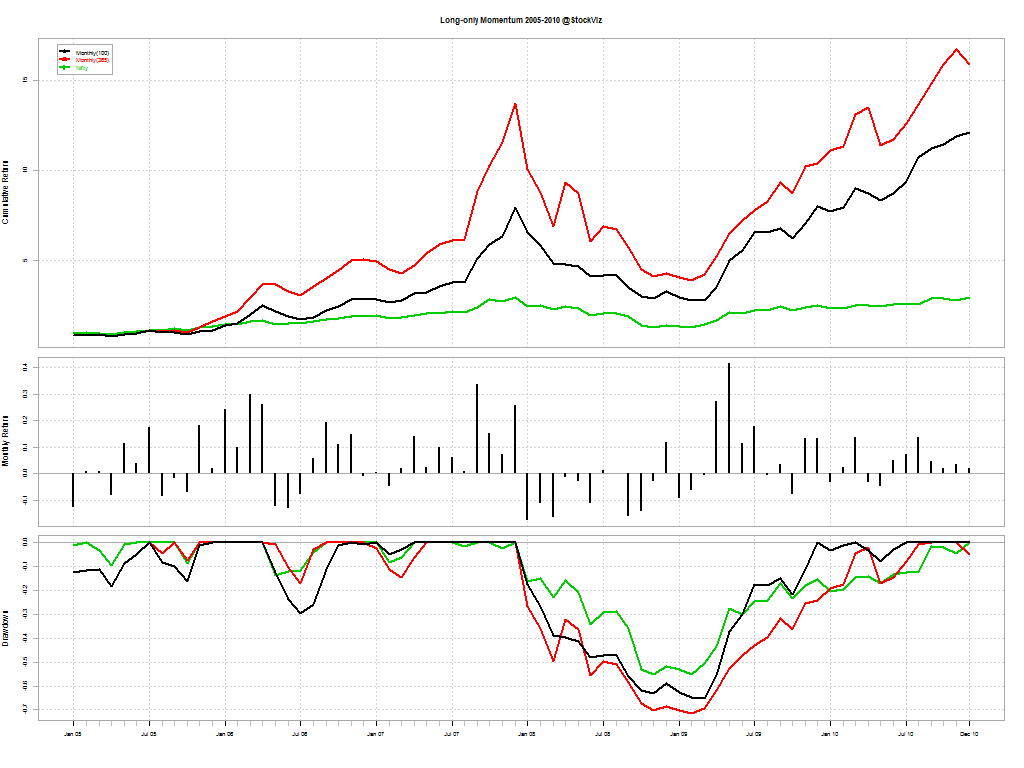
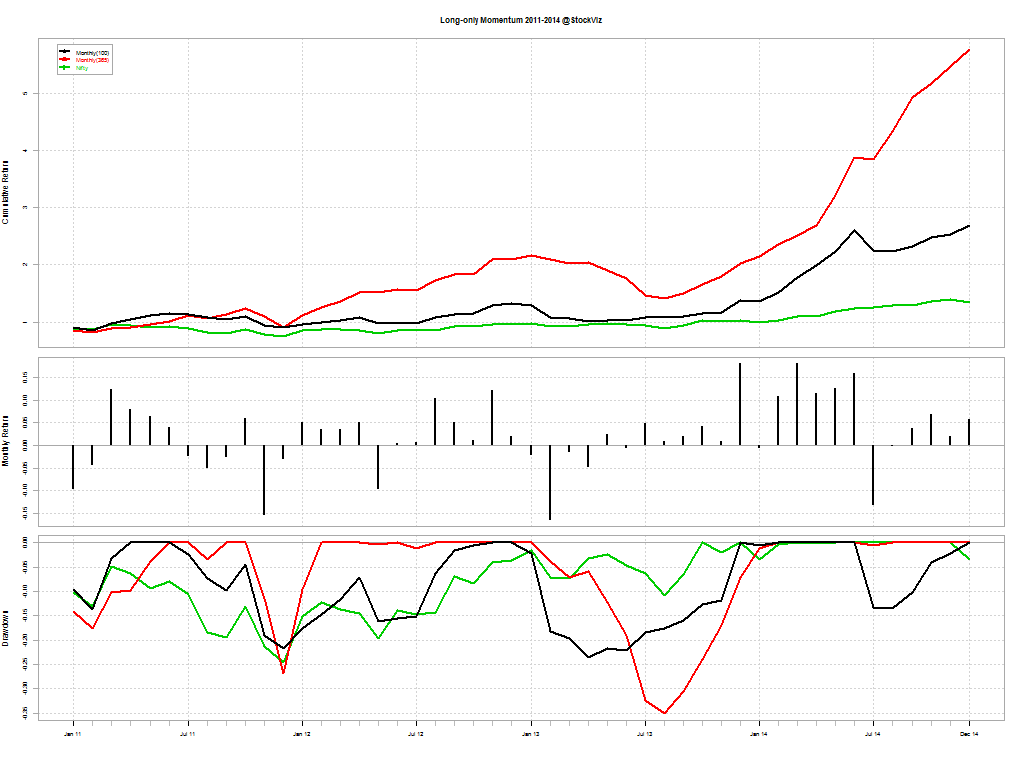
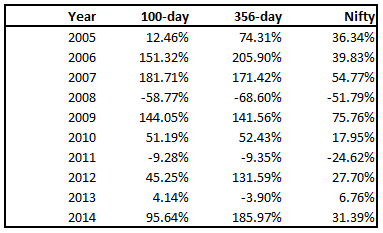
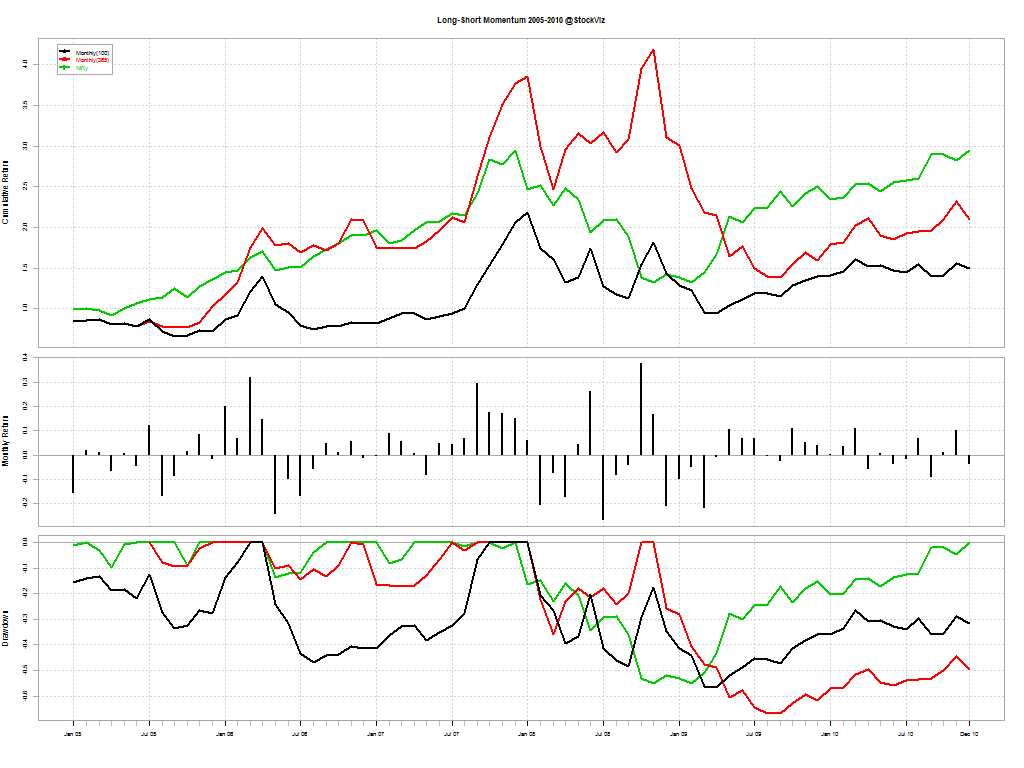
Here’s how going long above 50-DMA and short below 50-DMA on the CNX 100 since 2001 compares:

CNX 100.02-Jan-2007.28-Apr-2015.long.short
Long-Short SMA (black), Long-Only SMA (red) and Buy & Hold (green)

It looks like going both long and short is not significantly better than a long-only tactical strategy.

Long-Short with Volatility

But what if, we add a volatility metric into the mix? The logic here is that corrections are preceded by a bout of volatility. So if you go short if either or the volatility signal or the 50-DMA indicates a negative bias and long otherwise:

CNX 100.02-Jan-2007.28-Apr-2015.long.short.volatility
Long-Short SMA w/ Volatility (black), Long-Only SMA w/ Volatility (red), Long-Only SMA (green) and Buy & Hold (blue)

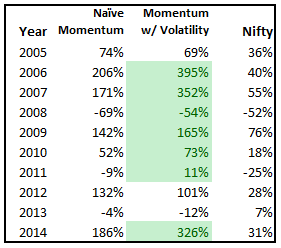
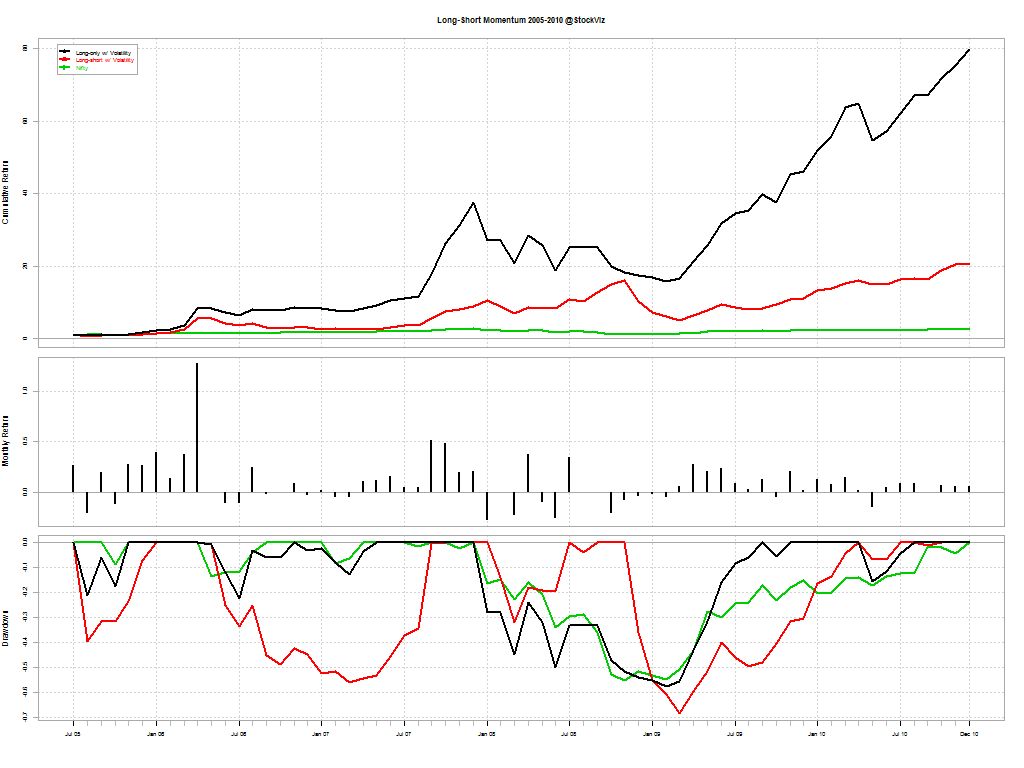
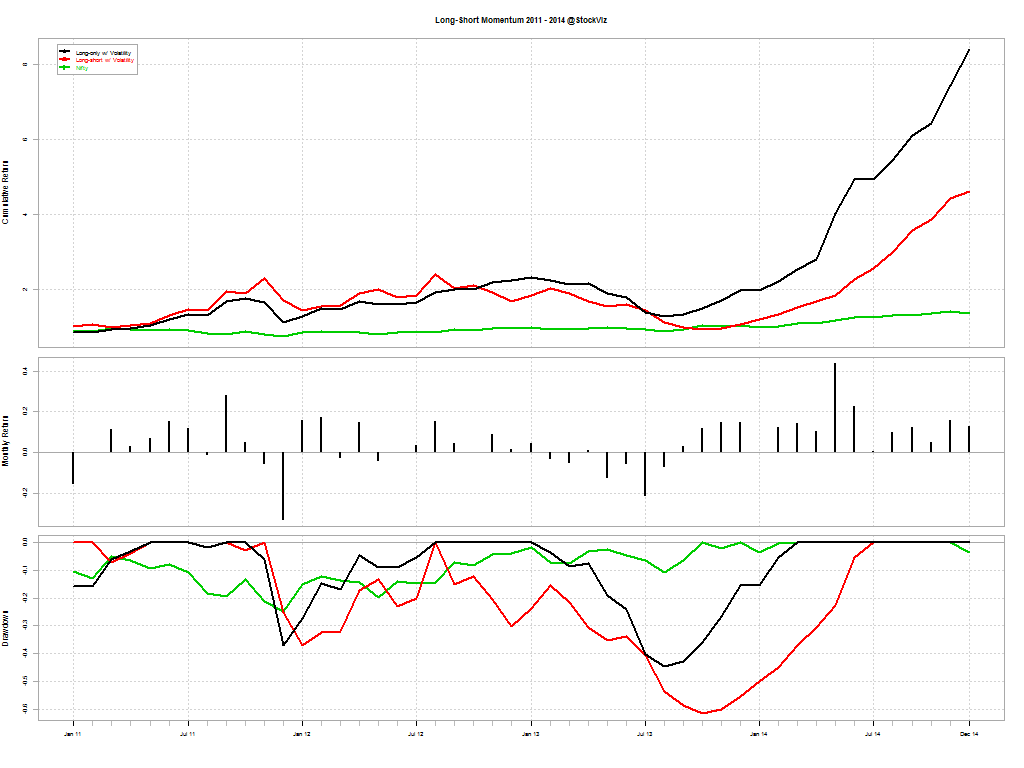
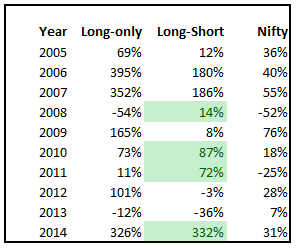
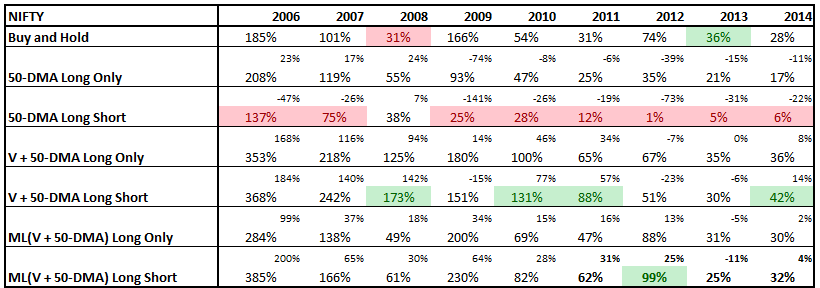
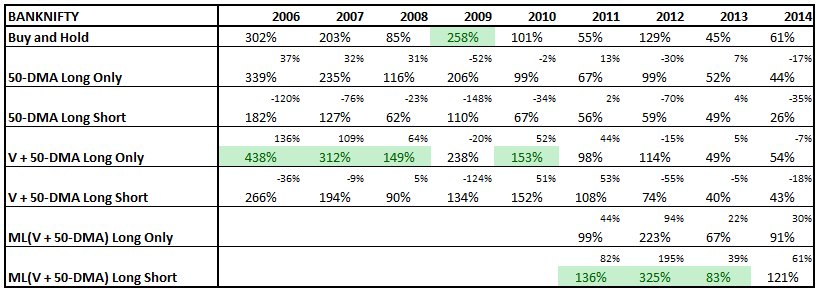
It looks like there is significant alpha in the combination approach.

Long-Short NIFTY and BANKNIFTY

NIFTY returns since 2001:
CNX NIFTY.01-Jan-2001.28-Apr-2015.long.short.volatility

And the same for the BANK NIFTY since 2006:

CNX BANK.12-Jan-2006.28-Apr-2015.long.short.volatility

NIFTY and BANKNIFTY since 2011:

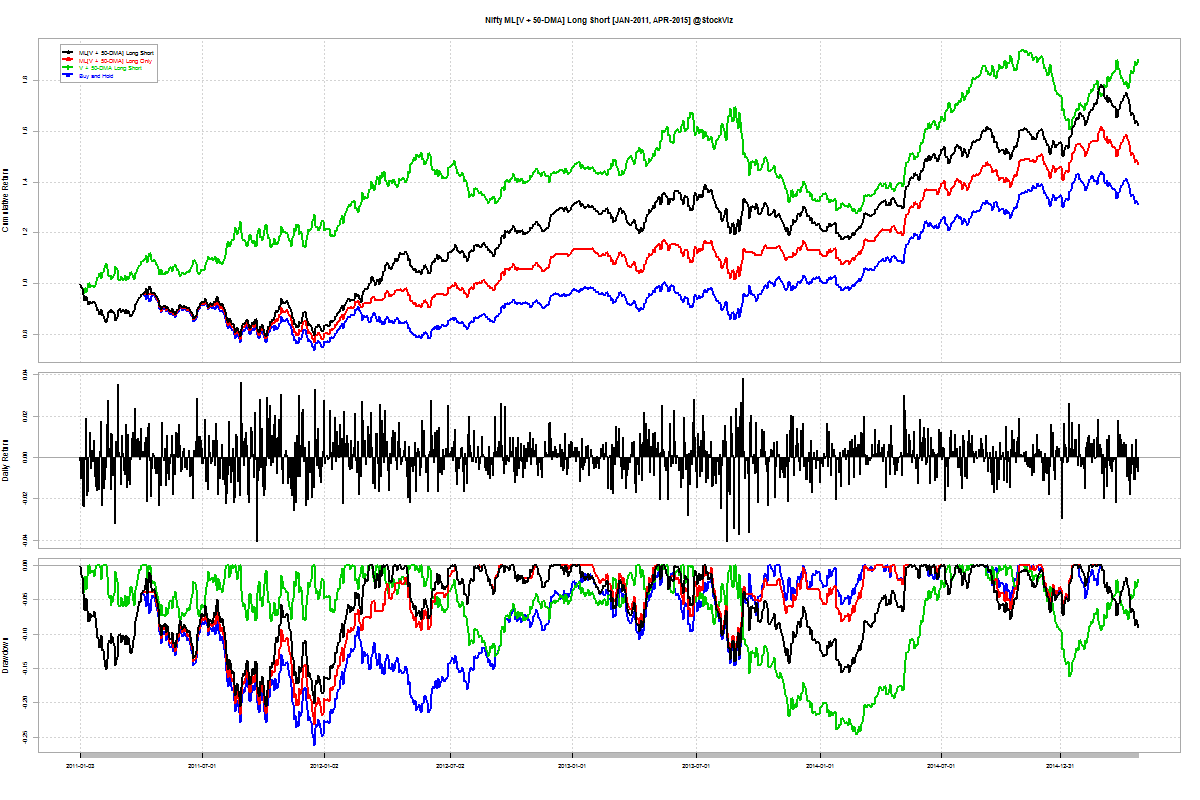
CNX NIFTY.03-Jan-2011.28-Apr-2015.long.short.volatility

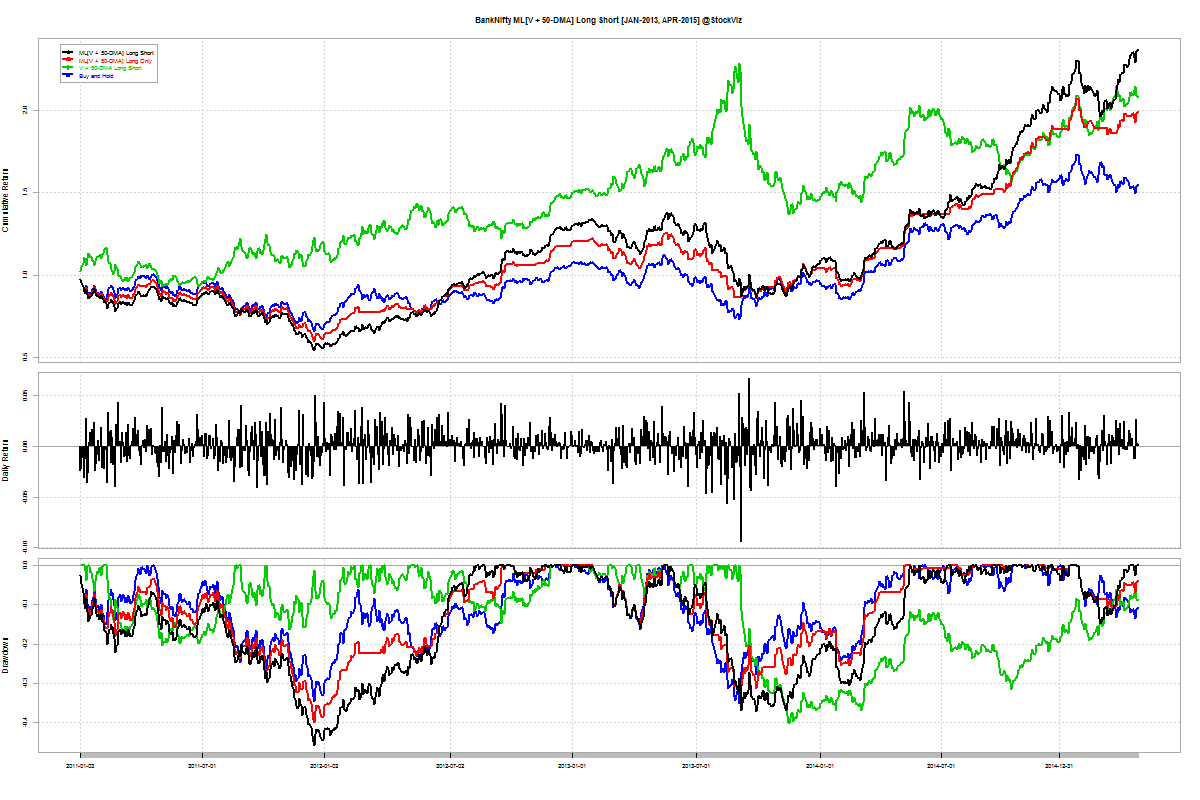
CNX BANK.03-Jan-2011.28-Apr-2015.long.short.volatility

NIFTY and BANKNIFTY since 2013:

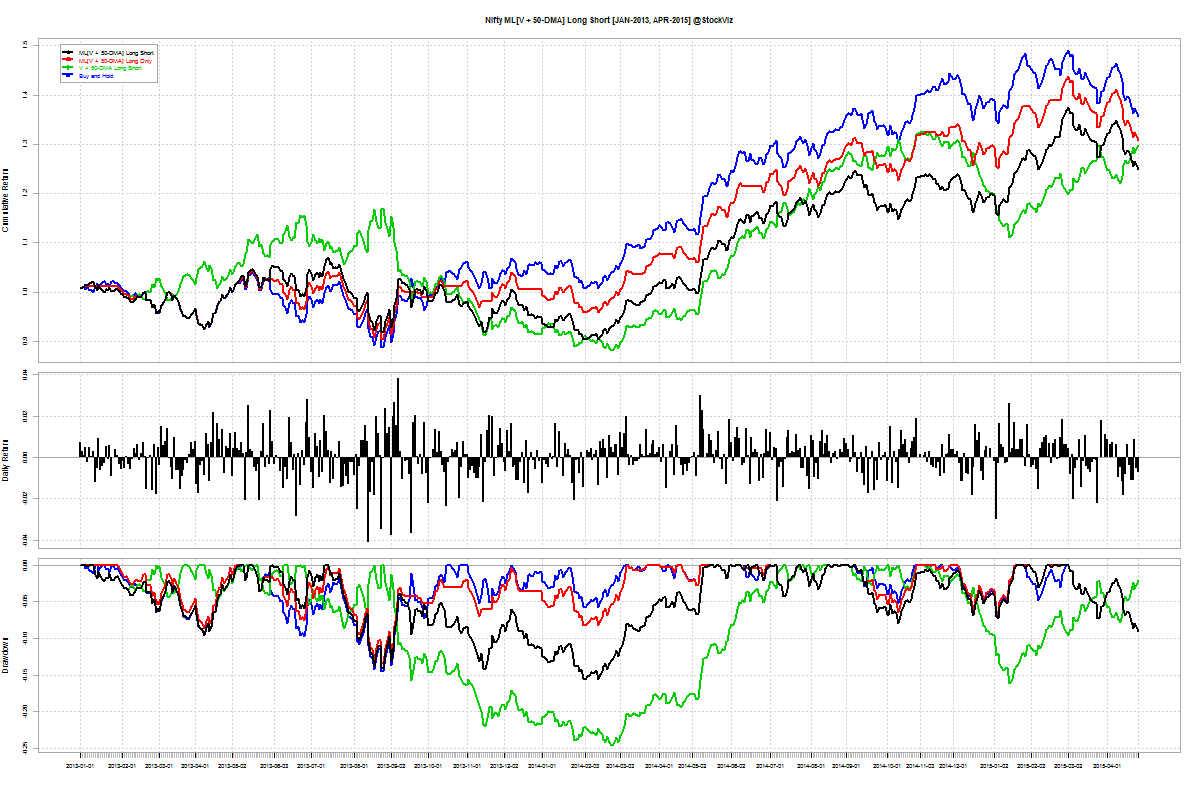
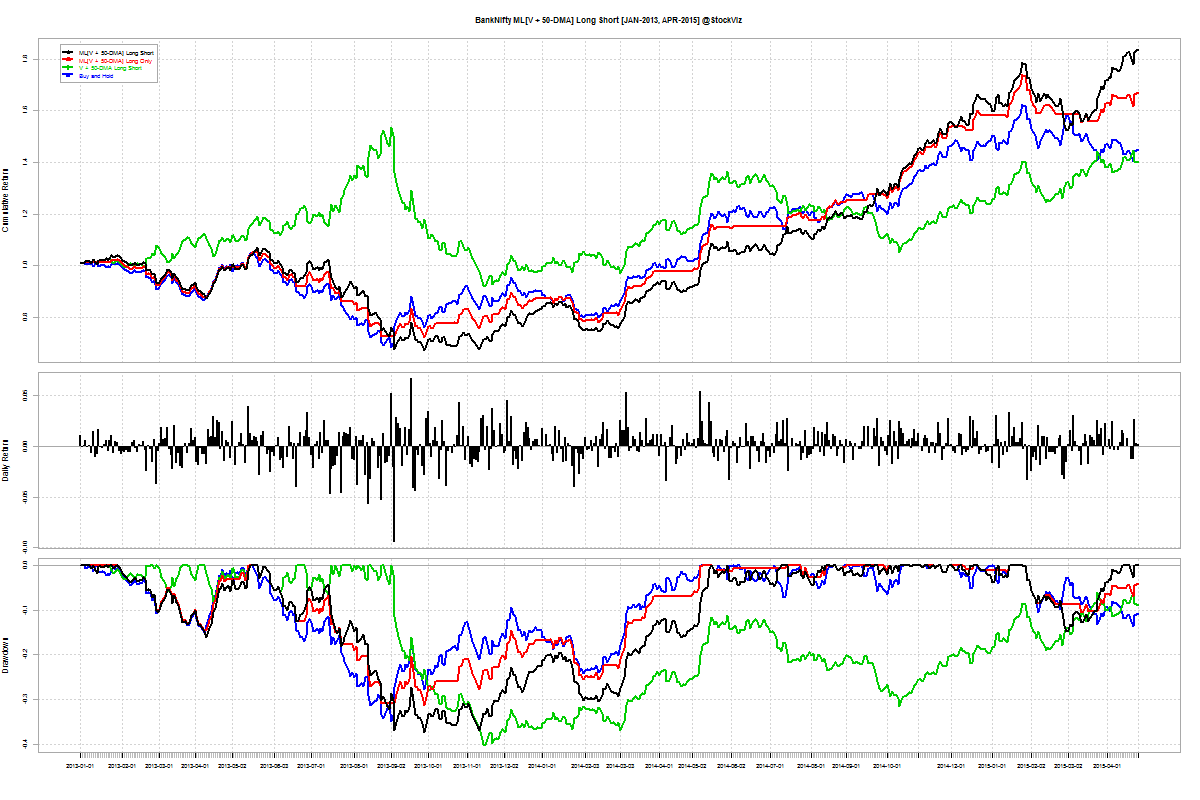
CNX NIFTY.01-Jan-2013.28-Apr-2015.long.short.volatility

CNX BANK.01-Jan-2013.28-Apr-2015.long.short.volatility
Long-Short Combo (black), Long-Only Combo (red), Long-Only Tactical (green) and Buy & Hold (blue)

Conclusion

It appears that there is long-term alpha in using a combination of volatility and 50-DMA to implement a long-short strategy. To put this to test using real-time data, we have created a theme to make it easy for you to follow along: Trend Long-Short.

Analyzing the Analysts

When we analyzed the price targets of various research analysts for last year, this is what we found:

Most ‘BUY’ ratings were on stocks that had already gone up significantly. The previous 100-day returns before a ‘BUY’ was announced were +23.29% (mean) and +21.49% (median). The next 100-day returns of the same set of stocks were +18.24% (mean) / +17.98% (median.)

For stocks rated ‘SELL’, the previous 100-day returns were +16.93%/+18.47% (mean/median). And they ended up under-performing the ‘BUY’ pool of stocks: +12.50%/+14.14%. But only a brave soul would have gone short in 2014. Even the next 5-day returns for ‘SELL’ rated stocks were +1.22%/0.77%.

One can be excused for thinking that analysts were just chasing momentum, given the above summaries.

BUY’s did not seem to have a dominant short-term effect:
5-day : +0.97%/+0.76%
20-day: +3.78%/+2.90%
50-day: +11.03%/+11.40%

On an average, they did out-perform the CNX 100 index. Next 100-day CNX 100 returns:
BUYs: +12.33%/+11.67%
SELLs: +13.23%/+12.04%

Out of the 718 ratings we analyzed for the year 2014, 565 (~79%) were BUYs and 12.25% were SELLs.

It will be interesting to see how they do this year.

You can download the data here.

Leaders and Laggards

Lagged correlations

Excess winter snow-fall in the Himalayas lead to floods in Bangladesh during spring. If we know that that there was excess snow-fall in the Himalayas this season, we can be better prepared to handle the floods four-months from now. This is the idea behind studying lagged correlations.

If we took a pair of sector indices and lagged their returns, can we find an index that “leads” an other and profit from it?

CNX BANK.CNX CONSUMPTION.monthly.lag

The chart above is called the cross-correlation plot. It shows that there are two lags, 5 and 9, where CNX BANK lags CONSUMPTION. A scatter plot shows how monthly-returns are correlated to each other across different lags and confirms the relationship:

CNX BANK.CNX CONSUMPTION.monthly.scatter

Finding

We found a number of index pairs that lead/follow one another. In addition to the CNX BANK and CNX CONSUMPTION indices above, CNX INFRA and CNX CONSUMPTION, CNX IT and CNX FINANCE, CNX CONSUMPTION and AUTO display this dynamic.

CNX INFRA.CNX CONSUMPTION.monthly.lag

CNX IT.CNX FINANCE.monthly.lag

CNX CONSUMPTION.AUTO.monthly.lag

Data mining warning

We cannot draw any conclusion from this “finding.” We mined 20 indices over 5 years to dig these nuggets out. The result is spurious. From a statistical point of view, there is no index that consistently leads or lags another.

Related: Should you care about monthly returns of the Nifty?

The MNC Fund Gravy Train

What are MNC Funds?

MNC funds invest in the Indian listed shares of foreign firms, like Bosch, Britannia and Colgate Palmolive. The funds are bench-marked against the CNX MNC Index.

The MNC index has out-performed pretty much every other market-cap index. We had discussed this previously and had pointed out that the UTI MNC Fund is decent place to get exposure to this asset class.

UTI vs Birla Sun Life

Thankfully, there are only two funds that track this asset class – one is the UTI MNC Fund and the other is the Birla Sun Life MNC Fund. Here’s how their growth schemes compare:

Birla Sun Life MNC fund vs. UTI MNC fund


Between 2006-07-03 and 2015-03-19, BSL MNC Fundhas returned a cumulative 478.61% with an IRR of 22.31% vs. UTI MNC Fund’s cumulative return of 427.17% and an IRR of 21.02%. (http://svz.bz/1Exk126)

The difference in performance between the two funds is de minimis when you consider that the period of comparison is almost eight years. The main thing to focus on here is that an IRR of ~22% is extremely hard to achieve in any asset class over that stretch of time.

MNC.funds.2015-3-20

Active Management

SYMBOL Birla Sunlife MNC Fund UTI MNC Fund CNX MNC
INGVYSYABK 8.97 3.01
ICRA 8.67
HONAUT 8.53 3.48
BAYERCROP 8.33
BOSCHLTD 5.99 7.19 9.22
GILLETTE 5.89 2.71
GLAXO 5.48 1.44 2.59
PFIZER 5.15 1.38
MARUTI 3.62 7.16 18.09
STERLINH 3.61
CRISIL 3.01 2.92
HINDUNILVR 2.74 4.21 24.37
CUMMINSIND 2.73 4.36 4.38
WABCOINDIA 2.47 0.32
ACC 1.96
BATAINDIA 1.65
HITACHIHOM 1.64
FAGBEARING 1.47
KANSAINER 1.45
COLPAL 1.39 1.33 5.02
PGHH 1.35 1.92
OFSS 1.15 2.43 2.62
SMLISUZU 1.15 0.12
AMBUJACEM 1.11 3.64 7.25
NESTLEIND 0.94 1.38
ALSTOMT&D 0.72 1.76
BLUEDART 0.71 0.58
SIEMENS 0.7 3.04 4.66
FMGOETZE 0.69
ITC 0.66
AIL 0.59 0.17
DISAQ 0.57
AKZOINDIA 0.53 1.6
FULFORD 0.52
ABB 0.49 2.51
SANOFI 0.46 1.41
ITDCEM 0.46 2.31
CASTROLIND 0.45 2.97 2.59
RANBAXY 0.36 0.58
SCHNEIDER 0.26
MPHASIS 0.07 2.33 1.2
EICHERMOT 6.28
BRITANNIA 4.17 4.84
MCDOWELL-N 2.53
SKFINDIA 2.47
MAHINDCIE 2.13
SSLT 1.95 7.96
INGERRAND 1.49
MONSANTO 1.13
TIMKEN 1.07
CLNINDIA 0.97
GSKCONS 0.9 2.69
AUTOAXLES 0.38
WHIRLPOOL 0.21
Both funds are actively managed. There is no “index-hugging” going on here. However, between the two, the Birla Sunlife fund significantly differs from the CNX MNC index.

Portfolio trajectories

Both have allowed their winners to run and have different positions that have worked out well for them. Here’s how the Birla Sunlife Fund looks like:

And this is how the UTI Fund looks like:

The View

You will do well to have either fund in your portfolio. But given the narrow focus of these funds, these should complement your portfolio rather than dominate it. If you have any questions, feel free to get in touch!