Introduction
In Part II of our Practical Momentum series, we saw how adding a volatility adjustment significantly improved portfolio returns. However, we were left with a nagging observation that long-only returns were much higher than long-short returns. The problem with a long-only futures portfolio is that draw-downs can wipe you out. But what if we hedged the portfolio?
You can hedge a portfolio in two ways: (a) buy individual put options, and (b) calculate the beta of the portfolio and short an appropriate multiple of NIFTY futures. The problem with option (b) is that it will not protect you against idiosyncratic risk. For example, say you are long a pharma stock and the USFDA issues an import alert, the stock will tank irrespective of the NIFTY. So for the purposes of this simulation, we will try option (a)
Hedged Long-Only Momentum
With 5 long-futures hedged with long put-options below the purchase price:
black line shows long-only; red shows hedged long-only
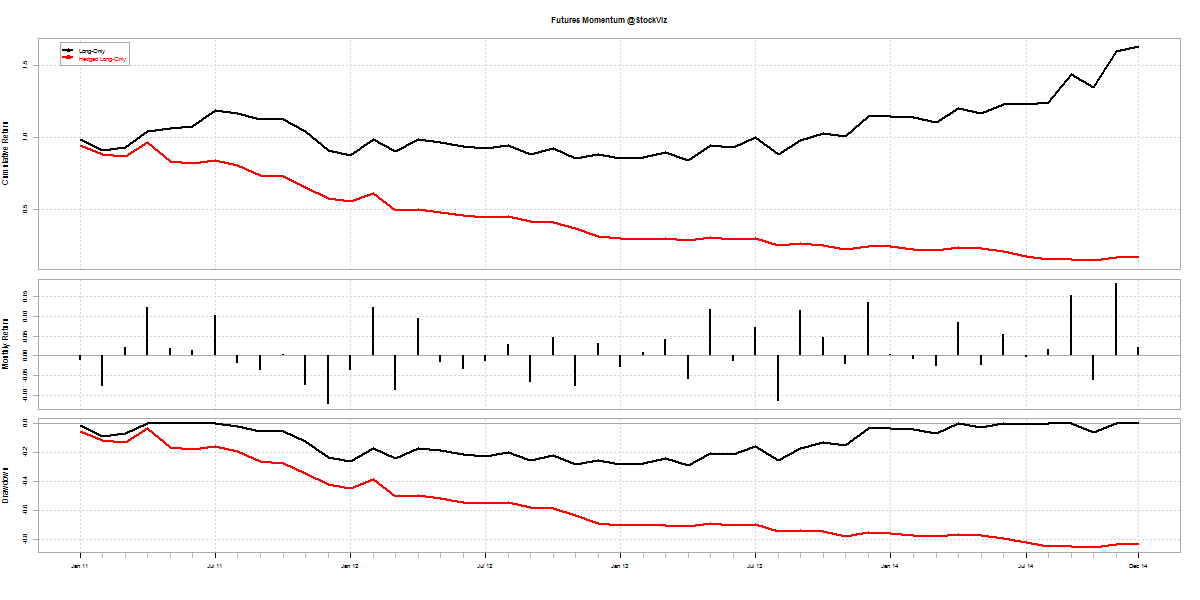
A portfolio hedged with single-name put options performs poorly:
- There is always a d between the option payout and the underlying
- ?-decay eats away more of the option value than the protection it offers
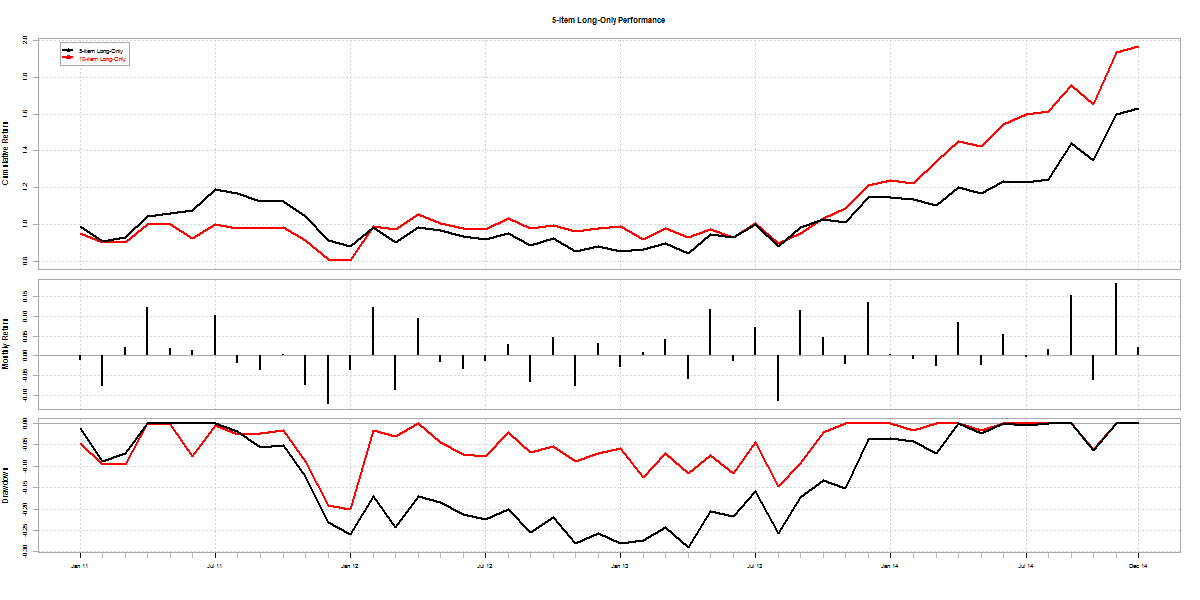
Another way to make draw-downs shallower is to diversify. When we increased the number of stocks in our long-only equity momentum portfolio from 10 to 20, it reduced portfolio volatility and boosted returns. Here’s how a 10-count long-only momentum portfolio compares with the 5 from above:
black line shows a 5-item long-only portfolio returns; red shows 10
Conclusion
The problem with leveraged momentum is that losses can wipe you out. Hedging it with single-name options doesn’t work. Are we stuck with unlevered momentum? We will explore this in the next post. Stay tuned!