Prior Work
We had discussed the SMA On/Off Switch and its ability to escape the worst days. Based on this finding, we setup a Tactical Theme that would go long NIFTYBEES and JUNIORBEES if the CNX 100 index is trading above its 50-day SMA and move into LIQUIDBEES otherwise.
What if, we could go long and short?
Naive Long-Short
Here’s how going long above 50-DMA and short below 50-DMA on the CNX 100 since 2001 compares:
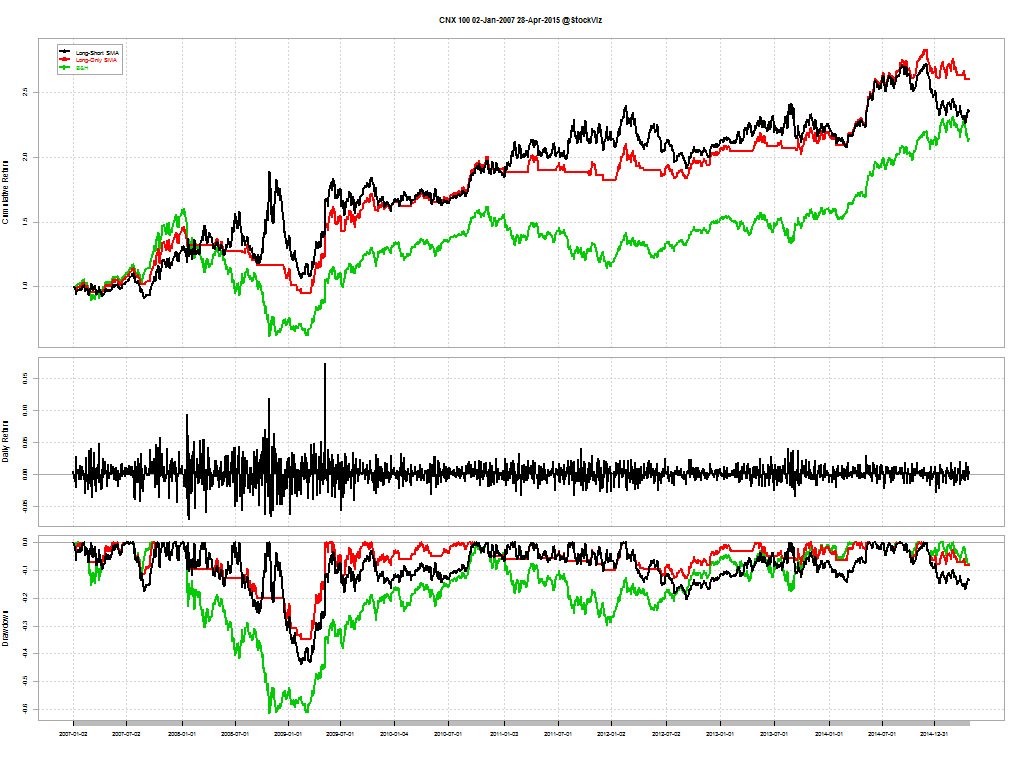
Long-Short SMA (black), Long-Only SMA (red) and Buy & Hold (green)
It looks like going both long and short is not significantly better than a long-only tactical strategy.
Long-Short with Volatility
But what if, we add a volatility metric into the mix? The logic here is that corrections are preceded by a bout of volatility. So if you go short if either or the volatility signal or the 50-DMA indicates a negative bias and long otherwise:
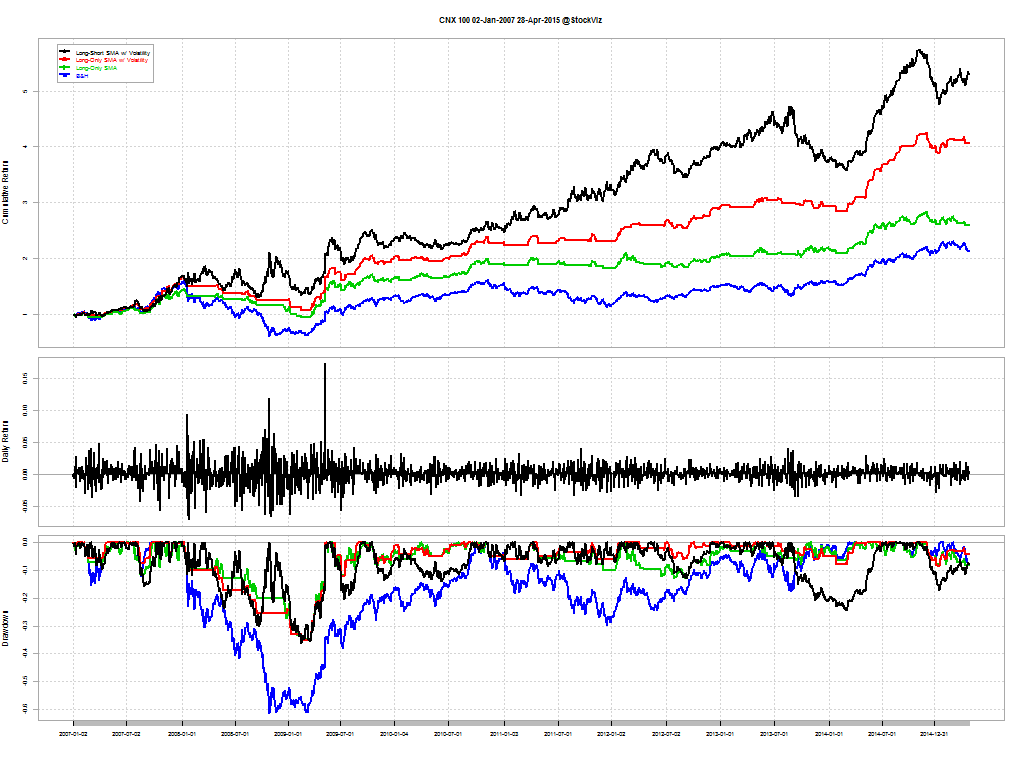
Long-Short SMA w/ Volatility (black), Long-Only SMA w/ Volatility (red), Long-Only SMA (green) and Buy & Hold (blue)
It looks like there is significant alpha in the combination approach.
Long-Short NIFTY and BANKNIFTY
NIFTY returns since 2001:

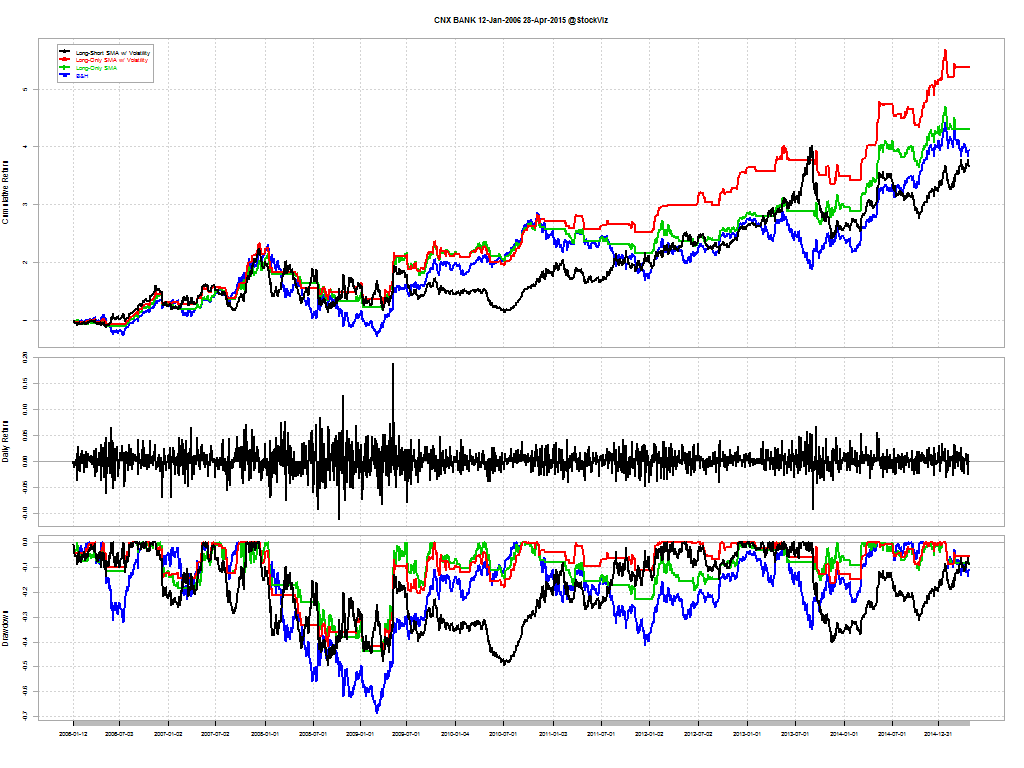
And the same for the BANK NIFTY since 2006:
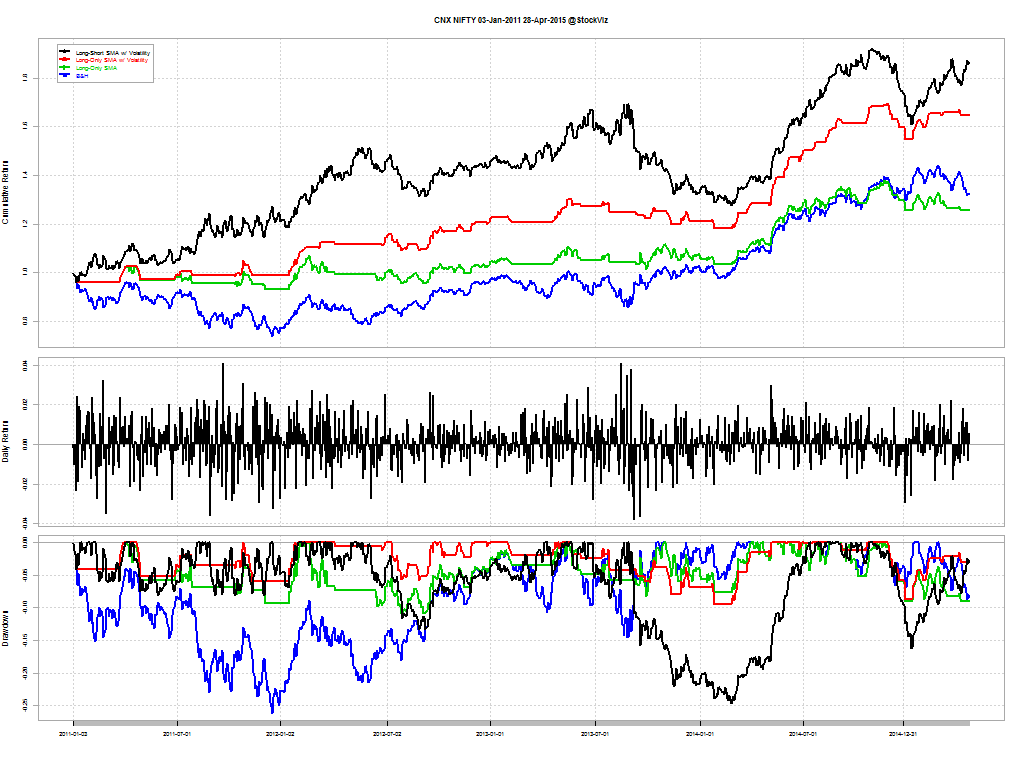
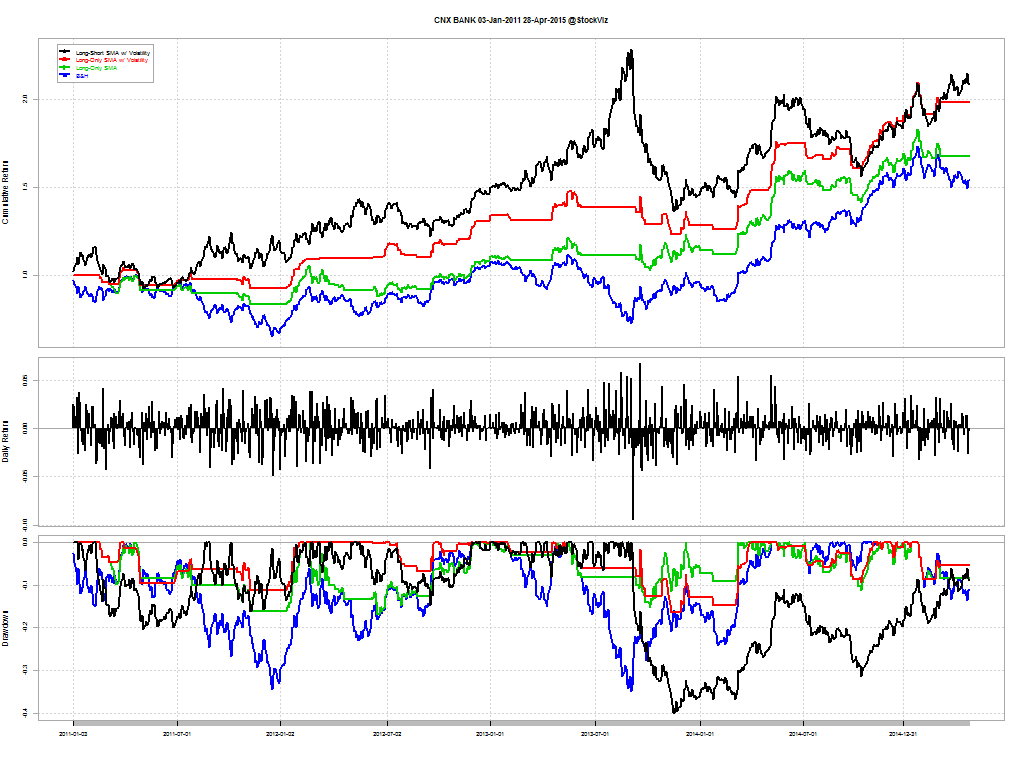
NIFTY and BANKNIFTY since 2011:
NIFTY and BANKNIFTY since 2013:
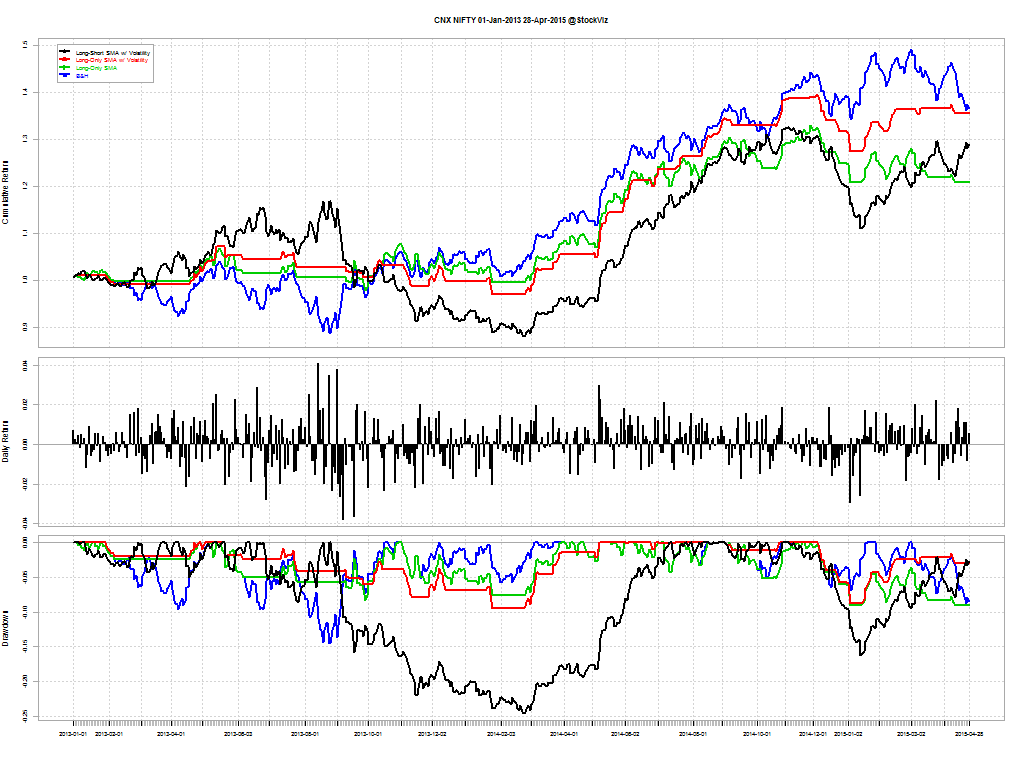
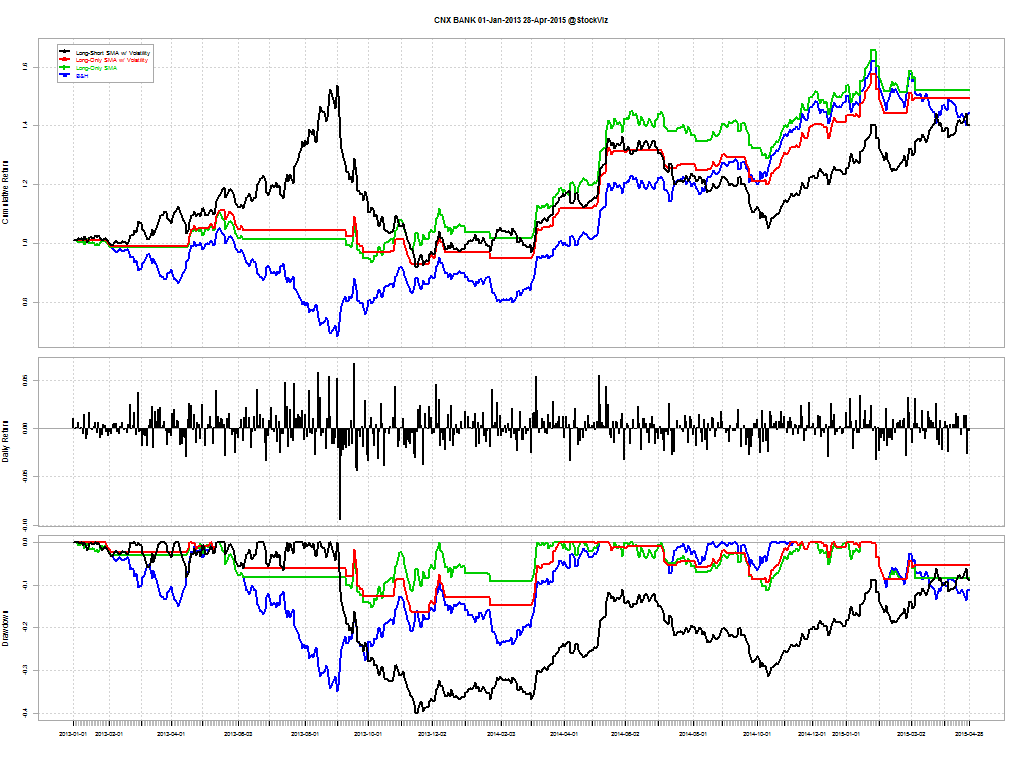
Long-Short Combo (black), Long-Only Combo (red), Long-Only Tactical (green) and Buy & Hold (blue)
Conclusion
It appears that there is long-term alpha in using a combination of volatility and 50-DMA to implement a long-short strategy. To put this to test using real-time data, we have created a theme to make it easy for you to follow along: Trend Long-Short.