Search: “asset allocation”

Fat Tails, an Introduction

Benjamin Graham described Mr. Market as a manic-depressive, randomly swinging from bouts of optimism to moods of pessimism. While equities and markets exist in perpetuity and can create wealth in the long-term, most investors don’t have the luxury of remaining invested forever. We have extensively discussed the problem of sequence-of-returns risk for investors who have finite investment horizons in our Free Float newsletters (Intro.)

A bigger problem than sequence, is the severity of low-probability events. Also called fat-tails or black-swans.

NIFTY 50 Monthly Returns
NIFTY MIDCAP Monthly Returns
NIFTY 10-year government bond Monthly Returns

While an investor can mitigate an unfortunate sequence of returns through diversification, a market tsunami can hit all assets at the same time.

US/India Equity and Bonds during the Corona Panic

The charts show how years of returns can get wiped out in a month in the markets. While investors mostly focus on the average, the tails end up dictating their actual returns.

While using traditional statistical tools like average, std-deviation, correlation, etc. makes sense 99% of the time, they breakdown during that 1% of the time where an investor needs them to hold. This is the main motivation behind studying tail-risk events.

Indian vs. US Mid-caps

There used to be a time when getting your kids through college was the final act before kicking them out of the house. But kids these days want their parents to fund their US education as well. And how about a gap year to travel through Europe? You can roll your eyes all that you want but 15-20 years from now, this will be the new normal for middle-class Indians. What can we do? We have always been an aspirational lot and it is bound to rub off on our kids. As much as we like our kids to be financially independent when they grow up, we also don’t want them to start their lives with a ton of student loans. However, given the potentially large dollar liabilities in the future, most Indian investors continue to keep all their eggs in the Indian rupee basket. If you think your Indian mid-cap mutual fund alone is going to fund your kid’s grad school, think again.

Not only have Indian Mid-caps trailed US Mid-caps over the last 25 years, they have done so with steeper and longer drawdowns.

Over the last 25 years or so, US mid-caps have out-performed Indian mid-caps. Indian asset managers would have you believe that “east or west, India is the best” but that is not what the numbers say. Here are the cumulative and annual returns of the MSCI India MC and MSCI USA MC indices:
MSCI India vs. US mid-cap indices

Living in India, it is easy to get carried away with stories about how Indian equities present big opportunities. However, historical returns show that investors were not compensated for the additional risk that they took by investing in India. Also, the US equity market cap is 50% of the total world equity market cap. So even if you have bonds, gold etc in your portfolio, being 100% invested in India is not true diversification. Besides, the Indian rupee keeps depreciating, making your future dollar liabilities that much larger when priced in local assets.

We ran through different allocations between Indian and US mid-caps to get an idea of what the potential returns could look like:
Allocating between MSCI India vs. US mid-cap indices

Assuming a monthly rebalance, the 50/50 portfolio beats the “all in” 100/0 and 0/100 portfolios. And it does so with shallower drawdowns. So both from a diversification and returns point of view, it makes sense to allocate towards US mid-caps.

It is time to have a chat about your portfolio. Get in touch with us now!

Further reading: Funding Your Dollar Dreams

Stock and Bond Correlations and Volatility

Stocks and Bonds are not correlated. They are not negatively correlated. And neither are they positively correlated. One doesn’t “zig” when the other “zags.” This is exactly why portfolio allocations start with stocks and bonds – the diversification math works on uncorrelated asset classes. When you combine the two assets together you get lower portfolio volatility.

Here are some charts that show how the two asset classes differ:

S&P 500 and 3-month t-bills

sp500.tbill.correlation.1mo

sp500.tbill.volatility.1mo

Nifty 50 and 0-5 year TRI

nifty50.z5.correlation.1mo

nifty50.z5.volatility.1mo

An Equity, Bond and Gold Portfolio

How did diversification across Midcap equity, bonds and gold work out for Indian investors over the last 10 years? Not too shabby, as it turns out:

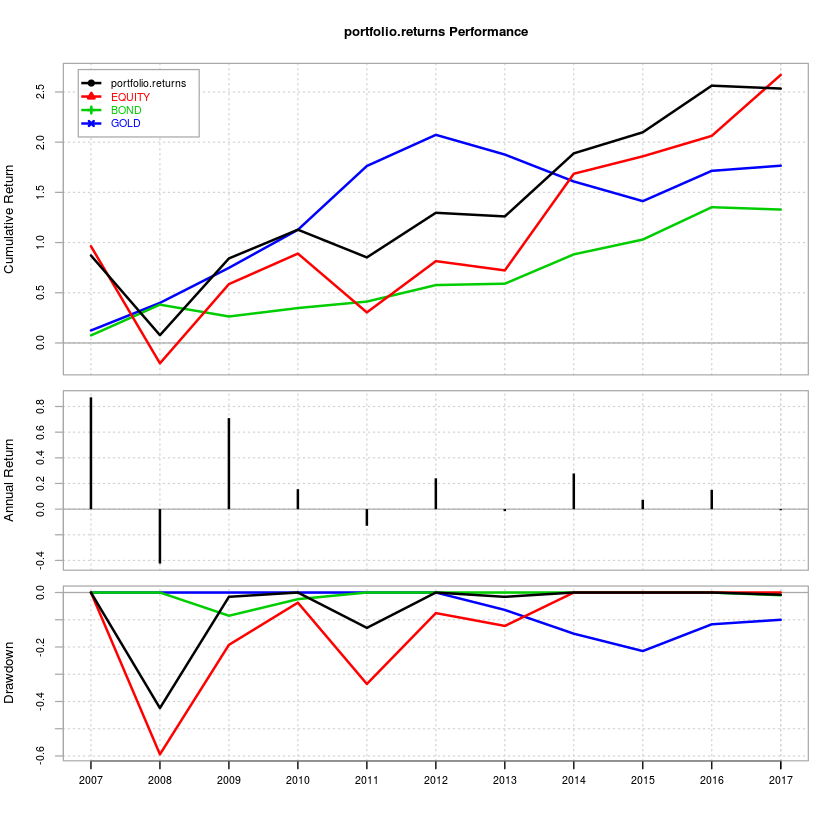
Combined portfolio – Annualized: 12.16%; Max drawdown: -42.42%
Gold only portfolio – Annualized: 9.69%; Max drawdown: -21.49%
Equity only portfolio – Annualized: 12.55%; Max drawdown: -59.39%
Bond only portfolio – Annualized: 7.99%; Max drawdown: -8.52%
*Not including transaction charges/taxes.

The Setup

  • Annual rebalance.
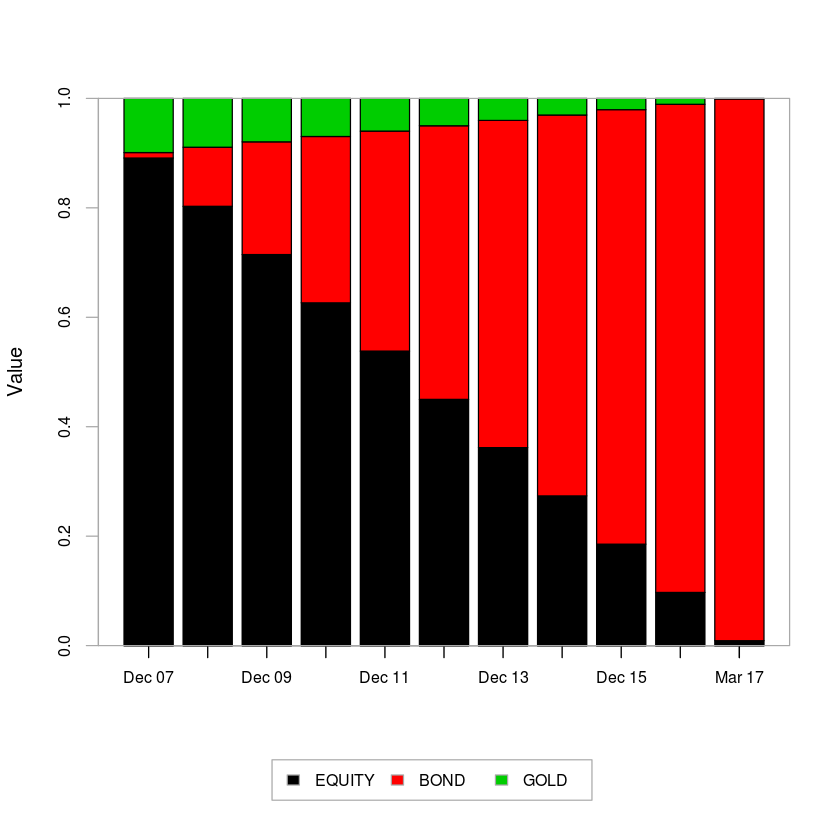
  • Bonds start at 1%, the rest is divided between Gold (10%) and Equities.
  • The total return index for the 5-10 year tenure published by CCIL is used as a proxy for Bonds.
  • The MID100 FREE index is used as a proxy for Equities.
  • The GOLDBEES ETF is used as a proxy for Gold.
  • Period under observation: 2007-04-01 through 2017-03-31.

The idea is that you start with mostly Equity and Gold in the portfolio and rebalance at the end of every year so that at the end of 10 years, you end up with mostly Bonds.

Returns

Notice the drawdown of the equity vs. that of the portfolio. You end up with similar returns but with lower volatility.

If you remove Gold from the equation and go with only Equity and Bonds:

Combined portfolio – Annualized: 11.38%; Max drawdown: -49.90%
Equity only portfolio – Annualized: 12.55%; Max drawdown: -59.39%
Bond only portfolio – Annualized: 7.99%; Max drawdown: -8.52%

Even though a diversified, rebalanced portfolio makes sense on the surface, the tax treatment on Gold and Bonds make an annual rebalance an expensive affair.

Code and detailed results are on Github.

March Madness 2016

world.2016-02-29.2016-03-31

Equities

Major
DAX(DEU) +3.33%
CAC(FRA) -1.04%
UKX(GBR) +0.09%
NKY(JPN) +0.86%
SPX(USA) +5.44%
MINTs
JCI(IDN) +1.51%
INMEX(MEX) +5.97%
NGSEINDX(NGA) +2.95%
XU030(TUR) +9.00%
BRICS
IBOV(BRA) +16.69%
SHCOMP(CHN) +11.96%
NIFTY(IND) +10.39%
INDEXCF(RUS) +0.37%
TOP40(ZAF) +4.08%

Commodities

Energy
Brent Crude Oil +10.30%
Ethanol +4.44%
Heating Oil +8.39%
RBOB Gasoline +38.22%
Natural Gas +13.84%
WTI Crude Oil +11.73%
Metals
Palladium +15.93%
Copper +2.35%
Gold 100oz -0.06%
Silver 5000oz +4.73%
Platinum +5.15%

Currencies

USDEUR:-4.70% USDJPY:-0.63%

MINTs
USDIDR(IDN) -1.56%
USDMXN(MEX) -4.16%
USDNGN(NGA) +0.00%
USDTRY(TUR) -4.86%
BRICS
USDBRL(BRA) -9.97%
USDCNY(CHN) -1.35%
USDINR(IND) -3.18%
USDRUB(RUS) -9.94%
USDZAR(ZAF) -7.24%
Agricultural
Cocoa -2.75%
Feeder Cattle -0.55%
White Sugar +8.29%
Cattle -4.71%
Coffee (Robusta) +9.77%
Corn -1.27%
Lumber +21.75%
Orange Juice +17.57%
Sugar #11 +4.72%
Coffee (Arabica) +11.78%
Cotton +2.76%
Soybeans +7.00%
Lean Hogs -2.05%
Soybean Meal +4.55%
Wheat +5.96%

Credit Indices

Index Change
Markit CDX EM +2.89%
Markit CDX NA HY +3.28%
Markit CDX NA IG -27.66%
Markit iTraxx Asia ex-Japan IG -6.67%
Markit iTraxx Australia -15.03%
Markit iTraxx Europe -26.80%
Markit iTraxx Europe Crossover -98.68%
Markit iTraxx Japan -9.45%
Markit MCDX (Municipal CDS) -14.58%
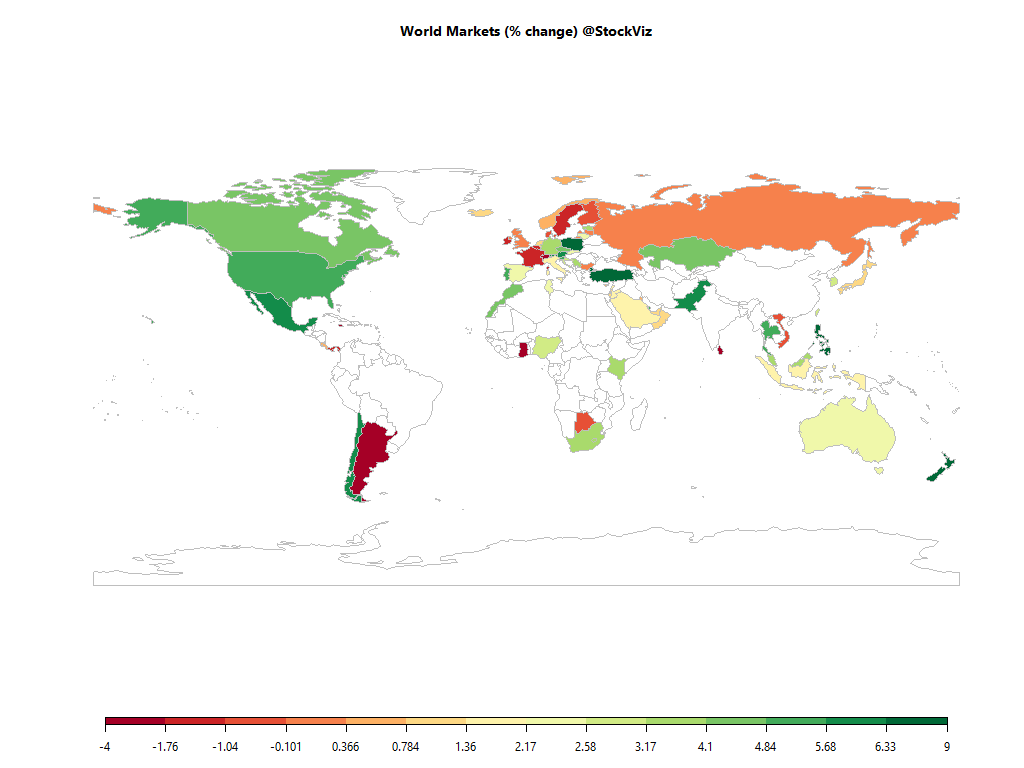
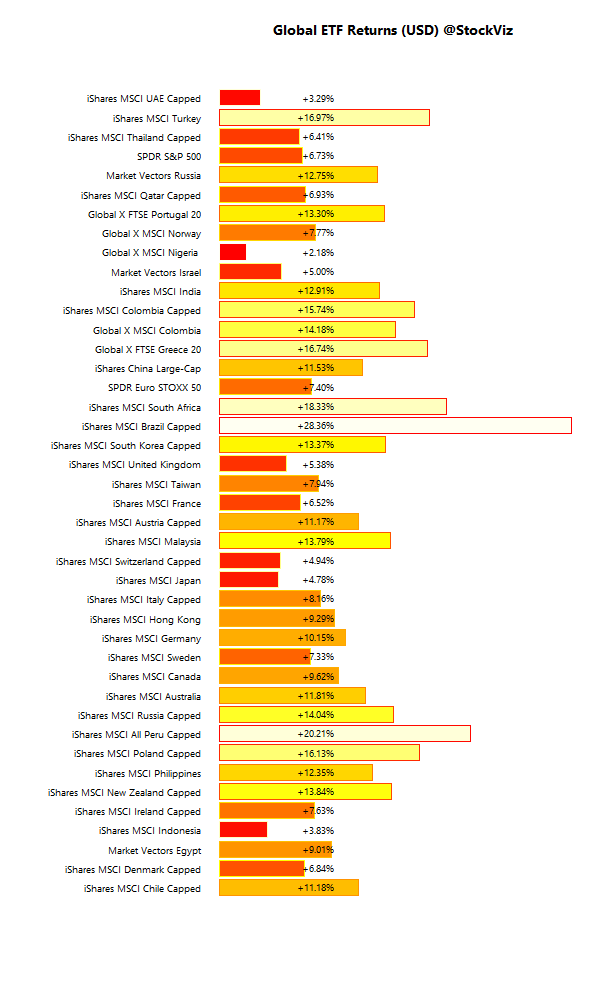
Markets rebounded with the Fed assuming the role of the world’s central bank…

International ETFs (USD)

global.etf.performance.2016-02-29.2016-03-31

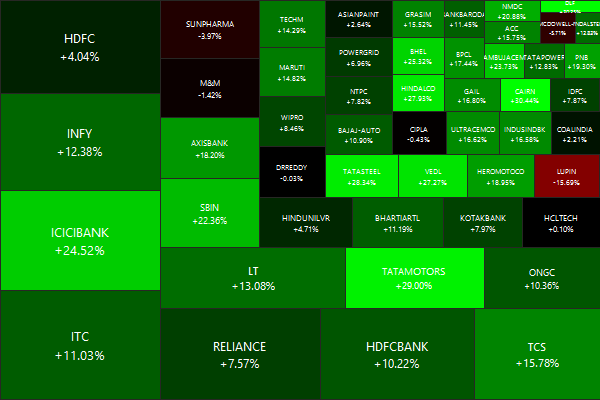
Nifty Heatmap

NIFTY 50.2016-02-29.2016-03-31

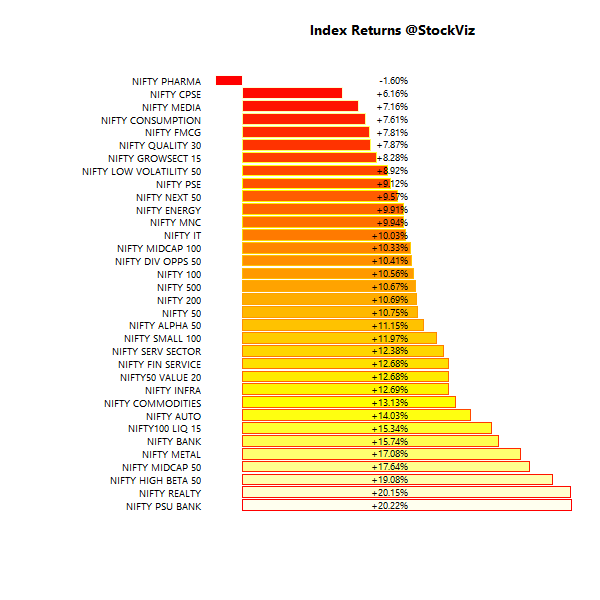
Index Returns

index.performance.2016-02-29.2016-03-31

Market Cap Decile Performance

Decile Mkt. Cap. Adv/Decl
1 (micro) +0.54% 70/61
2 +9.38% 82/48
3 +10.53% 91/39
4 +9.03% 82/48
5 +7.85% 84/46
6 +6.78% 85/45
7 +10.83% 83/47
8 +7.10% 83/47
9 +12.46% 81/49
10 (mega) +1.97% 74/57

Top Winners and Losers

TATAMOTORS +29.00%
RELINFRA +30.19%
CAIRN +30.44%
LUPIN -15.69%
APOLLOHOSP -9.19%
COALINDIA -6.13%
Dash for trash?

ETF Performance

PSUBNKBEES +19.47%
BANKBEES +15.43%
INFRABEES +12.76%
NIFTYBEES +11.70%
JUNIORBEES +9.02%
CPSEETF +8.08%
GOLDBEES -3.22%
With bank balance-sheet clean up in full swing, banks got the better bid…

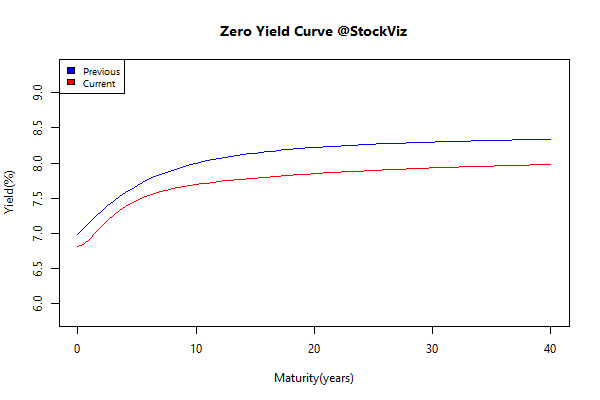
Yield Curve

yieldCurve.2016-02-29.2016-03-31

Bond Indices

Sub Index Change in YTM Total Return(%)
0 5 -0.22 +1.22%
5 10 -0.24 +1.91%
10 15 -0.30 +2.56%
15 20 -0.35 +3.94%
20 30 -0.37 +4.59%
Rate cut already factored in?

Investment Theme Performance

The worst hit asset classes saw the steepest rebound…

Equity Mutual Funds

Bond Mutual Funds

Thought to sum up the month

Why do amateurs believe they can outperform the professionals — or even identify those pros who will outperform? (Performance of individual mutual funds cannot be predicted with any greater degree of accuracy than individual stocks or bonds.)

  1. Overconfidence
  2. Optimism Bias
  3. Hindsight Bias
  4. Attribution Bias
  5. Confirmation Bias

Source: Why We Think We’re Better Investors Than We Are