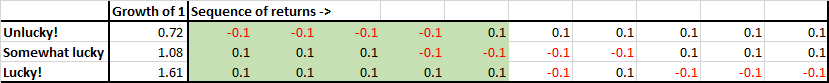
Sequence Risk (sometimes called sequence-of-returns risk) is the effect that the order of returns has on a portfolio.
For example, say you look at NIFTY and find that it gave negative 10% returns 4 years out of 10, and the rest of the years it gave positive 10% returns. You want to be invested for 5 years, so you expect 2 of those years to be negative. Sequence risk means that it is possible that you could have all of those negative 4 years during the 5 year period that you have invested.
The annualized return of the NIFTY 50 TR index, since inception through May-2020, is roughly 12%. However, it has not been without periods where it was down over 50%.
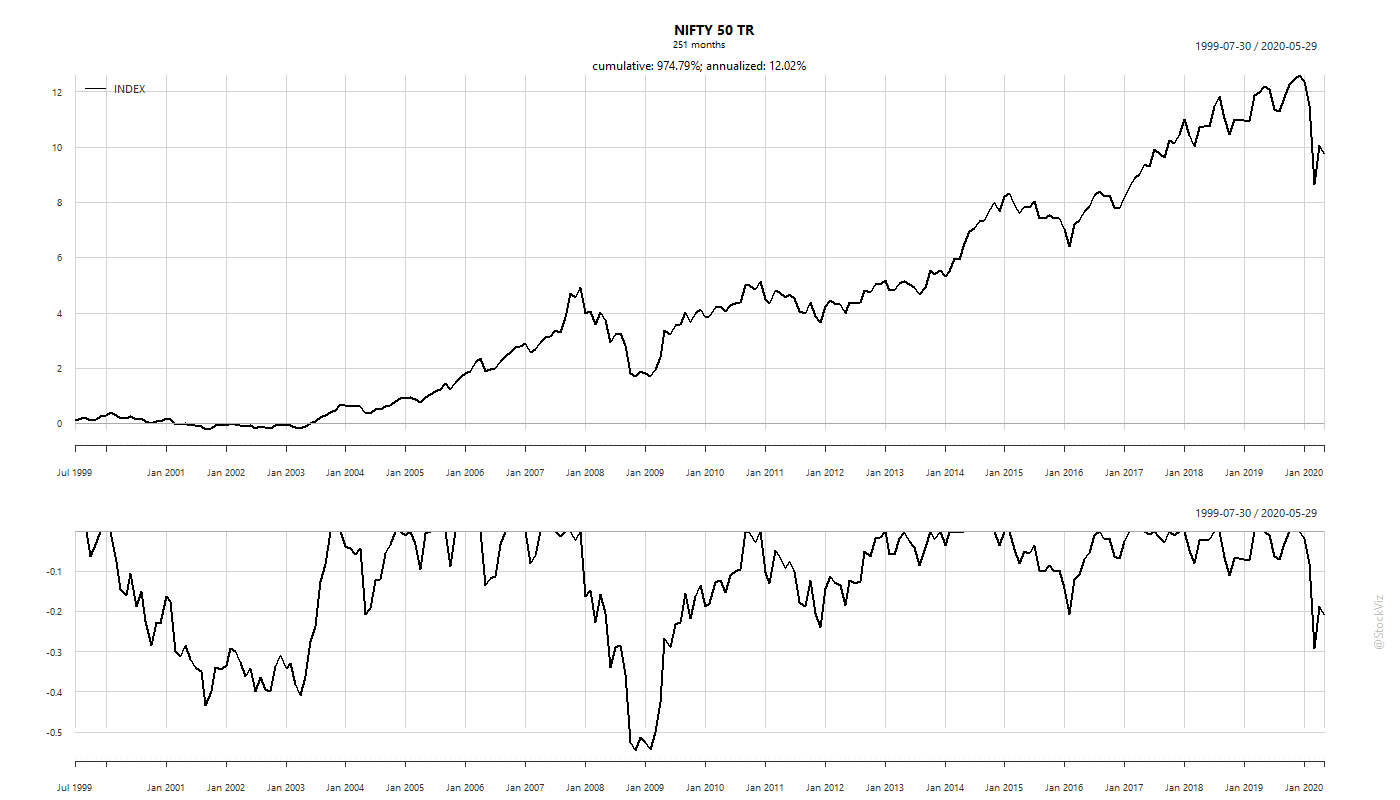
The lower part of the chart shows the drawdowns that have occurred in the past. Sometimes, it has taken years to recover from losses. The problem is that most investors have a pre-defined time-frame in mind. They want to be invested, say, for 10 years. Not “forever.” This is where sequence risk becomes a problem.
For a 10-year period, if you re-sample the monthly returns of the NIFTY 50 TR index and re-construct a return time-series, say, a 100 times, and plot the cumulative returns of each, it looks something like this:
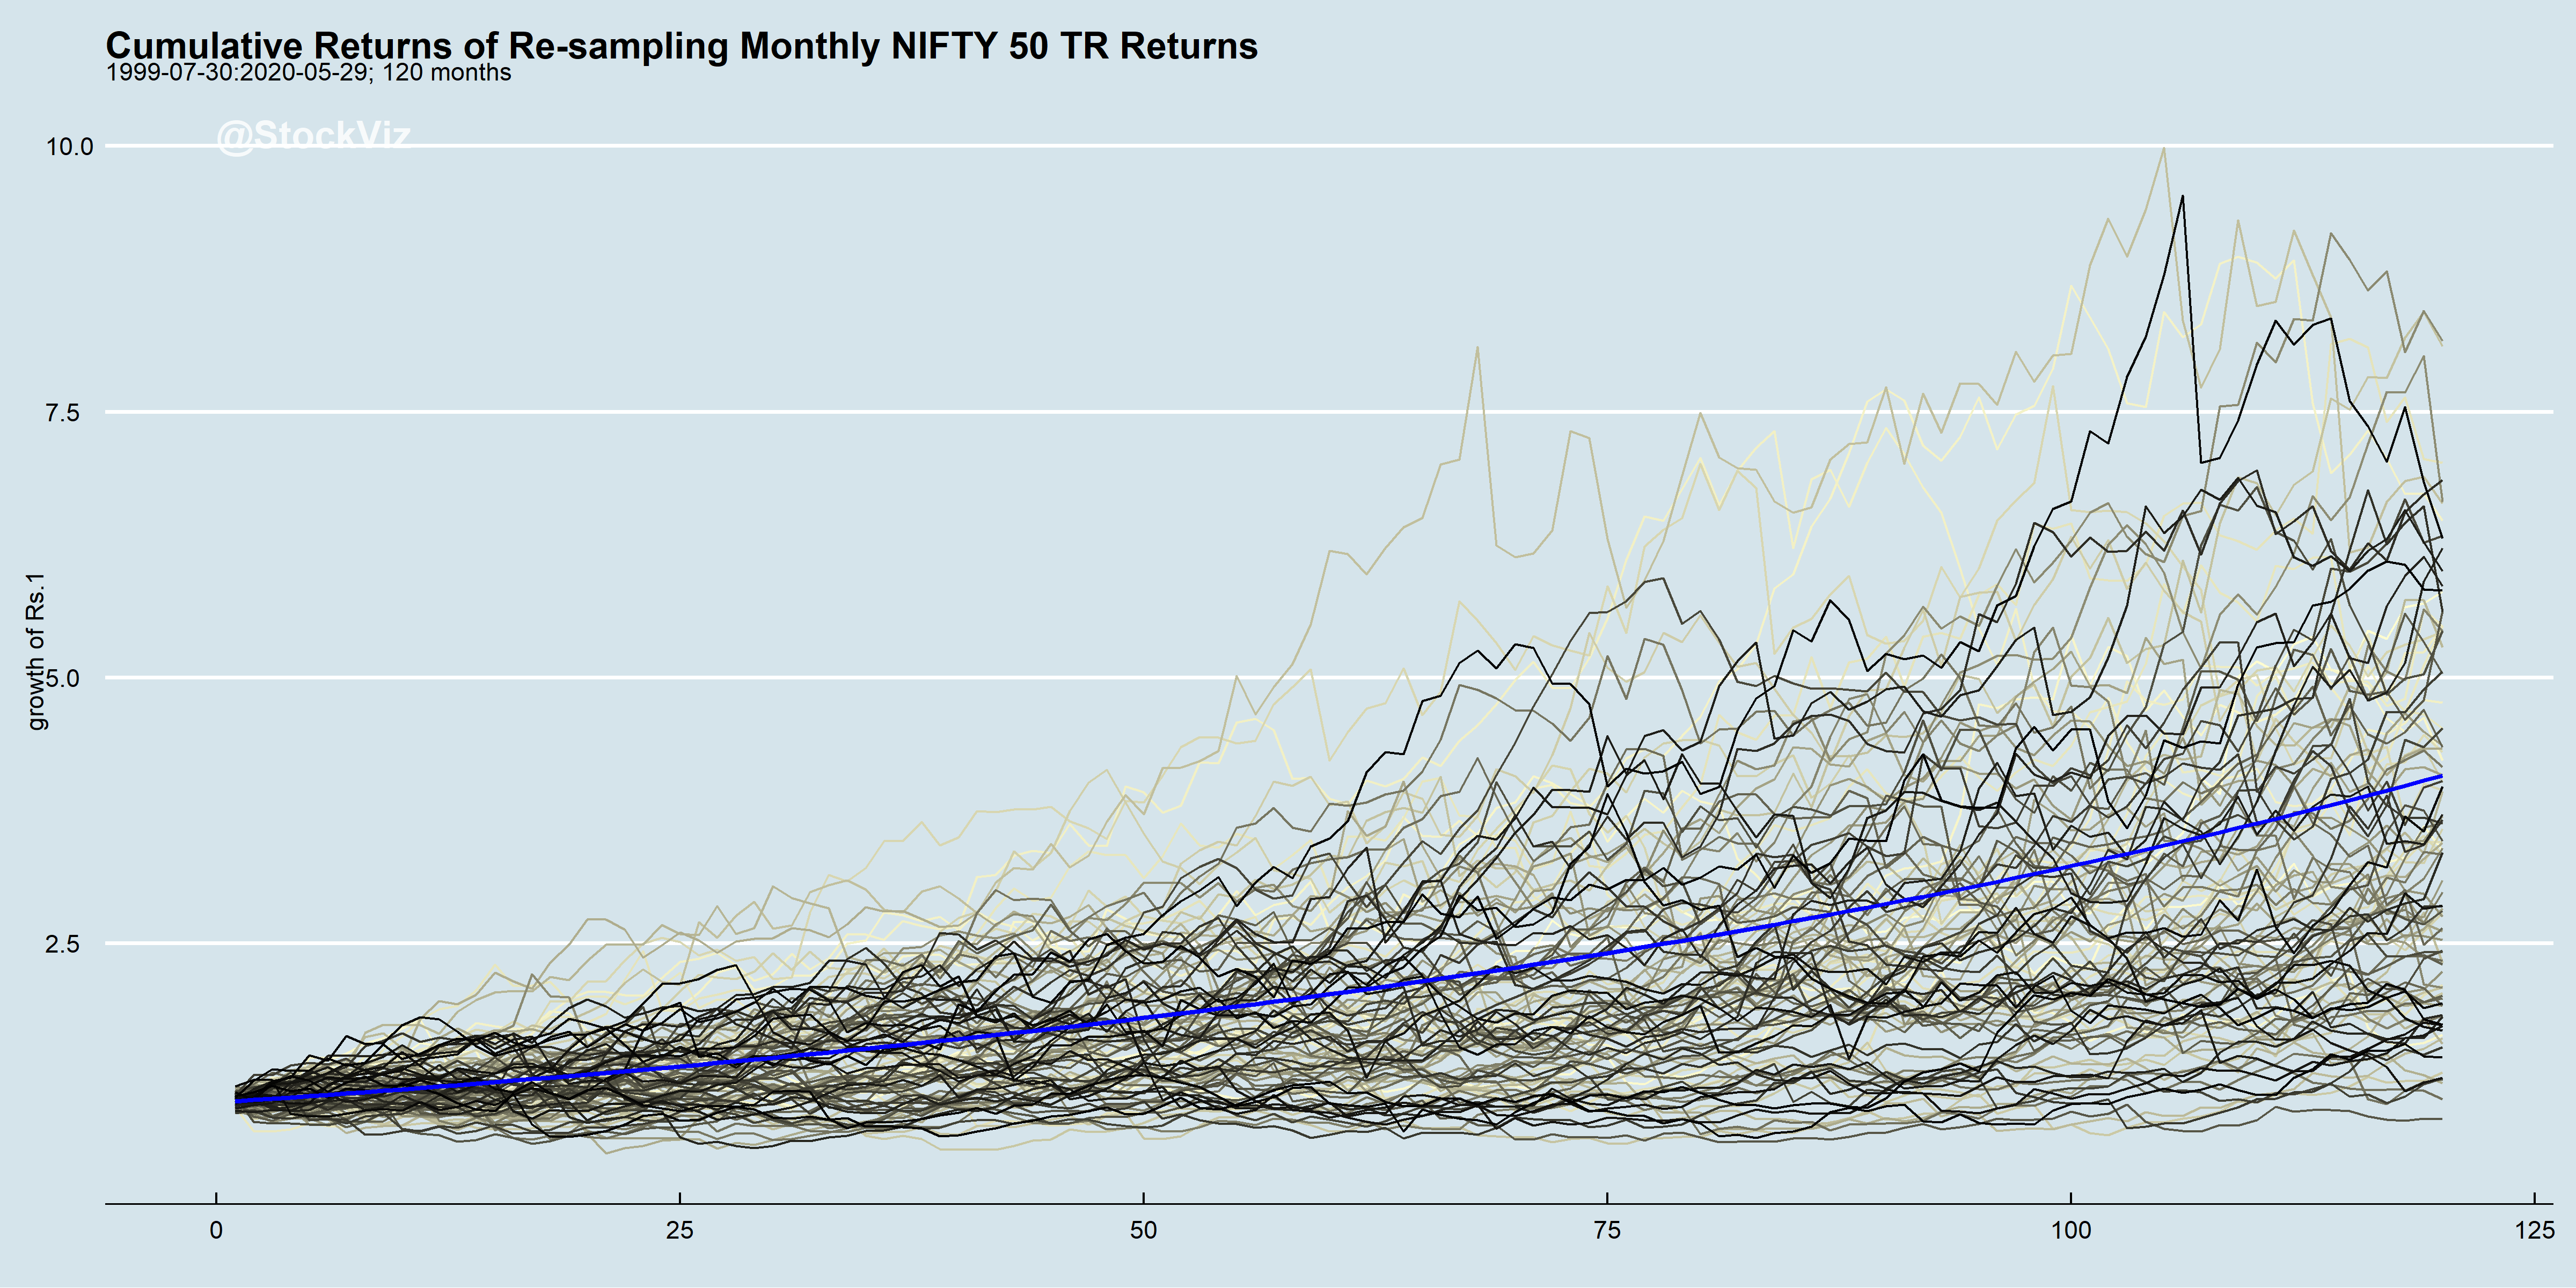
Put another way, there is a non-trivial chance that an investor could end up with negative returns in a given 10-year period even if NIFTY’s return distribution did not change.
So, what is an investor to do? There are two approaches that have known to work:
- Diversification. Allocate to non-correlated assets.
- Get Tactical. Markets are known to trend. Try and preemptively exit from assets who’s prices are trending down.
There are a million different ways to skin each of these approaches. The simplest one is to add bonds to the portfolio.
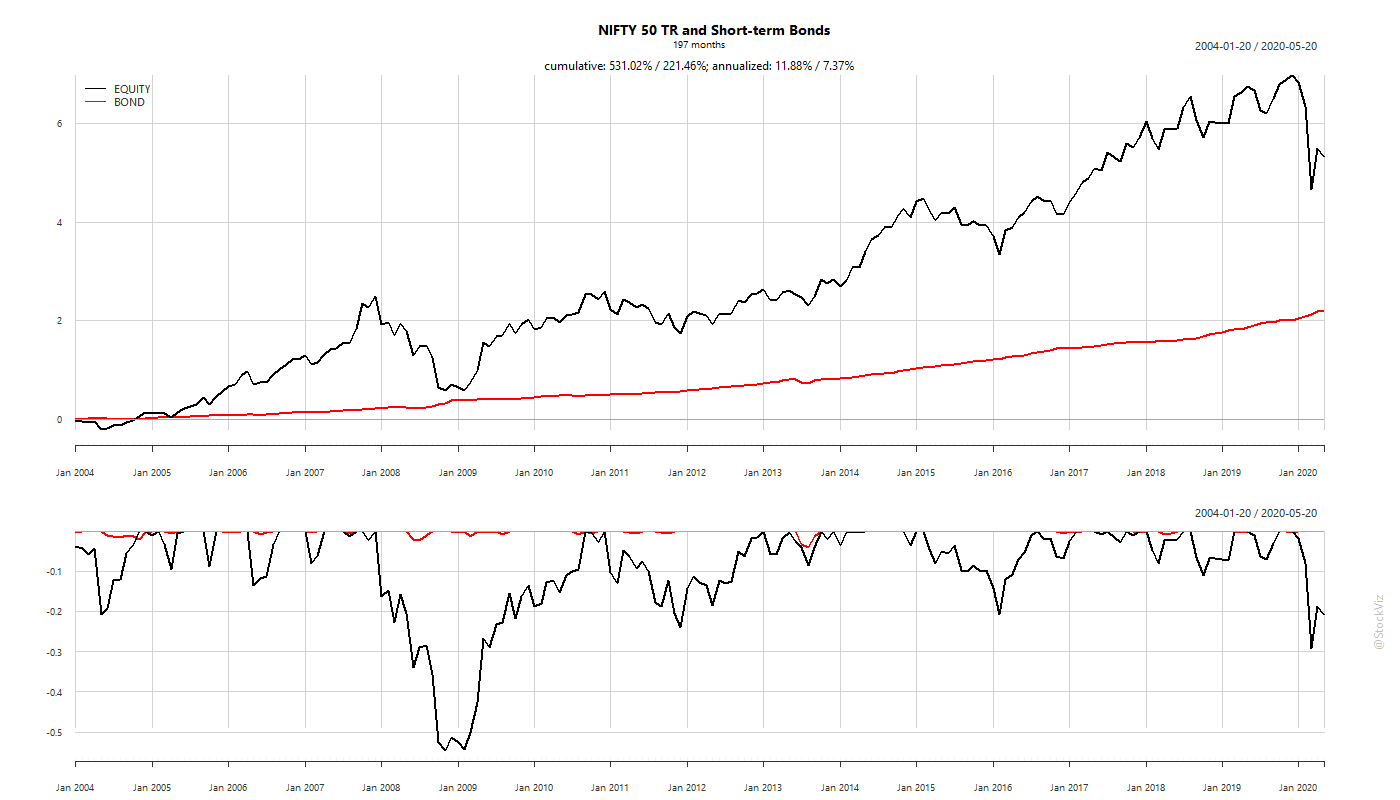
Bonds, especially sovereign bonds (issued by stable countries, of course) have very low drawdowns. So when you combine it with equities, you end up with a lot less sequence risk than pure equities.
If you simulate different proportions of equities and bonds and plot them along with their standard deviations, you’ll get an idea of where to trade-off stability with returns.
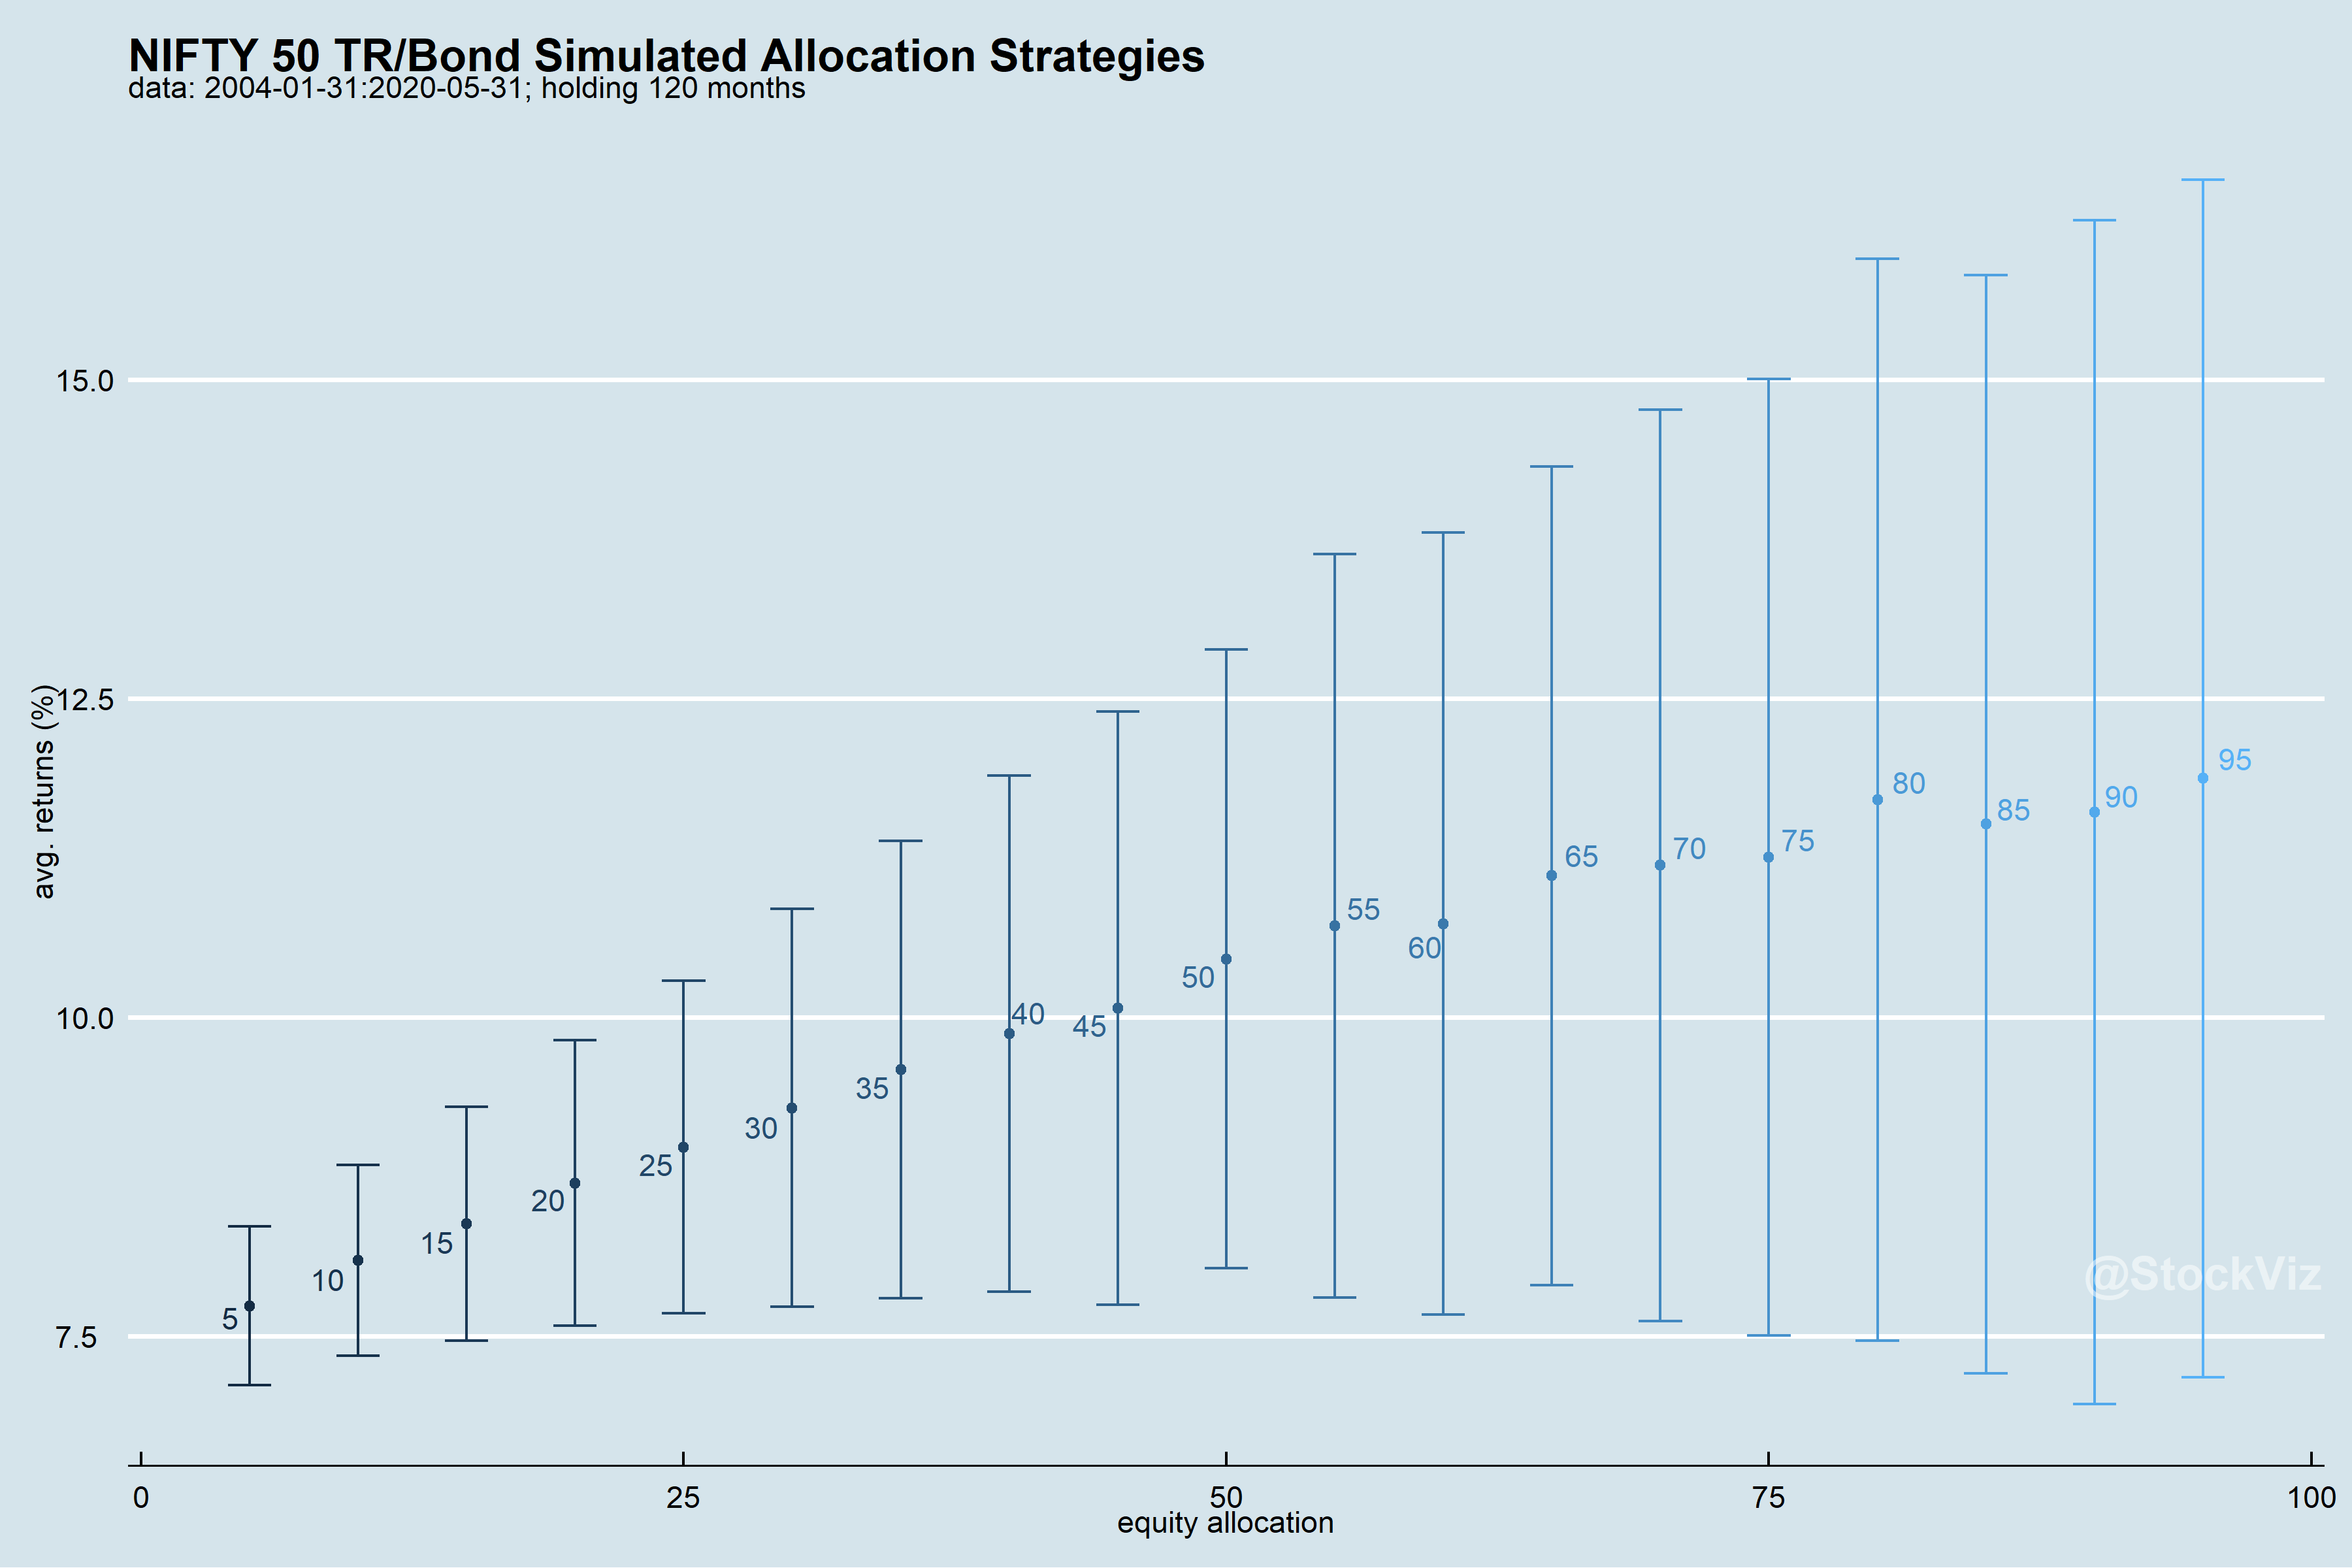
Let’s say that the sweet-spot is equity/bond ratios with avg. returns more than 10% but lower-bounded at 7.5%, you get 45/55, 50/50 and 55/45 as ideal allocations. While a 60/40 equity/bond allocation is the go-to for most advisors, there is no reason why it can’t be a more conservative 45/55.

Note the lower drawdowns of diversified portfolios. While the equity-only portfolio would have had an annualized return of 11.88% during the period, diversified portfolios ranged from 10.10% – 10.56%. The trade-off is that diversified portfolios have vastly less sequence risk.
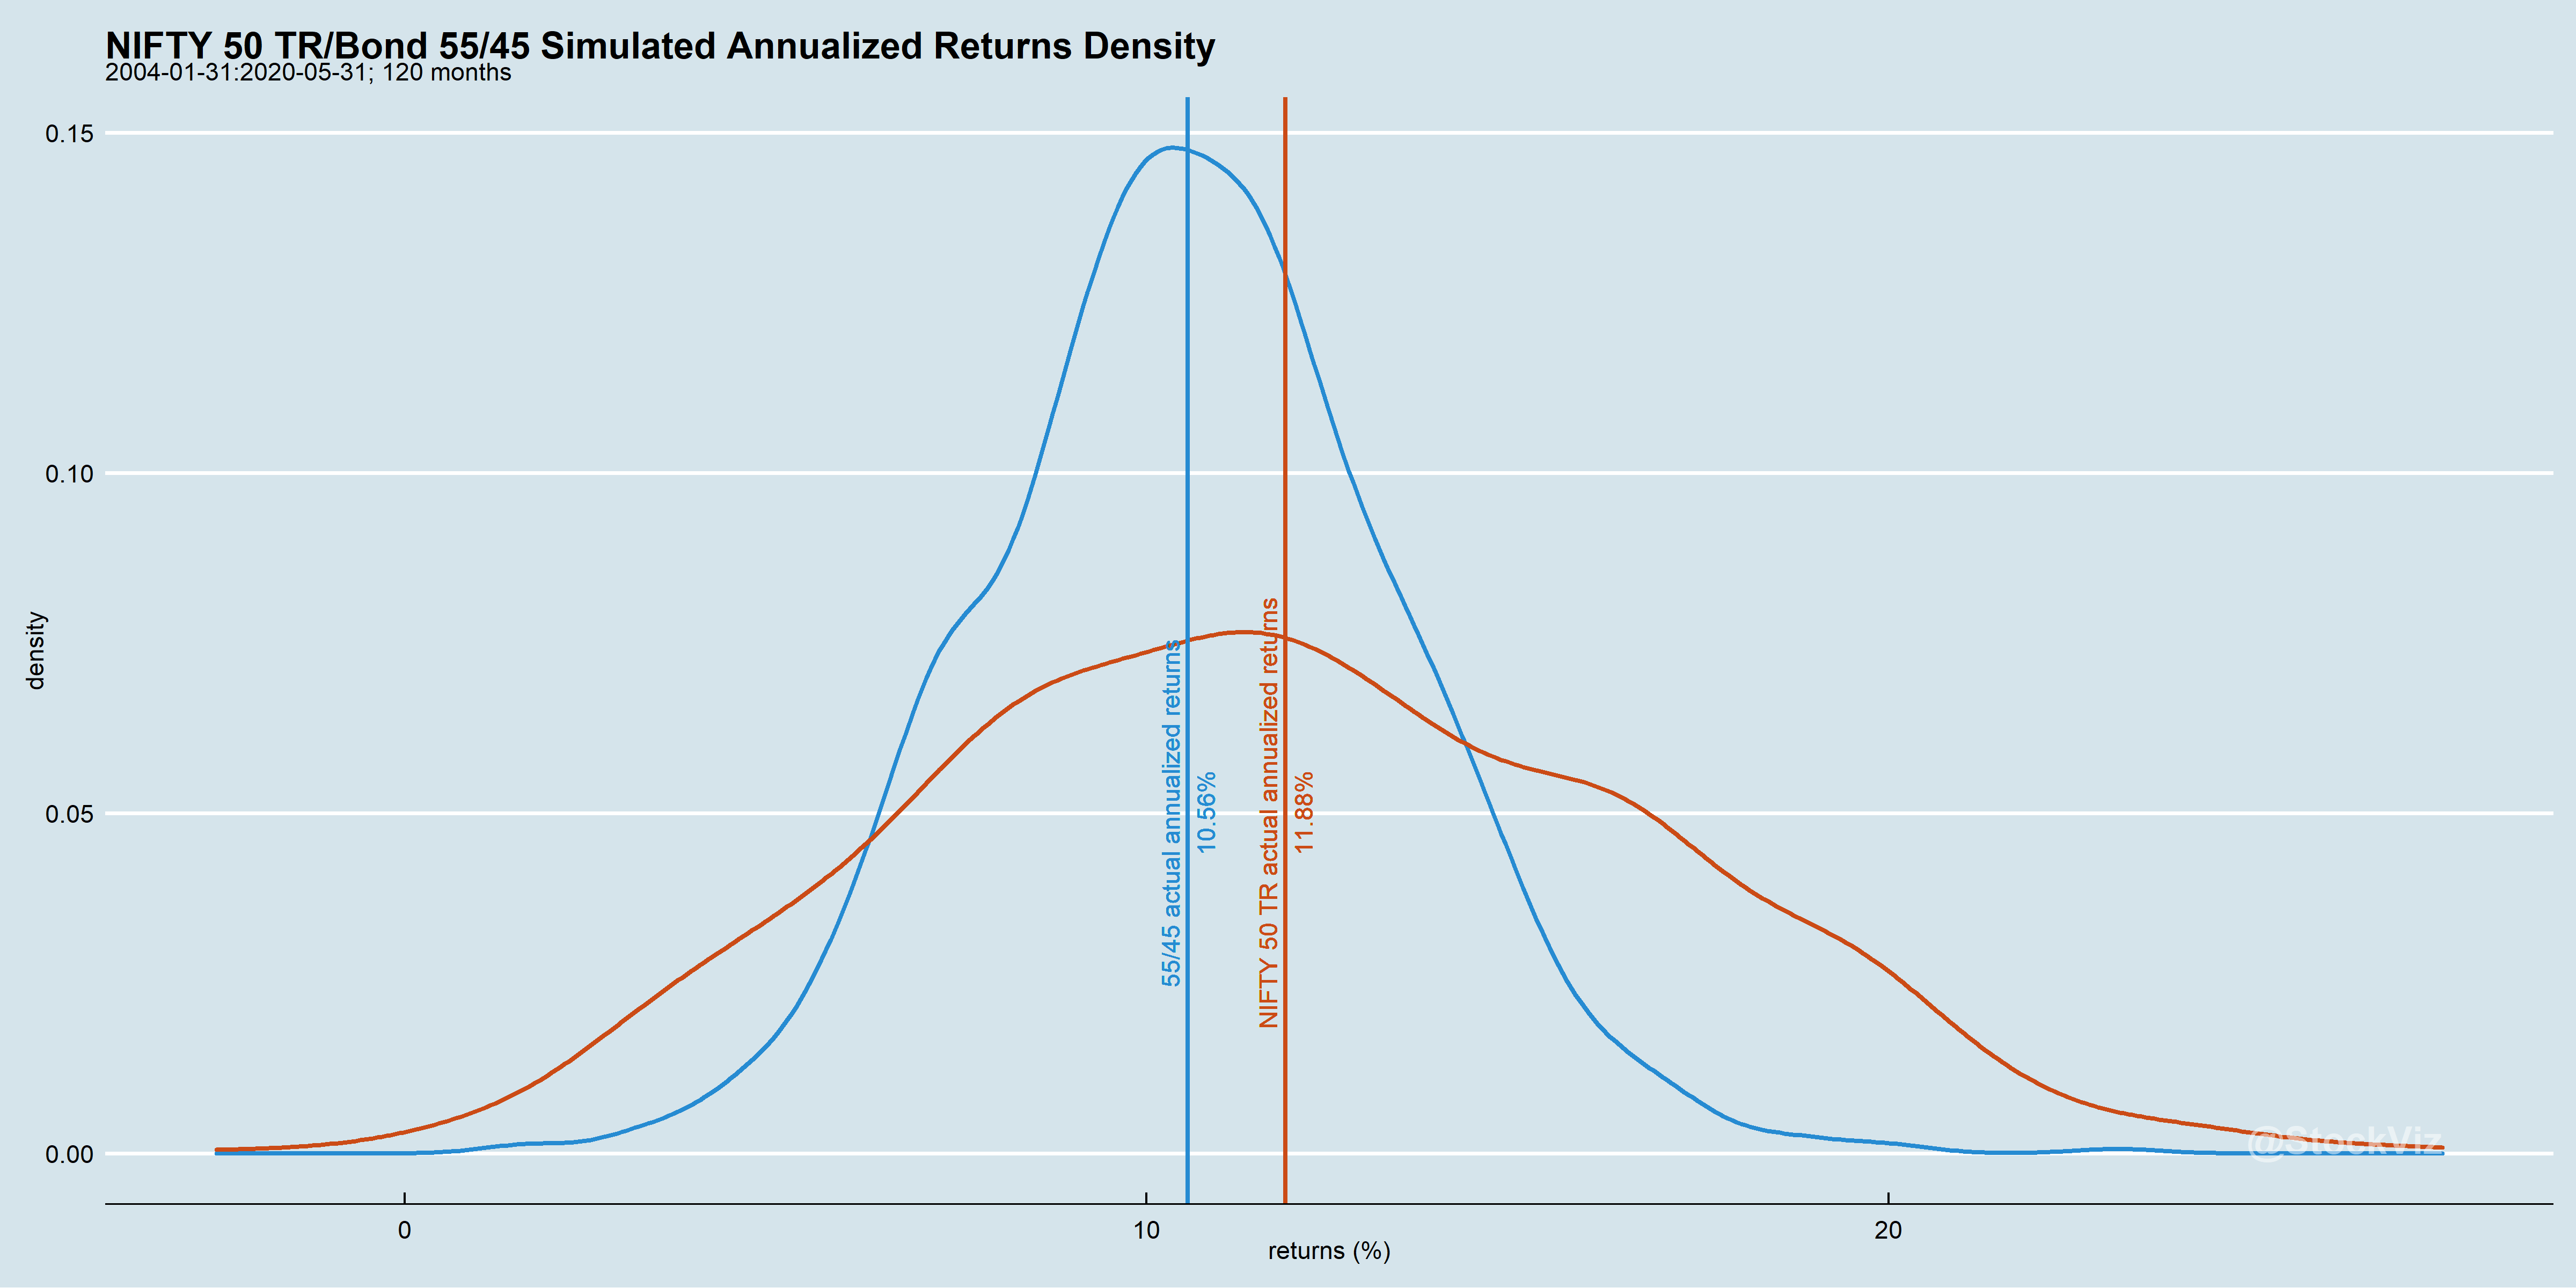
Diversification changes the shape of the return distribution so that an average investor has a greater probability of experiencing average returns.
Read more about portfolio allocation across different assets here.
Code and images are on github.