Search: “asset allocation”

ETFs for Asset Allocation

Building blocks for a diversified portfolio

Over the last few years, most brokers in the US have started offering no-frills accounts with zero-brokerage and fractional shares. However, new investors who are just getting started are either over-served by advisors or under-served by social media. In this post, we list out ETFs that every investor should be aware of if they are interesting in building a diversified portfolio.

We filtered for

  • Assets under management (AUM) – larger the better

  • Cost (expense ratio) – lower the better

  • Liquidity and popularity – higher the better

We cover equities, bonds, real-estate and commodities across the US, DM (Developed Markets) and EM (Emerging Markets.)


VTI

The Vanguard Total Stock Market Index Fund ETF is a $250 billion whale of a fund that is probably the only equity ETF a small-ticket first-time investor should consider.

Covering the entire US equity market, it is as passive as they come. With an expense ratio of 3bps (you pay $3 for every $10,000 investment,) it is the cheapest as well.

ETF, Vanguard

AGG

The iShares Core U.S. Aggregate Bond ETF is one of the largest bond ETFs on the planet with $90 billion in assets. It has everything from treasuries, agencies, CMBS and ABS to investment-grade corporates. You pay 4bps for the privilege.

Split your funds 60% into VTI and 40% into AGG and you basically have a portfolio that has traditionally outperformed 99% of the hedge funds out there.

ETF, iShares


With the Big Two out of the way, if you still have some risk appetite and time on your hands, you can reach out for more returns (potentially.)

SCHF

The Schwab International Equity ETF tracks all Developed Markets other than the US. With an AUM of $27 billion and an expense ratio of 6bps, it is a decent equity fund if you feel that US stocks are over valued.

Its largest exposure is to Japanese stocks followed by British, France, Germany, Canada and Switzerland. Unlike some other funds in this space, it also includes South Korea.

One caveat though, the fund is not currency hedged. The topic of buying hedged vs. unhedged ETFs is a topic that we will not get into right now. Suffice to say that hedging is not free – it is a price you pay to insulate yourself from fluctuations and you should weigh the cost vs. its benefits over your investment time horizon.

ETF, Schwab

BNDX

The Vanguard Total International Bond ETF provides exposure to Developed Market (ex-US) investment-grade government and corporate bonds. It is a monster of a fund with $136 billion in assets. An 8bps expense ratio is a wonderful bargain.

The fund is currency hedged.

ETF, Vanguard


We are not fans big fans of EM/FM (Emerging/Frontier Markets) investing from the US through ETFs. In the recent past, these markets have only been a source of risk and not returns. Gains in local currencies, when converted to US Dollars, haven’t compensated for the additional risk. However, for investors who believe that the future is going to be different, these ETFs are worth considering.

EEM, EMXC and FRDM

The iShares MSCI Emerging Markets ETF is perhaps the largest in this space. $32 billion in AUM and a 70bps expense ratio, it is the go-to ETF for EM investors.

However, the wrinkle is that Hong Kong and China form more than 37% of the portfolio. For investors worried about geopolitical risk, this may be a point of concern. This is where EMXC comes in.

The iShares MSCI Emerging Markets ex China ETF is a minnow by comparison (less than $1 billion in AUM) but it doesn’t include China and Hong Kong, making it palatable. However, there’s another wrinkle while investing in EM – some of those countries are ruled by despots. What if you want to invest in EMs that are democratic and respect personal freedom? Enter FRDM.

The Freedom 100 Emerging Markets ETF tracks the Life + Liberty Freedom 100 Emerging Markets Index. The Index is a freedom-weighted EM equity strategy that uses human and economic freedom metrics as primary factors in the investment selection process. And this means excluding China, Hong Kong and India – 3 of the largest markets in EM.

ETF, iShares

EMB

The iShares JP Morgan USD Emerging Markets Bond ETF an index of US-dollar-denominated sovereign debt issued by EM countries. It holds USD-denominated rather than local-currency debt. This eliminates direct currency risk for US investors. With $20 billion in AUM and an expense ratio of 39bps, its an attractive fund for investors looking to diversify into EM bonds.

ETF, iShares


Now that we have equities and bonds out the way, lets look at real estate. A REIT is a publicly traded security that invests in real estate through properties or mortgages. For the most part, in the past, their returns were correlated to interest rates. From investopedia: In a study done by the S&P, which analyzed six periods beginning in the 1970s where the yield of the 10-year Treasury grew significantly, of these six periods of interest rate increases, REIT returns increased during four of them.

VNQ and VNQI

VNQ, The Vanguard Real Estate ETF has about $75 billion in AUM and charges 12bps. It captures much of the US real estate market.

VNQI, Vanguard Global ex-U.S. Real Estate ETF has about $5 billion in assets and an order-of-magnitude larger than the closest alternative. It contains property companies from both developed and emerging countries, excluding the United States. Japan, China and Hong Kong are the top three geographies where it invests. Like with any other EM/FM investments, caveat emptor!


Some investors view gold as a tail-risk and inflation hedge and some prefer to add commodities to their portfolio to ride on emerging market demand. While it is debatable whether these assets live up to their expectations in the future, there have been lengthy stretches in the past where gold and commodities have outperformed other asset classes.

GLD and PDBC

GLD tracks the gold spot price, less expenses and liabilities, using gold bars held in London vaults. With about $65 billion in management and 40bps in expense ratio, its probably the best way to add exposure to the yellow metal in your portfolio.

PDBC holds a diverse basket of futures contracts on 14 commodities across the energy, precious metals, industrial metals and agriculture sectors. Has about $6 billion in AUM and its 59bps expense ratio is a bargain compare to the effort involved in actively managing a futures portfolio in a tax-efficient manner.


There are over 2500 ETFs listed in various US stock exchanges. We hope that our short list of 12 ETFs above helps investors get started. Do watch the discussion below:


Already have a basic portfolio and looking for quantitative strategies on US stocks and ETFs? Head over to freefloat.us

Mitigating Sequence Risk through Asset Allocation

Sequence Risk (sometimes called sequence-of-returns risk) is the effect that the order of returns has on a portfolio.

For example, say you look at NIFTY and find that it gave negative 10% returns 4 years out of 10, and the rest of the years it gave positive 10% returns. You want to be invested for 5 years, so you expect 2 of those years to be negative. Sequence risk means that it is possible that you could have all of those negative 4 years during the 5 year period that you have invested.

The order in which losses occur impacts the portfolio’s terminal value

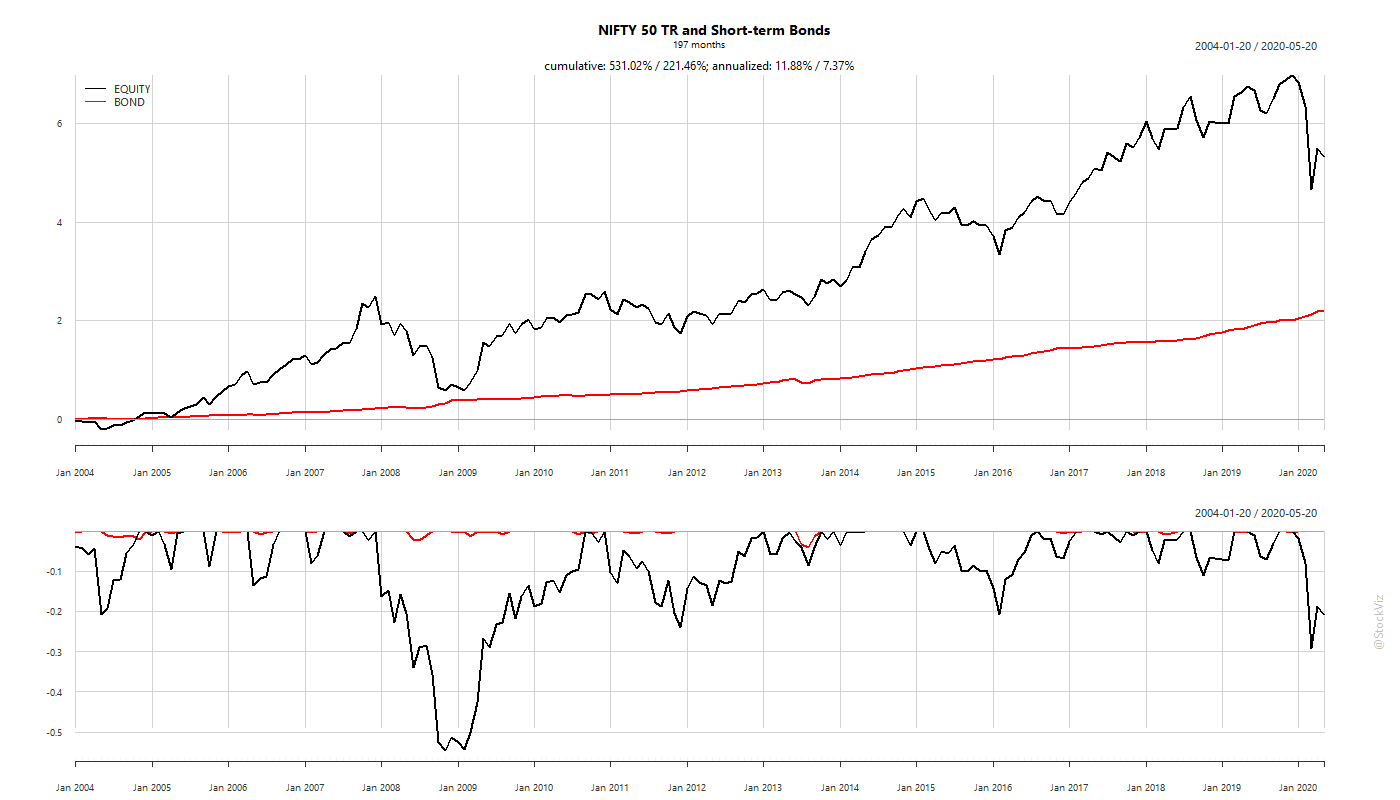
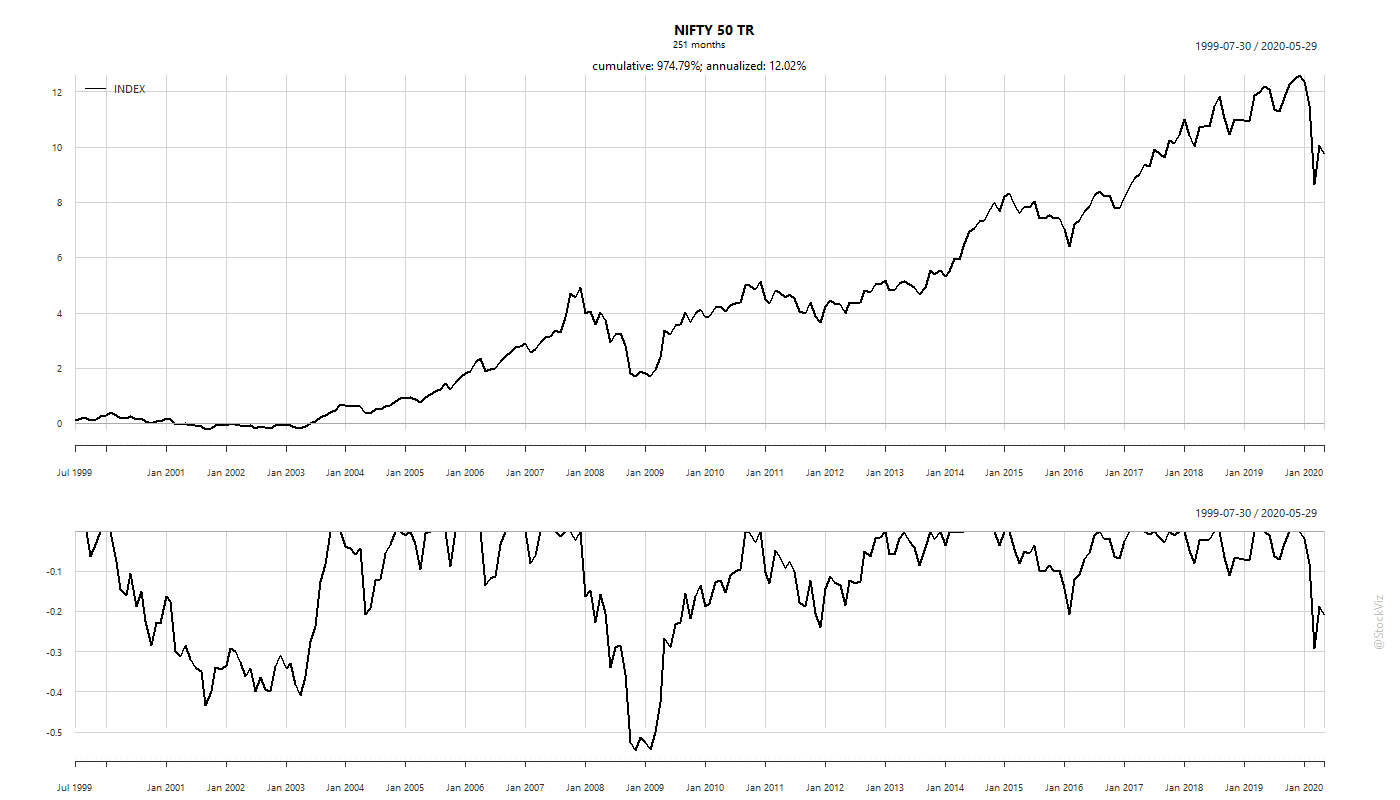
The annualized return of the NIFTY 50 TR index, since inception through May-2020, is roughly 12%. However, it has not been without periods where it was down over 50%.

NIFY 50 TR cumulative returns since inception

The lower part of the chart shows the drawdowns that have occurred in the past. Sometimes, it has taken years to recover from losses. The problem is that most investors have a pre-defined time-frame in mind. They want to be invested, say, for 10 years. Not “forever.” This is where sequence risk becomes a problem.

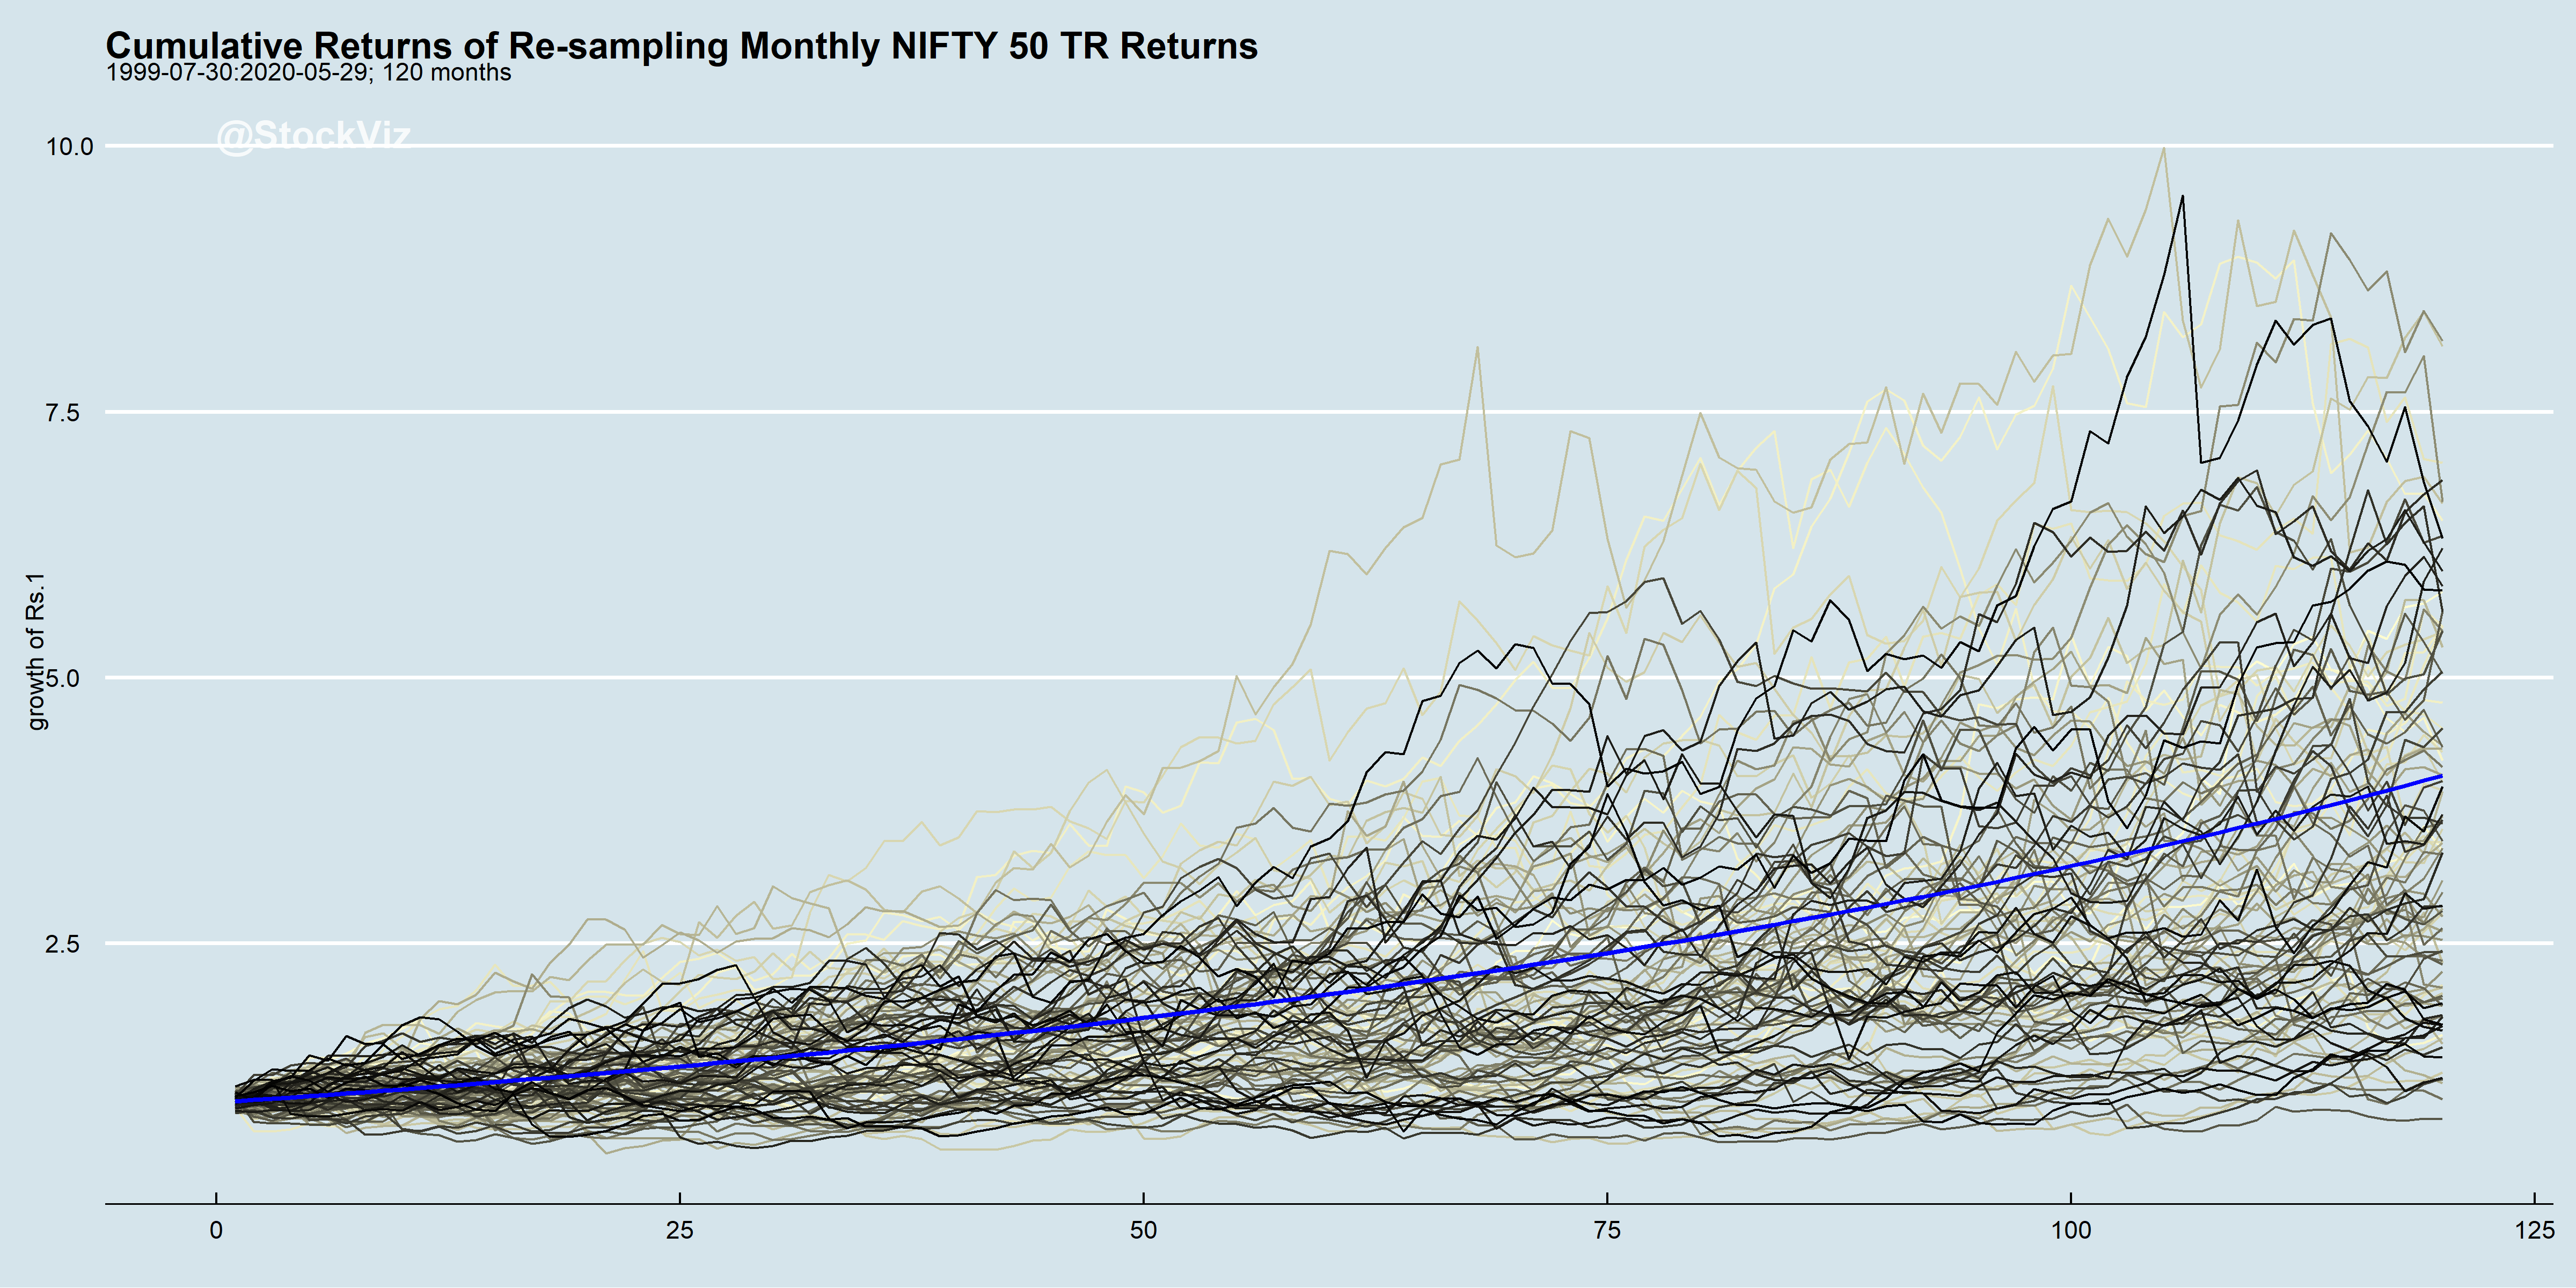
For a 10-year period, if you re-sample the monthly returns of the NIFTY 50 TR index and re-construct a return time-series, say, a 100 times, and plot the cumulative returns of each, it looks something like this:

The blue line is the “average” monthly return compounded for 10-years

Put another way, there is a non-trivial chance that an investor could end up with negative returns in a given 10-year period even if NIFTY’s return distribution did not change.

So, what is an investor to do? There are two approaches that have known to work:

  1. Diversification. Allocate to non-correlated assets.
  2. Get Tactical. Markets are known to trend. Try and preemptively exit from assets who’s prices are trending down.

There are a million different ways to skin each of these approaches. The simplest one is to add bonds to the portfolio.

NIFTY 50 TR and 0-5yr TRI

Bonds, especially sovereign bonds (issued by stable countries, of course) have very low drawdowns. So when you combine it with equities, you end up with a lot less sequence risk than pure equities.

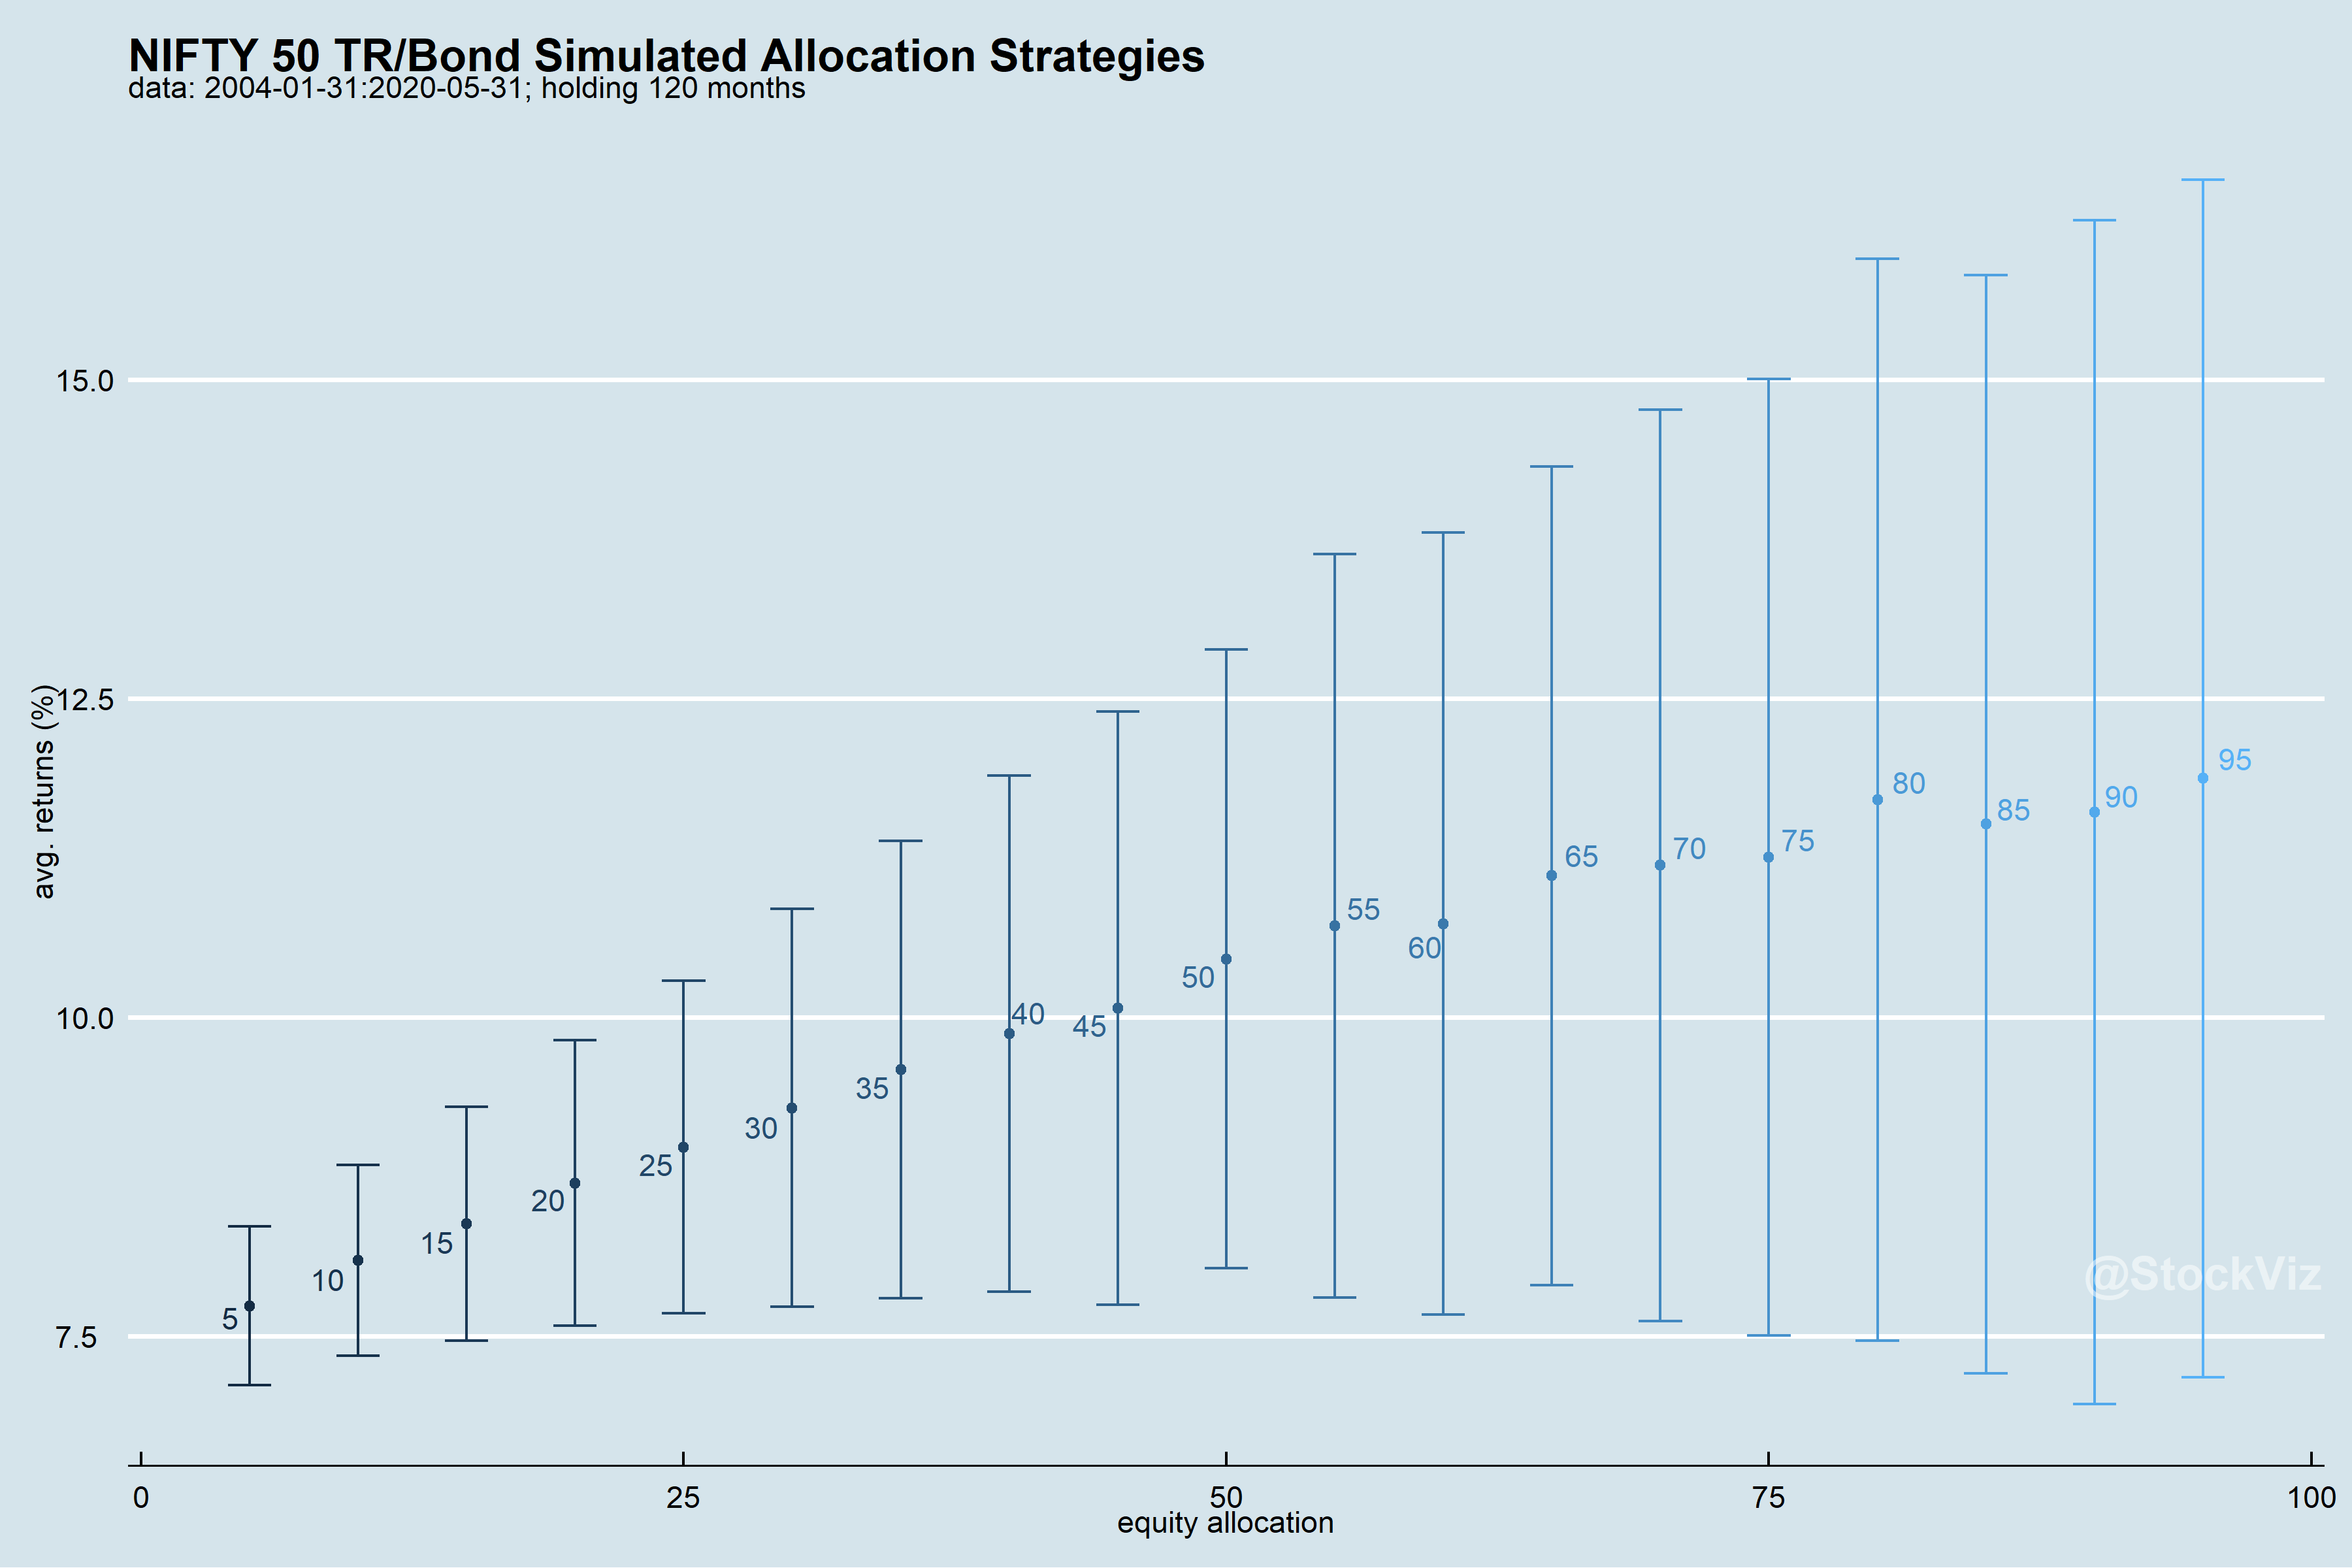
If you simulate different proportions of equities and bonds and plot them along with their standard deviations, you’ll get an idea of where to trade-off stability with returns.

Trade-off between risk and returns

Let’s say that the sweet-spot is equity/bond ratios with avg. returns more than 10% but lower-bounded at 7.5%, you get 45/55, 50/50 and 55/45 as ideal allocations. While a 60/40 equity/bond allocation is the go-to for most advisors, there is no reason why it can’t be a more conservative 45/55.

Cumulative returns of different allocation ratios

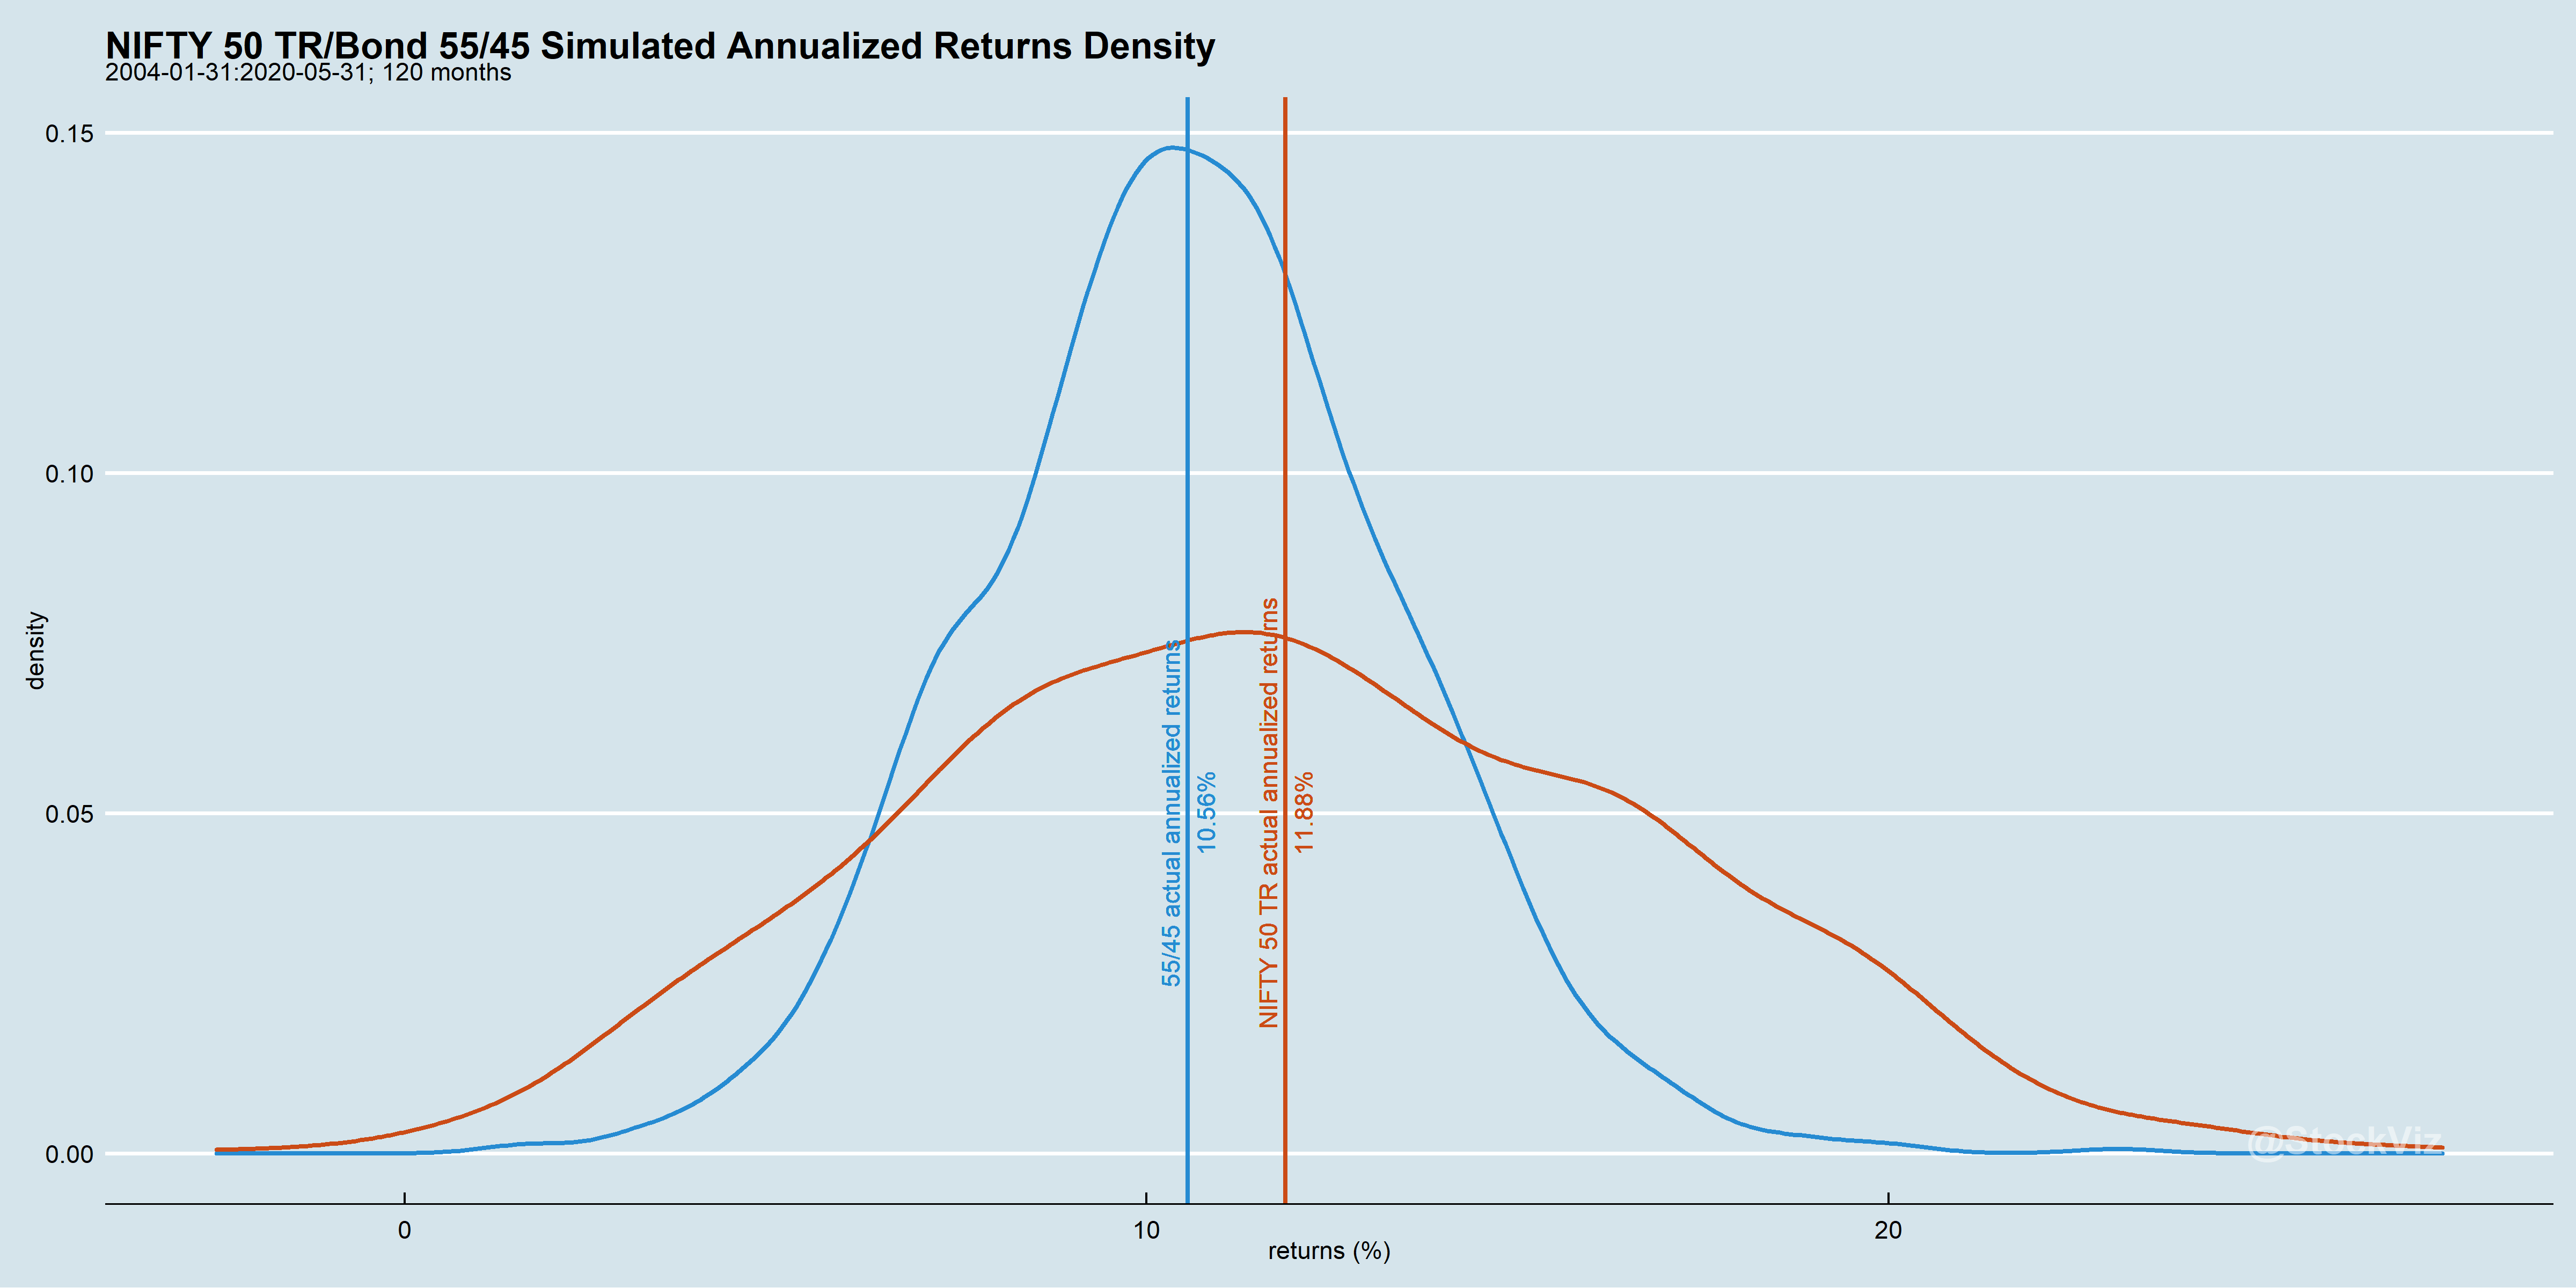
Note the lower drawdowns of diversified portfolios. While the equity-only portfolio would have had an annualized return of 11.88% during the period, diversified portfolios ranged from 10.10% – 10.56%. The trade-off is that diversified portfolios have vastly less sequence risk.

The left-tail has been flattened while returns are now clustered more towards the average

Diversification changes the shape of the return distribution so that an average investor has a greater probability of experiencing average returns.

Read more about portfolio allocation across different assets here.

Code and images are on github.

Asset Allocation and Taxes

Simple portfolio asset allocations should start with a mix of equities and bonds. Typically, a 60/40 or a 70/30 split between them is suggested as a good starting point. The big questions are:

  1. What are the trade-offs between 60/40 and 70/30?
  2. Should you stick to large-caps or use mid-caps for the equity leg?
  3. Should you rebalance every month or is an annual rebalance enough?
  4. Should you invest the legs separately or opt for an equity-oriented balanced fund?

60/40 vs. 70/30 * Large vs. Mid-caps

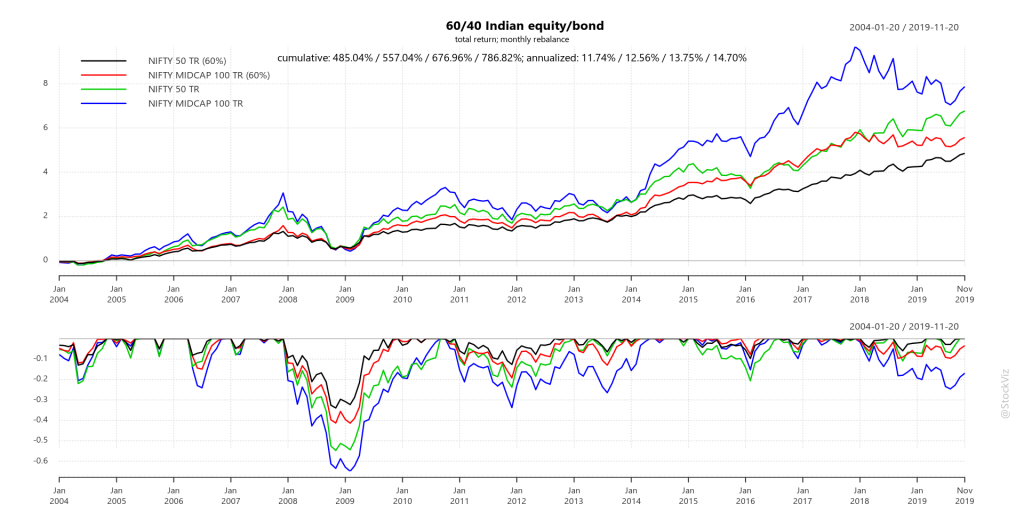
60/40, monthly rebalance
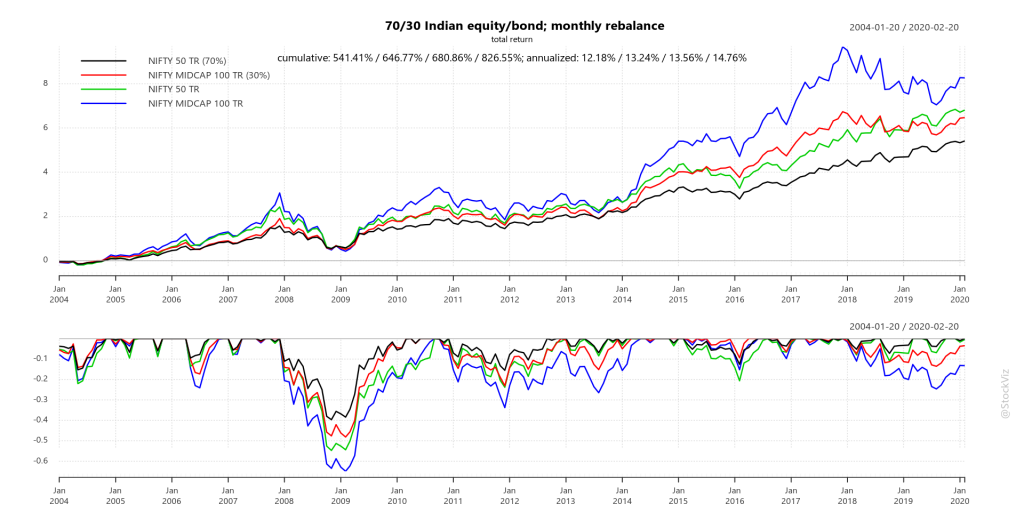
70/30, monthly rebalance

From a drawdowns point of view, using the large-cap NIFTY 50 index seems to deliver a smoother ride to the investor. However, there is hardly any difference between the drawdown profile of the 60/40 vs. that of the 70/30. From a returns point of view, a 70/30 portfolio has about a point over the 60/40.

So, risk-averse investors should probably go with a large-cap 70/30 mix. And for those who want reach a bit, a mid-cap 70/30 should do the trick.

Monthly vs. Annual Rebalance

The less frequently you rebalance your portfolio, the less you pay out in transaction costs. However, with a lower frequency of rebalances, you run the risk of one piece of your portfolio overshadowing the rest and dictating the overall risk of the portfolio.

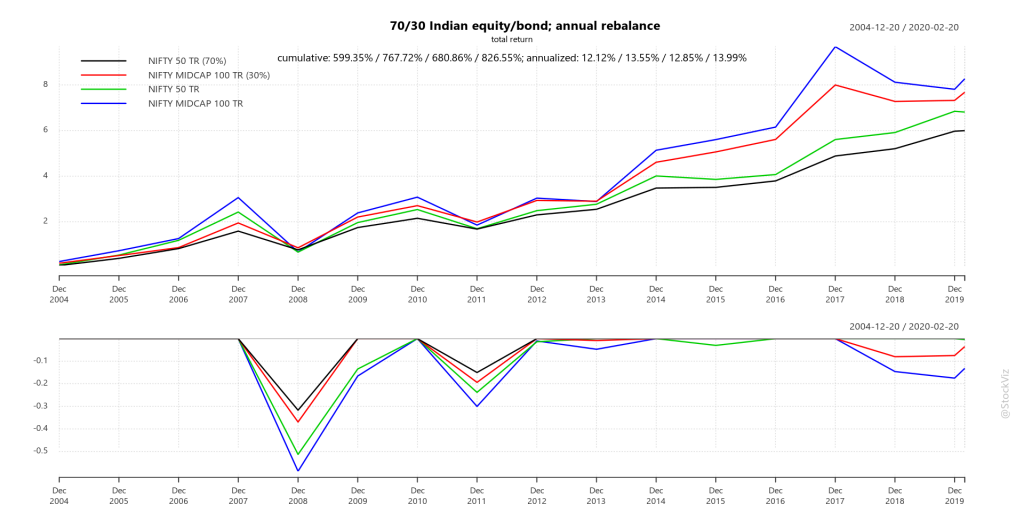
70/30, annual rebalance

For a 70/30 portfolio, it appears that an annual rebalance has negligible effect on portfolio returns or drawdowns.

Tax impact – DIY vs. Mutual Fund

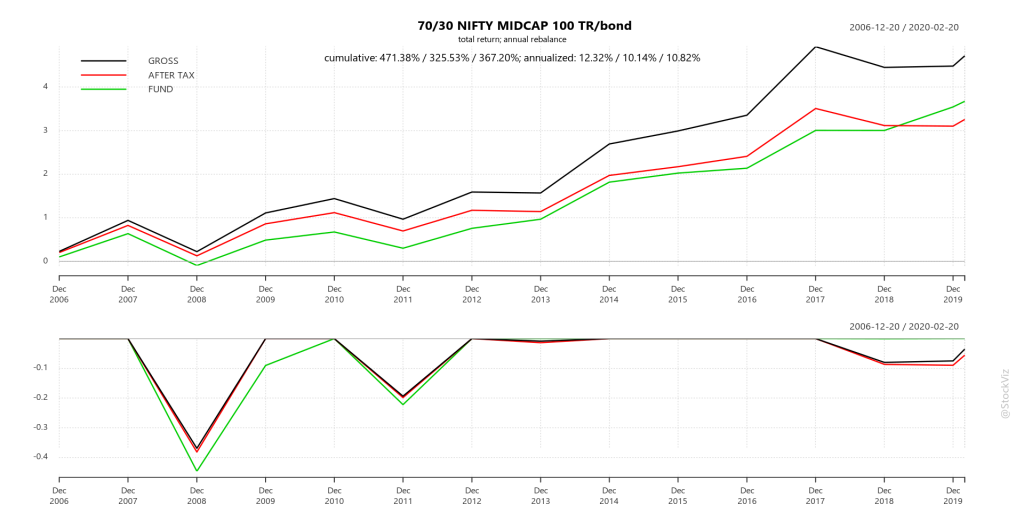
If you choose to implement the legs of the portfolio separately, then you create a taxable event every time you rebalance. A mutual fund, on the other hand, has no such drag.

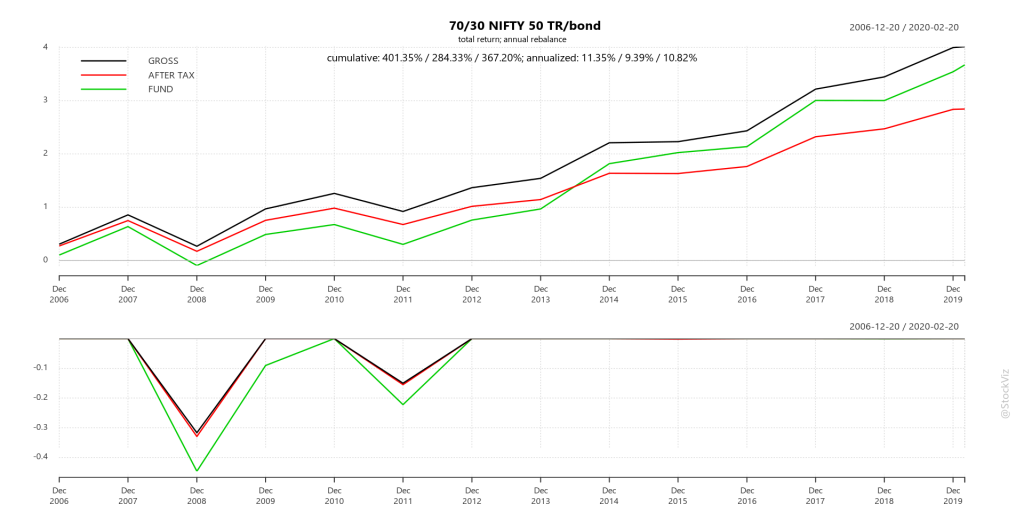
70/30 large-cap, after tax vs. equity-oriented hybrid fund
70/30 mid-cap, after tax vs. equity-oriented hybrid fund

Taxes seem to lop-off about 2% of annualized returns in the DIY portfolio while the mutual fund gets to compound it throughout. In both the large-cap and mid-cap scenarios, an equity-oriented hybrid fund comes out ahead.

If you were set this up as an SIP, then it is possible to avoid selling positions by just buying the asset that has fallen below its target. So taxes predominantly dent lumpsum investment returns.

Conclusion

If you are an SIP investor, then a DIY 70/30 large-cap or mid-cap portfolio (if you are willing to bear a bit more volatility) should do the trick. But lumpsum investors should probably shop around of a decent equity-oriented hybrid fund.

Related: Allocating a Two-Asset Portfolio

Check out the code for this analysis on pluto: 60/40 and 70/30. Questions? Slack me!

Asset Allocation

Introduction

How does an equity/bond 2-asset portfolio look like?
Read: Allocating a Two-Asset Portfolio

A three asset portfolio

Indian midcaps + bonds with Nasdaq-100 ETF. Is there a benefit to using portfolio optimization algorithms after taxes and transaction costs are taken into account?
Read: Allocating a Three-Asset Portfolio, Equal Weighted and Allocating a Three-Asset Portfolio, Optimized

Adding gold into the mix

Does gold have a role to play in a systematic, diversified portfolio?
Read: Allocating a Four-Asset Portfolio

Investing in a systematic, diversified portfolio

A ready-to-invest Theme, the EQUAL-III, that takes care of keeping track of everything.
Read: The EQUAL-III Theme

Expected Returns

What are the range of expected SIP returns under prudent asset allocation schemes?
Read: SIP: Expected Returns

Volatility and Allocation

Think in terms of volatility buckets, not assets

This post is part of our series on diversification and asset allocation. Previously:

  1. Diversification and its Malcontents

  2. The Permanent Portfolio

  3. Sequence Risk and Asset Allocation

  4. Static vs. Tactical Allocation

  5. Tactical Allocation


The thrust of our previous posts on allocation was that Indian investors shouldn’t blindly copy strategies that worked well in the US. There are a lot of qualitative arguments to be made to support a India-dominant view for allocation strategies. In this post, we introduce a quantitative aspect to the discussion.

It is Volatility, Stupid!

In finance, more than any other field, it is very easy to get correlation and causation mixed up.

A man goes to the doctor and says, “Doctor, wherever I touch, it hurts.”
The doctor asks, “What do you mean?”
The man says, “When I touch my shoulder, it really hurts. When I touch my knee – OUCH! When I touch my forehead, it really, really hurts.”
The doctor says, “I know what’s wrong with you. You’ve broken your finger!”

There are no universal laws for an asset class that holds across geographies and economic systems. The reason why a 60/40 Portfolio “works” in the US has more to with the quantitative aspects of the assets being mixed than what they are called. US bonds have benefitted greatly from a 30 year slide in yields, benign inflation and a flight-to-safety bid. None of these hold true for Indian bonds. So, expecting a 60/40 Indian portfolio to behave like a 60/40 US portfolio just because you mixed the same assets together is idiotic.

The most import aspect while considering assets for diversification are their volatilities. Specifically, the correlation of their volatilities at their left tails.

To keep things simple, consider a 2 asset portfolio: Eq and X. Eq has some average return that will be held constant during this analysis. What changes is its standard deviation (aka, volatility.) X is a stable asset with zero volatility (think of it as a fixed deposit.) How does different allocations to Eq change portfolio returns and volatility?

  1. Low volatility is supportive of higher allocations

  2. Higher allocations to the higher volatility asset progressively reduces the predictability of portfolio returns

Volatility is Volatile

Asset return volatility is itself volatile.

The past performance of a diversified portfolio is based on the realized volatility of its components. However, volatility itself is unpredictable over long periods of time.

Take-away

While considering assets to diversify into, look at the volatility of the asset rather than what it is called.

Don’t expect the quantitative aspect of an asset class to transcend economic systems – different markets need different treatments.

All investing is forecasting. And all allocation is forecasting volatilities.