Search: “asset allocation”

NPS Tier II: Bogleheads Rejoice!

Did T2 kill NIFTY 50 ETFs and Index funds?

Instead of looking at NIFTY 50 ETFs or index funds, why not invest in NPS Tier II Class ‘E’? Unfortunate nomenclature aside, it is hard to beat the 0.01% management fee and the flat Rs. 190/- annual account maintenance fee. Compare that to how much you would pay if you go through:

  1. broker: brokerage + STT + stamp duty + SEBI turnover fee + service tax.
  2. direct through AMC: expense ratios between 0.26% and 1.03% (!)

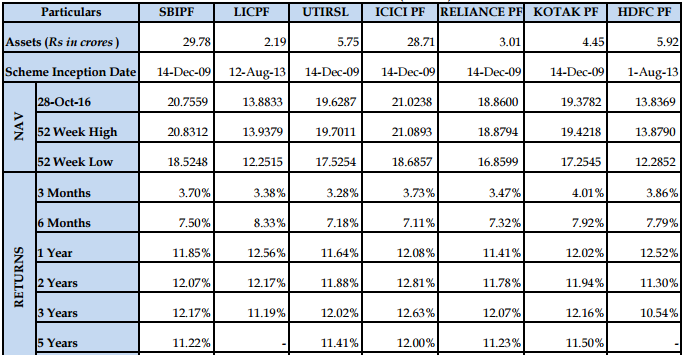
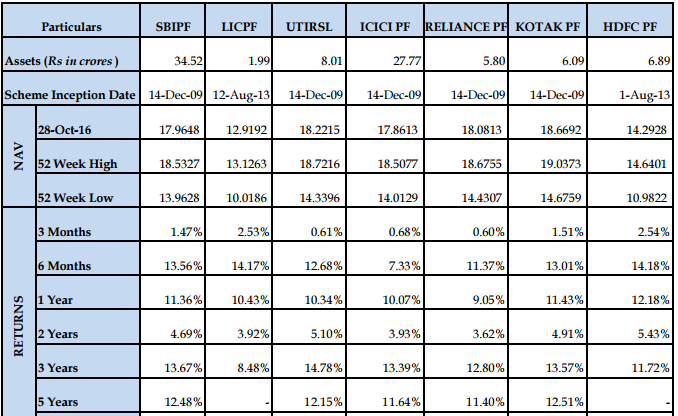
As of 28th October 2016, 5-year returns across different pension fund managers are between 12.5% and 11.4%. A rough comparison with Birla Sun Life’s Index Direct Fund points to a 10.10% return over the same time-frame. Directly attributable to the lower fee structure of NPS.

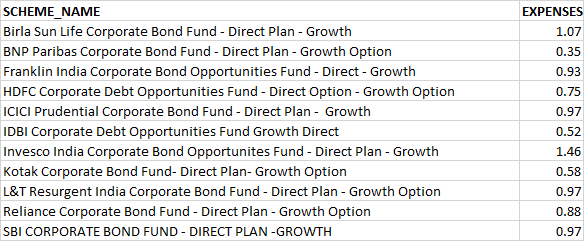
The same treatment extends to corporate and government bond funds (Class ‘C’ and Class ‘G’, respectively) as well. Class ‘C’ 5-year returns have been between 11.2% and 12%. Birla Sun Life Corporate Bond Fund (direct) points to a 11% return over the same time-frame. Direct plan expense ratios for corporate bond funds are around 1%. What exactly are you getting for paying 100x more than through NPS?

If you are a Boglehead saving for retirement, you will love the ‘Auto’ feature (Class ‘A’) that automatically shifts the asset allocation from Equity to Debt as you near retirement. All for 0.01%.

If low fees and index investing is all that you care about, then NPS Tier I (tax efficient but with an annuity requirement at the end) and Tier II (just like any other investment ‘folio’) is something you should seriously consider.

Appendix

NPS charges (FAQ)

NPS SCHEME – E (Tier-II) performance (source)
nps-t2-class-e

NPS SCHEME – C (Tier-II) performance

nps-t2-class-c

Expense ratios of index fund (direct plans)

index-fund-expense

Expense ratios of corporate bond funds (direct plans)
corp-bond-fund-expense

The Problem with Dynamic P/E Funds

Executive Summary

Dynamic P/E funds use the market Price-to-Equity ratio to decide on allocation. If the P/E ratio is deemed too high, they allocate more to bonds or arbitrage strategies and if the P/E ratio is low, they allocate more towards equities. This logic sounds good on paper. However,

  1. The market always appears expensive around turnarounds – investors miss out on the recovery trade.
  2. The market always appears cheap during downturns – investors end up being long equities when bonds tend to outperform.
  3. It doesn’t protect against volatility as a pure-play bond fund would (bad fit if you are risk-averse.)
  4. It doesn’t give you the returns of a pure-play equity fund (bad fit if you are risk-seeking.)
  5. Since it dampens volatility, it doesn’t make sense to dollar-cost-average (bad fit if your looking for an SIP.)

It is a solution looking for a problem.

Analysis

We thank Franklin Templeton for running the Dynamic PE Ratio Fund Of Funds to perform our analysis. This is probably the only fund where a true apples-to-apples comparison can be made between a pure-play equity fund, a pure-play bond fund and a dynamic PE fund.

The Dynamic PE fund invests x% in the Franklin India Short Term Income Plan and 100-x% in the Franklin India Bluechip Fund based on the P/E ratio. All we have to do is look at how a buy-and-hold strategy of the components compare to the Dynamic PE fund to gauge the effectiveness of the strategy.

Dynamic PE vs. pure-play Equity

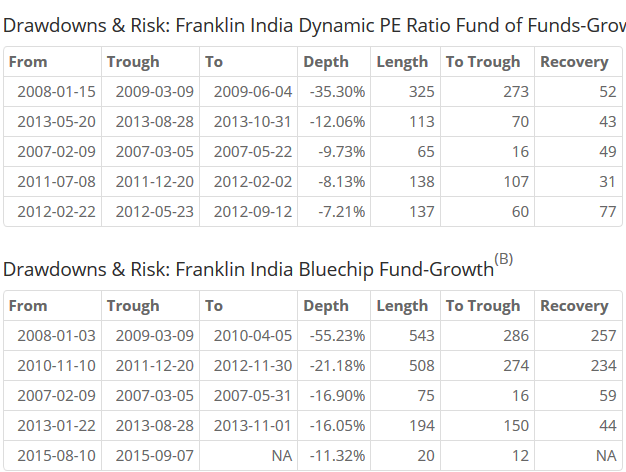
Between 2007-01-02 and 2015-09-23, Franklin India Dynamic PE Ratio Fund of Funds-Growth’s IRR was 10.93% vs. Franklin India Bluechip Fund-Growth’s IRR of 11.53%

Franklin India Dynamic PE Ratio Fund of Funds vs. Franklin India Bluechip Fund

drawdowns dyn pe vs. bluechip

Similar returns. Lesser drawdowns. Lump-sum investors will probably be fine with these returns.

Dynamic PE vs. pure-play Bonds

First, let’s compare the Dynamic PE fund to the Short Term Income Plan.

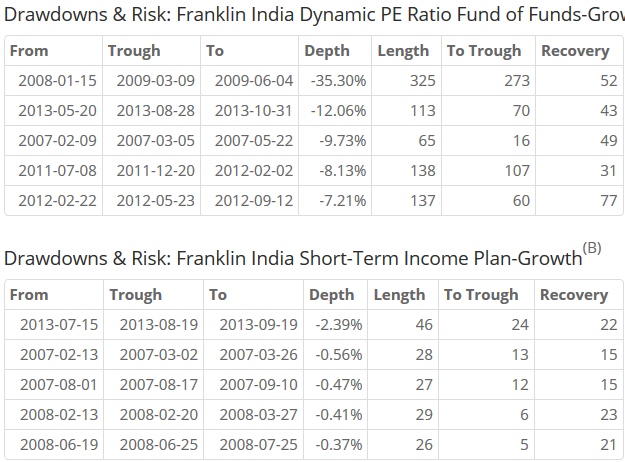
Between 2007-01-02 and 2015-09-23, Dynamic PE Ratio had an IRR of 10.93% vs. Short-Term Income Plan’s IRR of 9.49%

drawdowns dyn pe vs. liquid fund

For investors worried about drawdowns, just investing in the liquid fund would have given similar returns with a lot less risk. A 35% drawdown is a lot for a fund that gives bond-like returns.

A bond fund like the Birla Sun Life Dynamic Bond Fund, for example, had an IRR of 9.65% over the same time period

Conclusion

Using the P/E ratio for asset allocation is a bad idea. Investors would have experienced similar returns but with smaller drawdowns if they had invested in a regular bond fund instead.

Related: Dynamic PE Funds

The Problem with Balanced Funds

Returns vs. Volatility

Balanced funds are those that invest in both stocks and bonds. The exact allocation is up to the fund manager. For example, the Tata Balanced fund is right now 22.85% in bonds and the rest in equities, according to Morningstar.

tata balanced asset allocation

Balanced funds are pitched as having lesser risk than equity-only funds. But what investors gain in lesser volatility, they give up on lower returns and higher fees.

Tata Balanced vs. ICICI Pru. Value Discovery

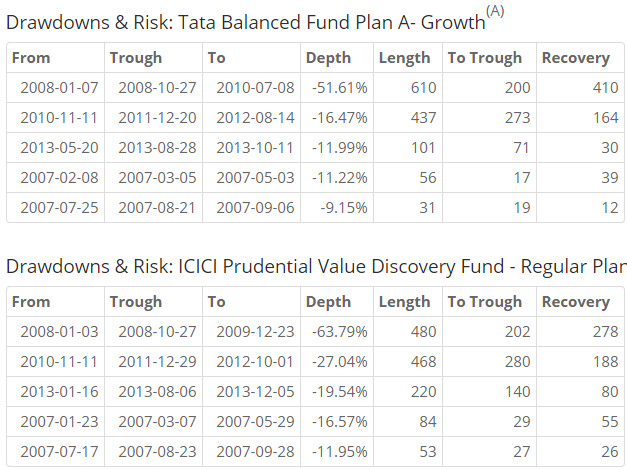
Between 2007-01-02 and 2015-06-02, Tata Balanced Fund has returned a cumulative 235.97% with an IRR of 15.48% vs. ICICI Prudential Value Discovery Fund’s cumulative return of 316.55% and an IRR of 18.47%download

Compare the drawdowns:

drawdowns tatas vs icici

For the moderate-risk taking investor who is typically attracted to balanced funds, a 16% drawdown hurts just as much as a 27% drawdown.

When it comes to fees, Tata’s has an expense ratio of 2.91% vs. ICICI’s 2.34%. Is the extra 50bps worth the safety offered?

HDFC Balanced Fund vs. ICICI Pru. Value Discovery

It is a similar deal with HDFC’s Balanced fund as well: lower returns (IRR: 15.24%) and no escape from double-digit drawdownsdownload

Conclusion

The sales-pitch for balanced funds focus on the investors availability heuristic where people tend to heavily weigh their judgments toward more recent information, making new opinions biased toward that latest news. Ever since the market corrected in March a growing flock of blogs and articles started pitching balanced funds. But before you fall for the marketing pitch, take a step back and ensure that you are not giving too much away for perceived safety.

The Best Mutual Funds – Quantitative

Introduction

Mutual fund investors are faced with a zillion choices in the marketplace. At last count, there were more than 5300 different schemes that an investor could choose from. When confronted with such a large number of choices, investors either spiral into an “analysis paralysis” mode and end up doing nothing or blindly invest in whatever their broker recommends – both these paths lead to situations that are injurious to the investor’s long-term financial health.

In this post, we try to simplify the choices in front of the investor by ranking the top 10 funds based these risk metrics: sharpe ratio, bear-beta, information ratio, draw-down depth and draw-down length between Jan-2010 and May-2015.

Sharpe Ratio

Bear-Beta

Information Ratio

The information ratio is a ratio of the portfolio’s returns above the returns of a benchmark (CNX MIDCAP, in this case) to the volatility of those returns.

This is probably a better metric than the Sharpe ratio to rank funds.

Nice to see that both the Value Discovery fund and an MNC fund make this list.

Draw-down Depth

Draw-down depth measures the max-loss from peak valuation.

For example, the Blended Plan at the top of the list only lost 0.35% from its peak valuation between 2010 and 2015.

Portfolios with a lot of short-term bonds test well for this metric. But note the pathetic IRRs – no pain = no gain!

Draw-down Length

The draw-down length is a measure of how many days it took the fund to get back the previous peak valuation after a draw-down.

Shorter bounce-backs typically indicate high-quality portfolios.

Nice to see both the MNC funds make this list.

Past Performance

Conclusion

We looked at broad spectrum of funds – including those with bond allocations – to ferret out a good set of funds that investors can consider. Depending on what is more important to the investor, the appropriate set of metrics can be weighted to fit individual risk appetites.

Mutual fund investors whom we advise will immediately recognize some of these funds as they are already part of their portfolios. Get in touch with us if you are looking to invest! Call us or Whatsapp us at +918026650232

How important are your stock picks?

Everyday we are inundated with stock tips: buy this, hold that, etc. There’s even an astrologer who gives out stock-tips, “Ganeshaspeaks” for example. Should you pay attention? Turns out, you don’t.


Studies consistently show that asset allocation is the source of more than 90 per cent of investment returns, while stock selection adds little, perhaps because so many fund managers only make small bets relative to the index they are measured against.


i.e., momentum investing works.

Source:
Bin the crystal ball and follow the money

Related:
Where do returns come from?
Velocity Investment Theme
Momentum 200 Investment Theme