Search: “asset allocation”

Risk Management is Not Free

Now that we are in the middle of a massive virus induced selloff, investors are once again interested in risk management. Similar to how flood insurance is mostly bought after a flood, investors end up paying a hefty premium for fighting the last war. Our experience with offering strategies that try to manage downside risk has been that investors flock to it after a drawdown, only to get disappointed by its returns once the market recovers and getting rid of it right before the next one. Rinse, Repeat.

Risk management is not free

No matter how you hedge your risk (buying options, sell futures, trend-following,) it costs money. There is no system where risk management makes the investor money. So, by definition, hedged investment returns will trail buy-and-hold for long periods of time.

Drawdowns and Returns are sides of the same coin

Equity risk premium exists because of tail-risk that cannot be modeled.
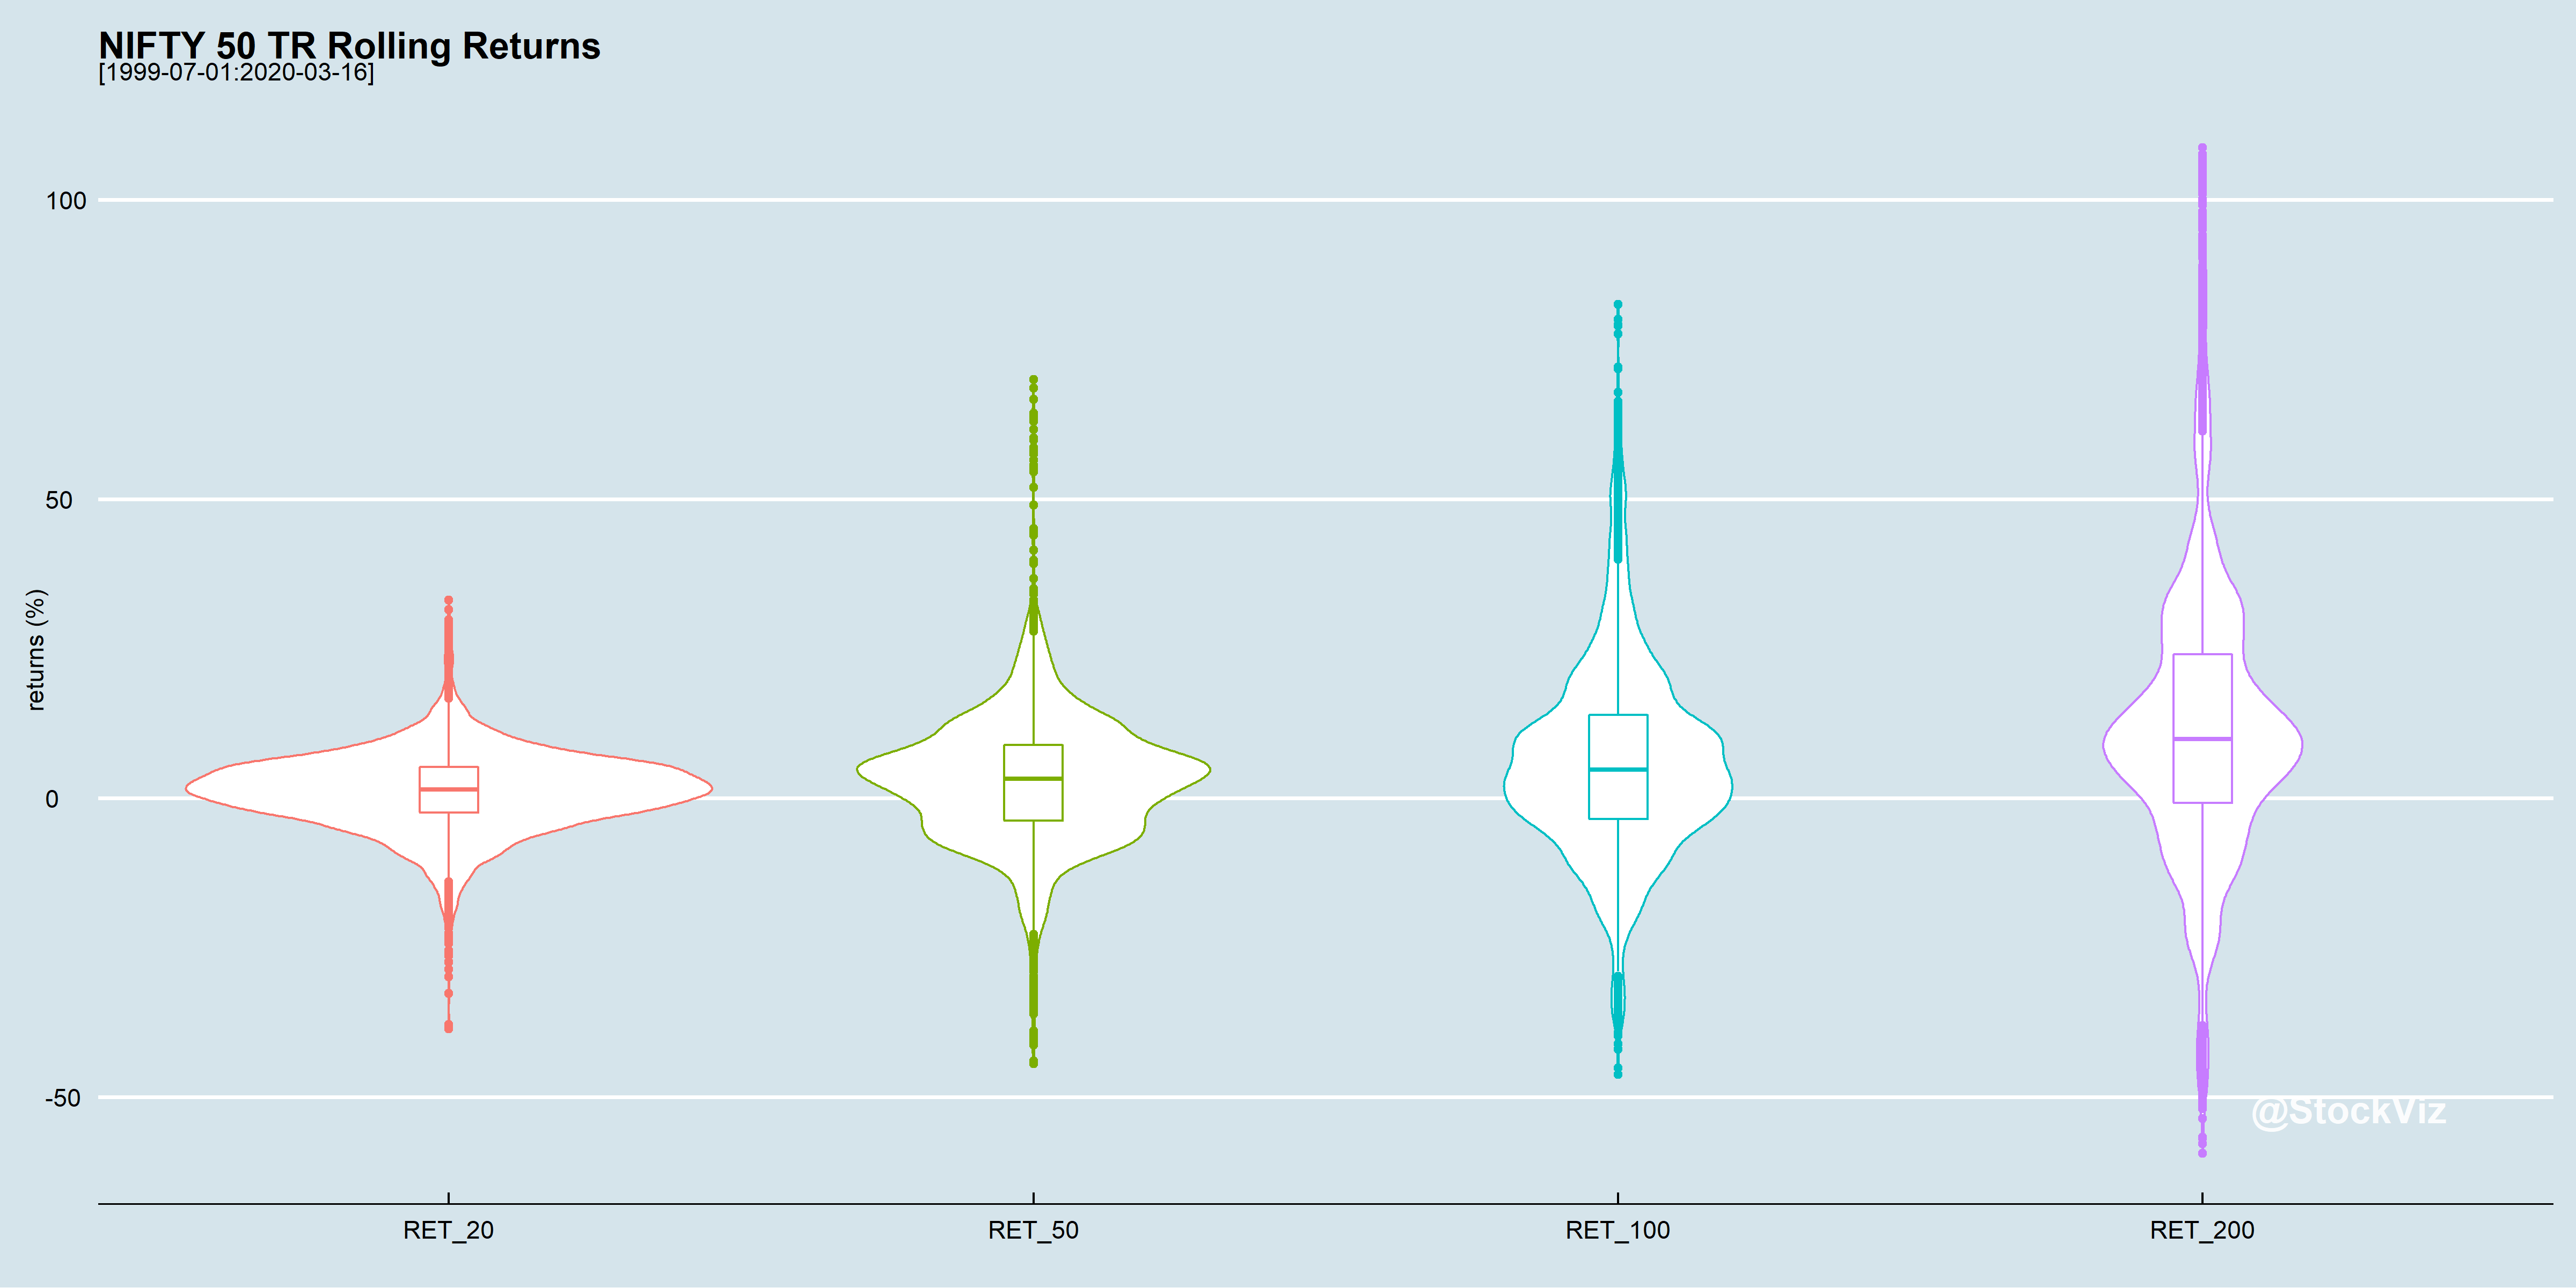
Nothing “normal” about it!

No matter what your time-horizon, there are always periods when you will be deeply in a hole.

Hedging instruments are not perpetual

Equities are perpetual but hedging instruments like futures and options have definite terms. They have their own peculiarities based on risk that is already being priced in vs. true tails.

Simple Moving Averages can help

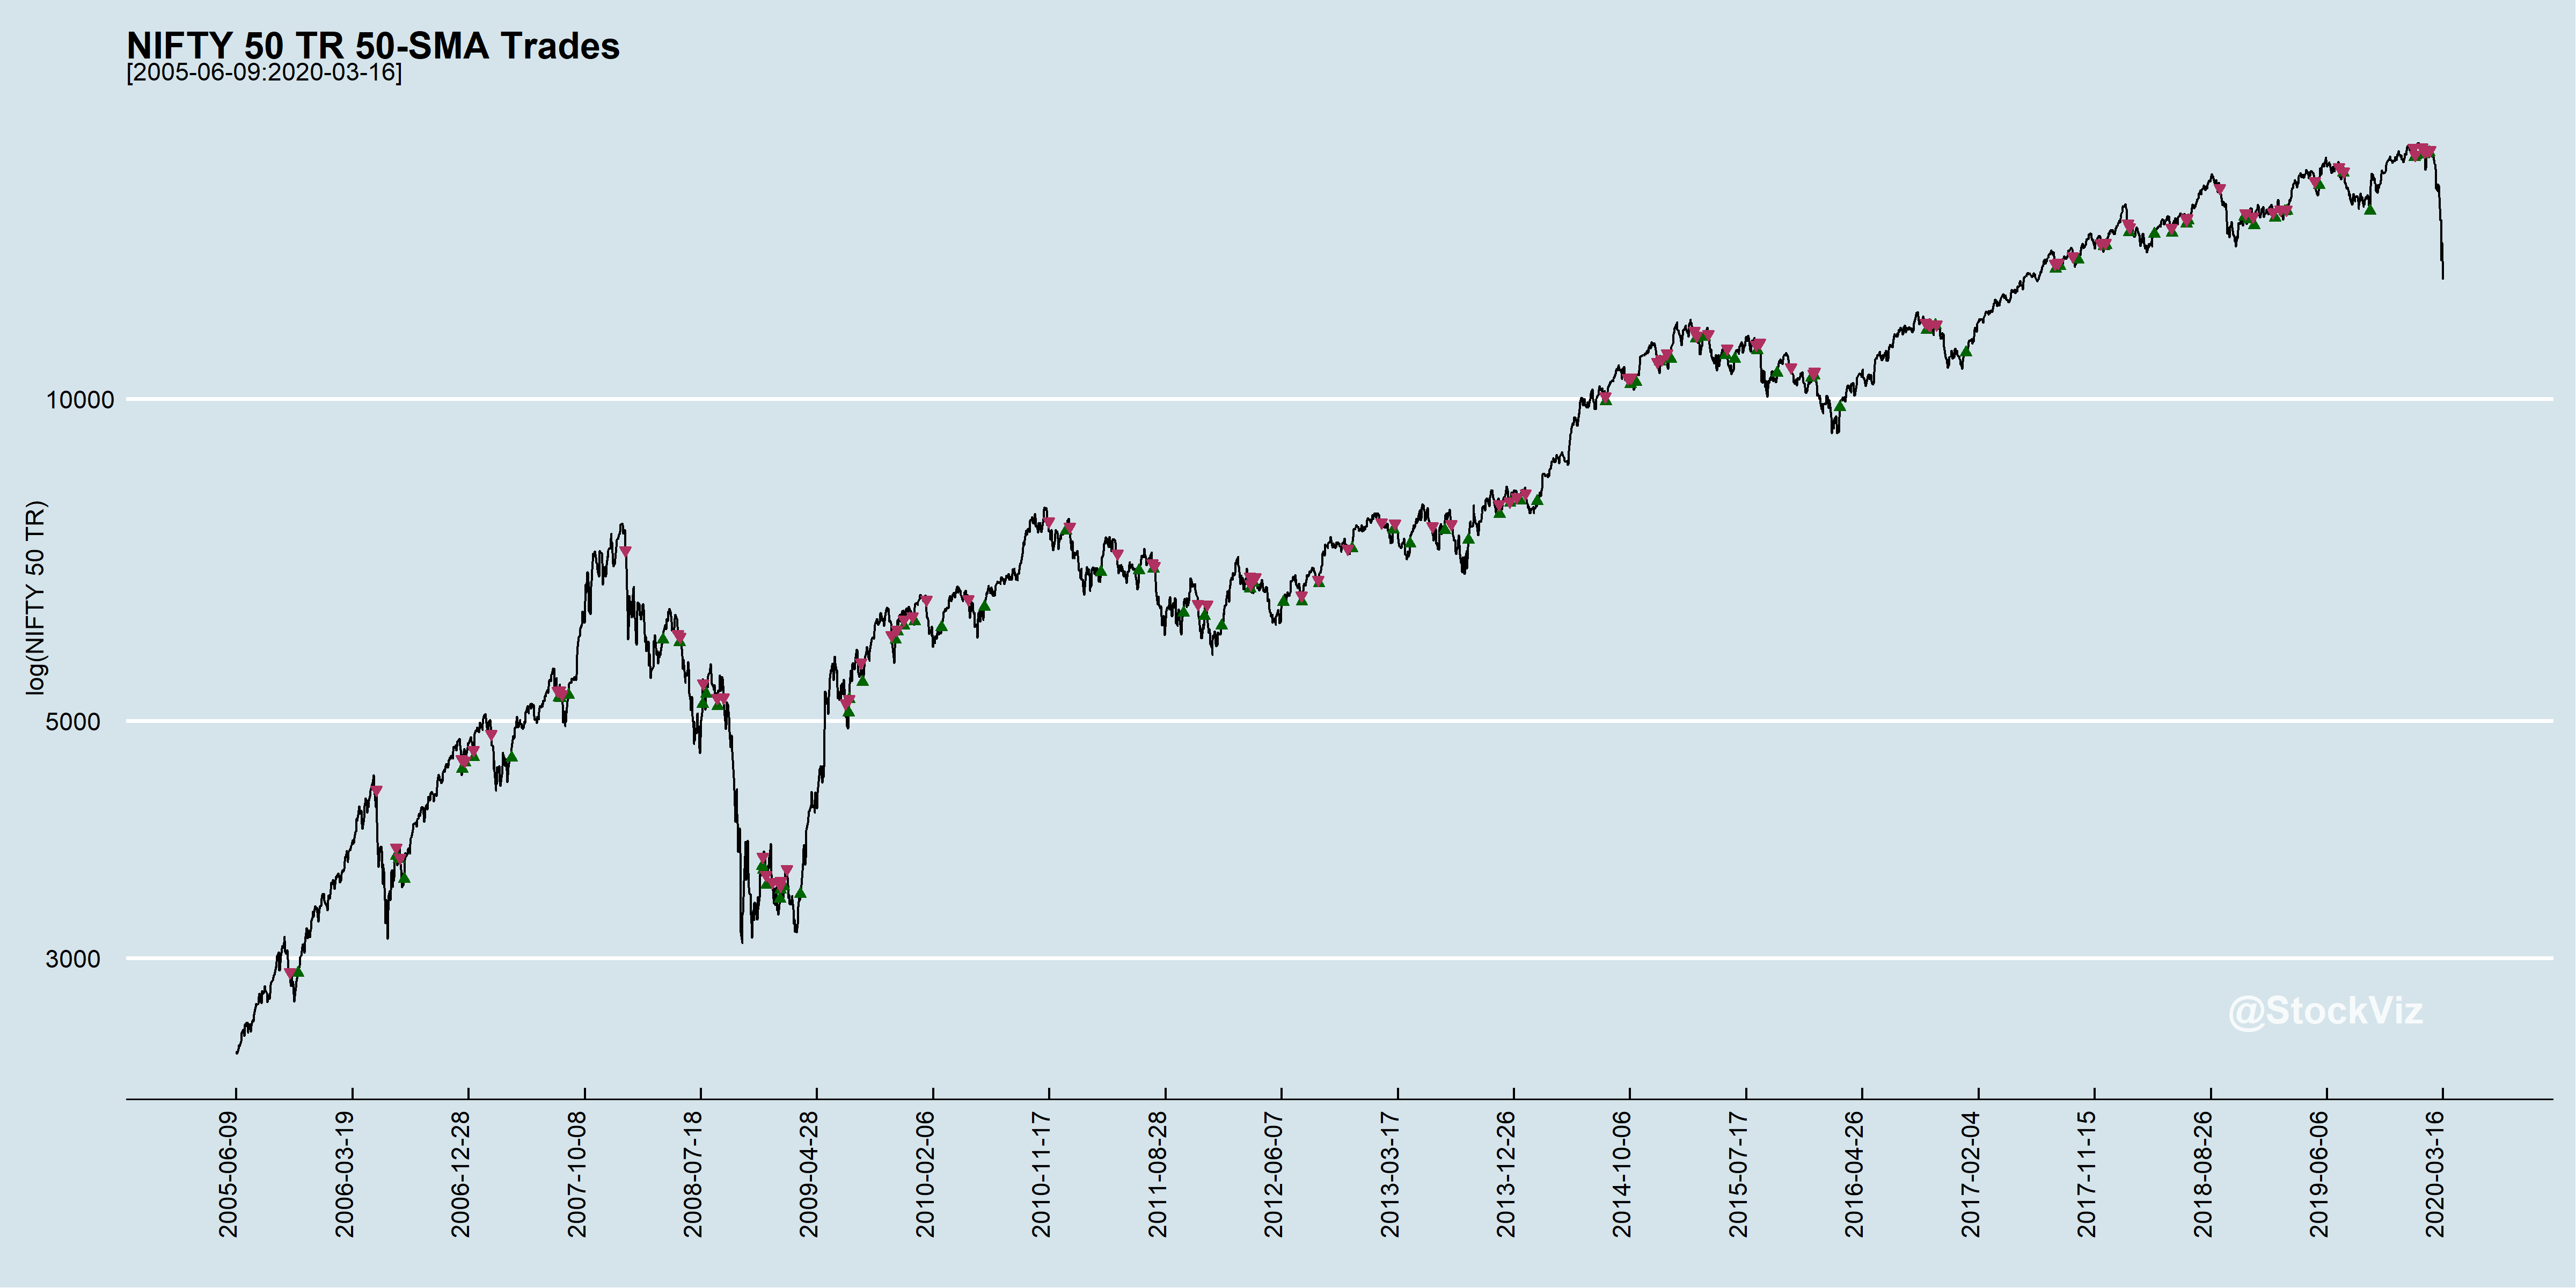
Being long an index only when it above an SMA is one way to overcome the problems highlighted above. It doesn’t involve hedging instruments, so you don’t have to worry about derivative pricing, expiry, etc. The odds are in your favor in terms of the trend being your friend.
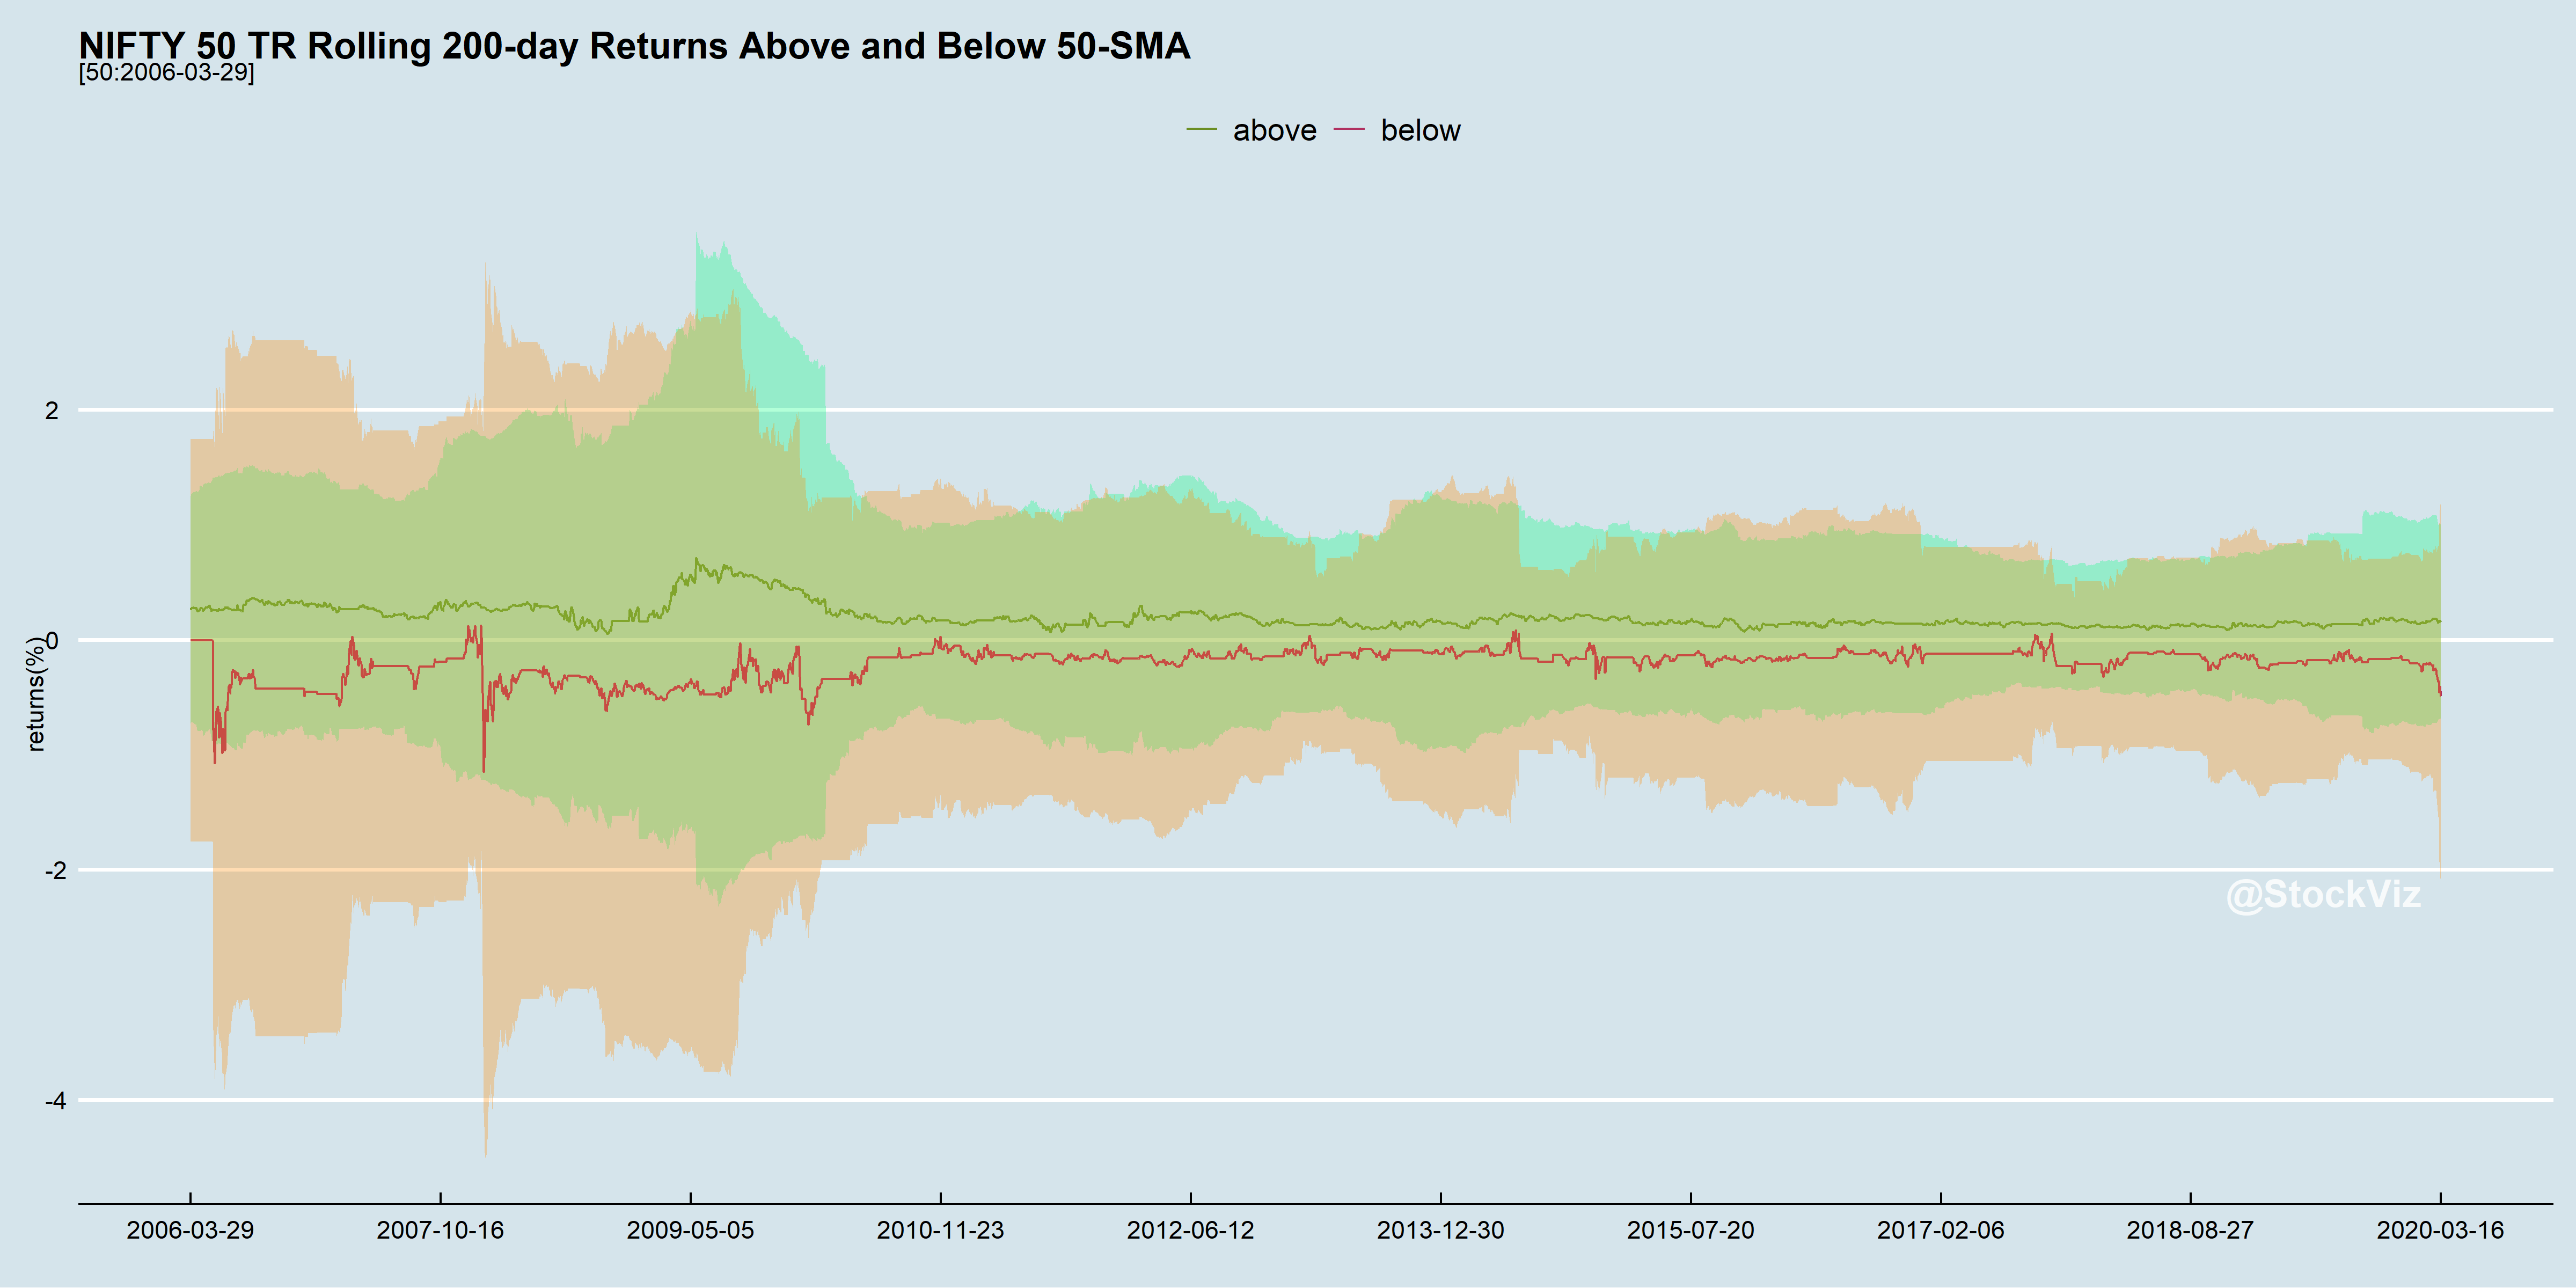
On average, it pays to be long only when the NIFTY is above its 50-day SMA

Most of the large daily moves occur when the index is below the SMA. Higher volatility is not necessarily bad if the drift is higher. But most investors rather sit out the volatility than dive in get their guts punched.
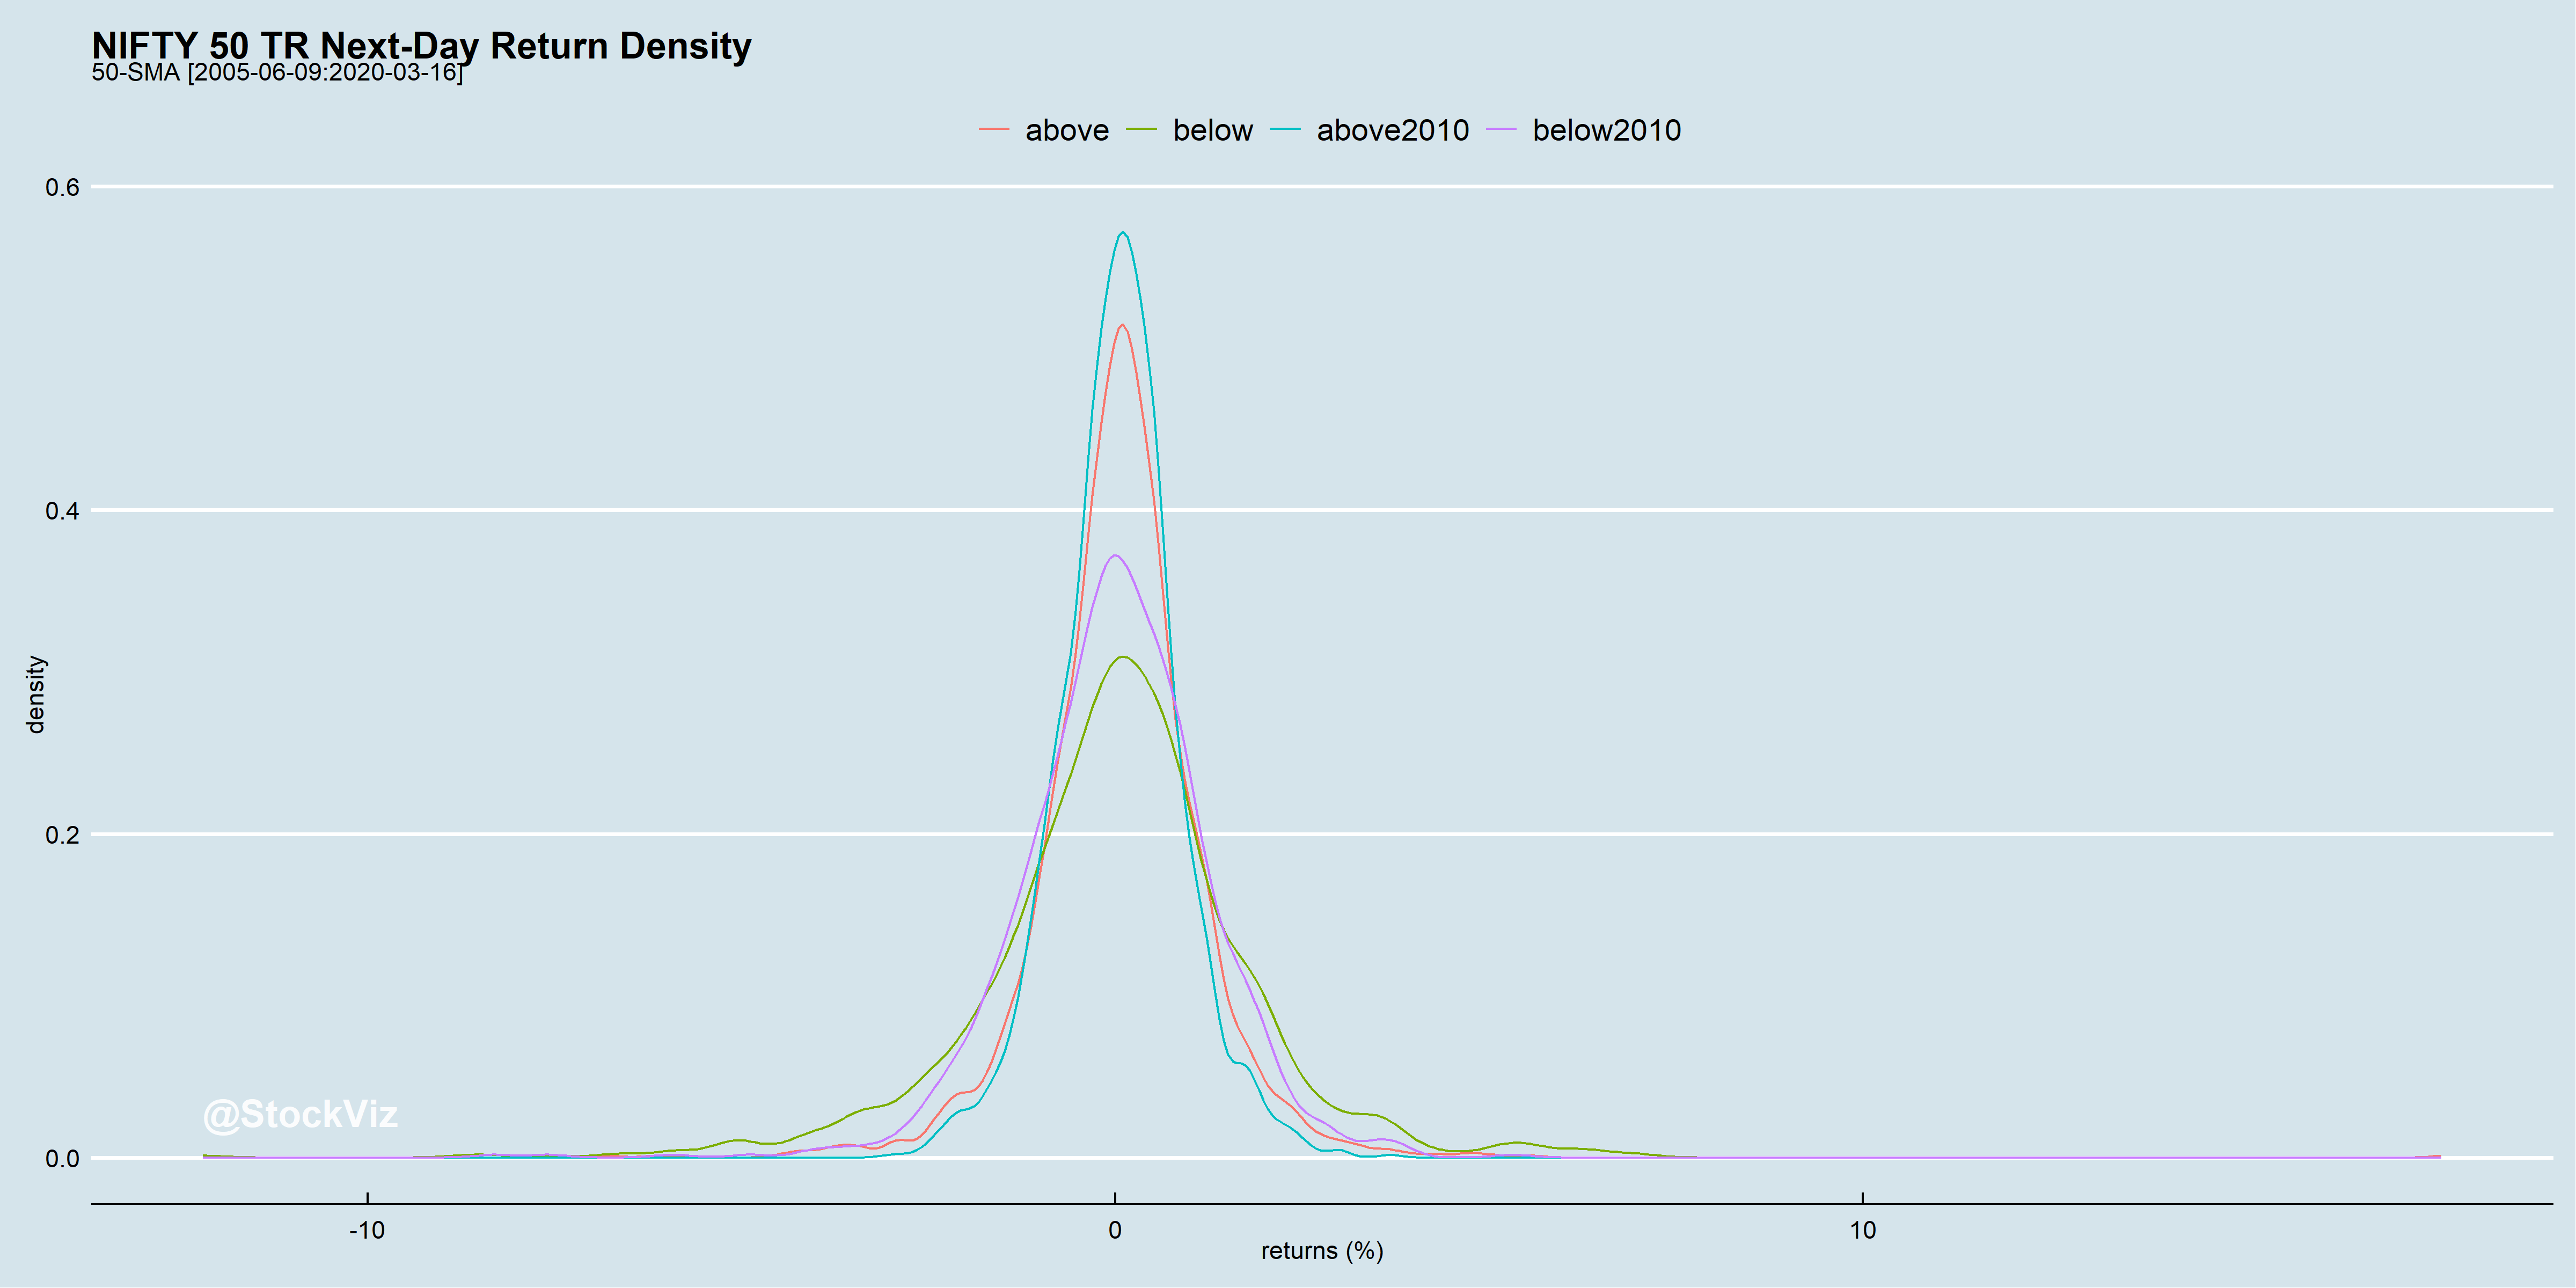
Next-day returns under different SMA “regimes”

What would returns look like if you were long only when the index traded above its SMA? It really depends on your time horizon.
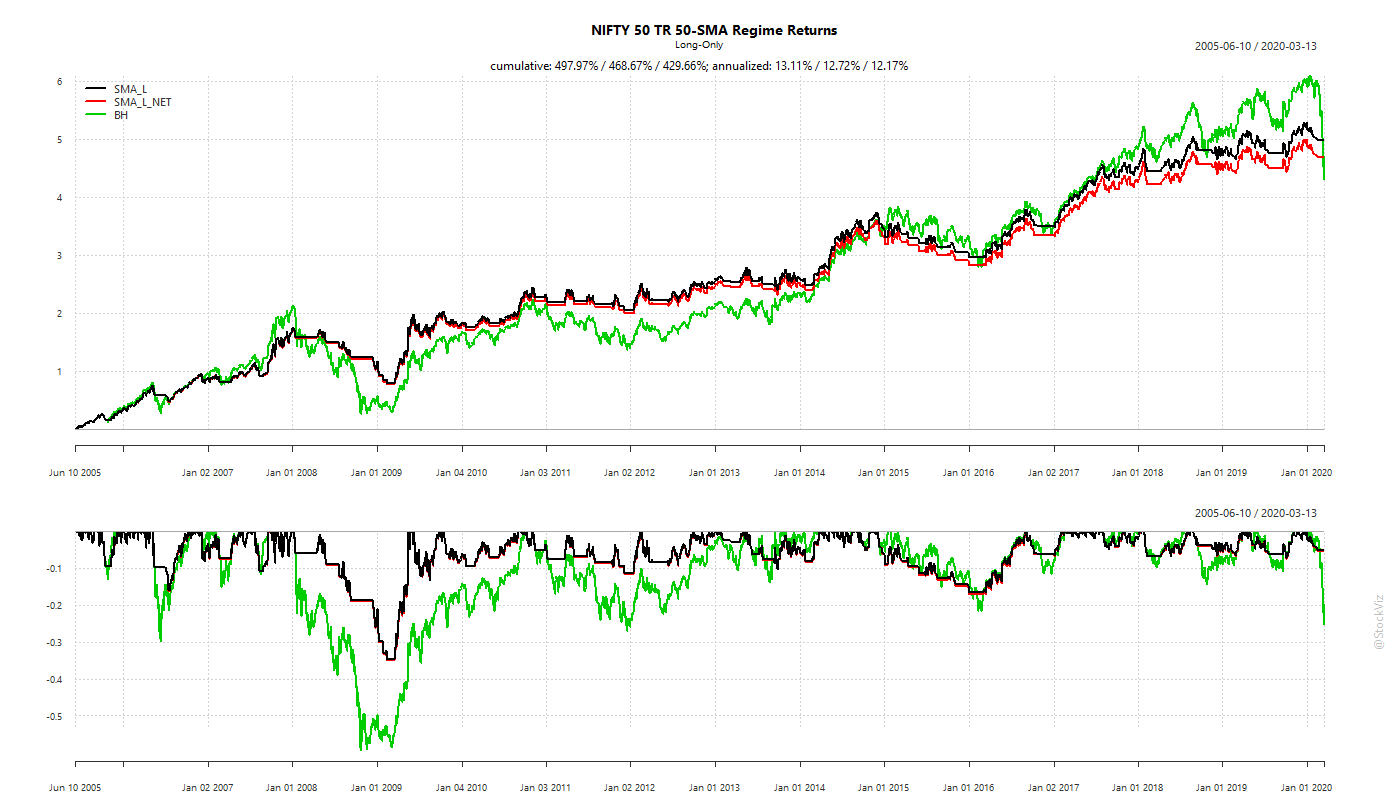
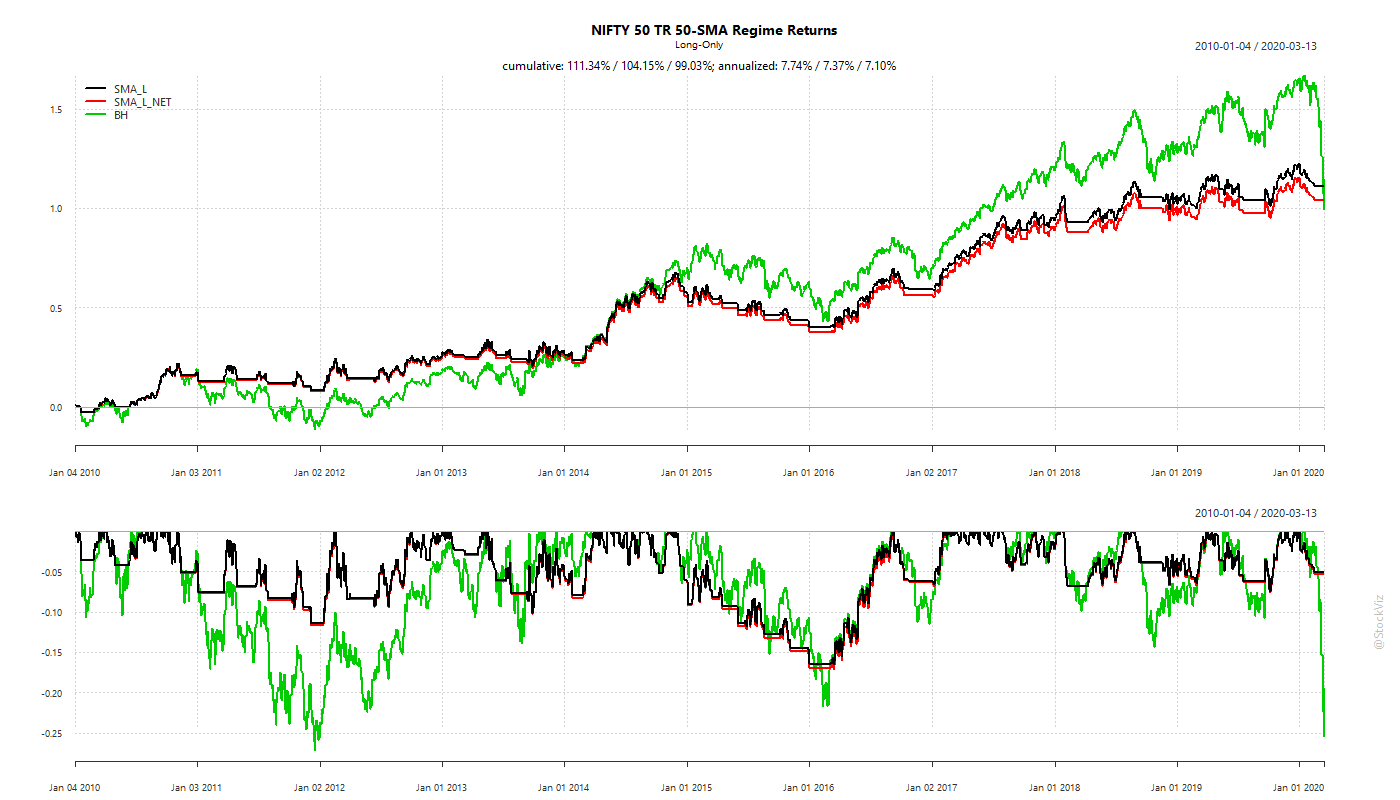
Including the 2008 GFC
Excluding 2008 and subsequent recovery
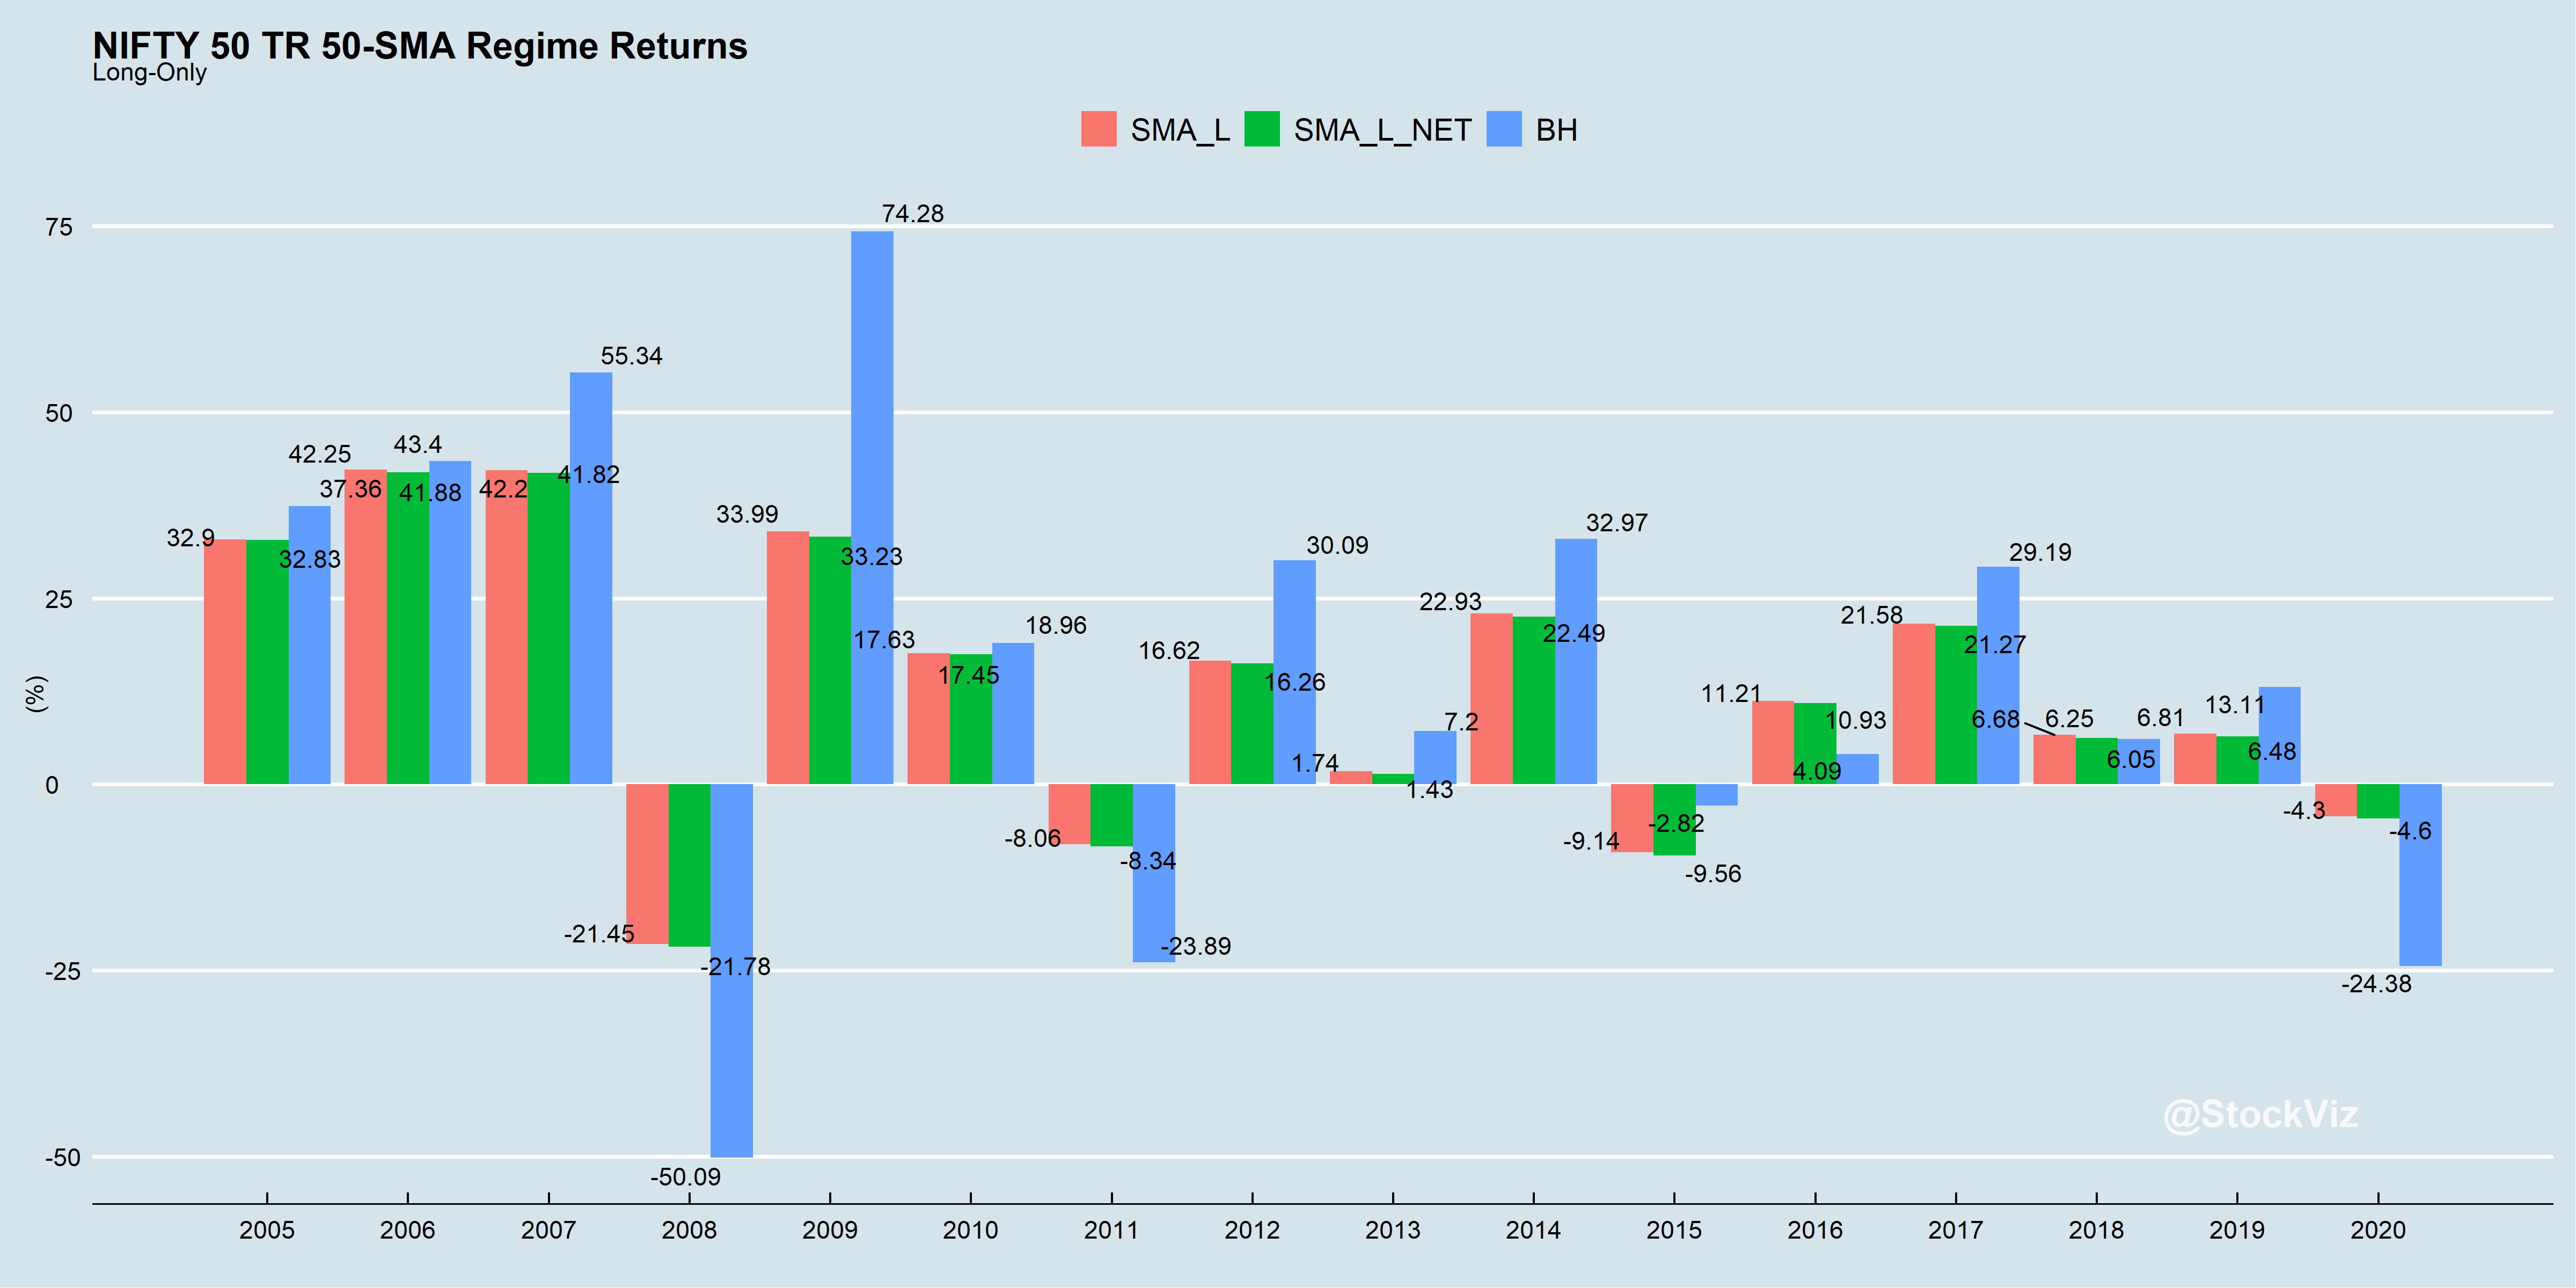
Annual returns
Get ready to be whip-lashed
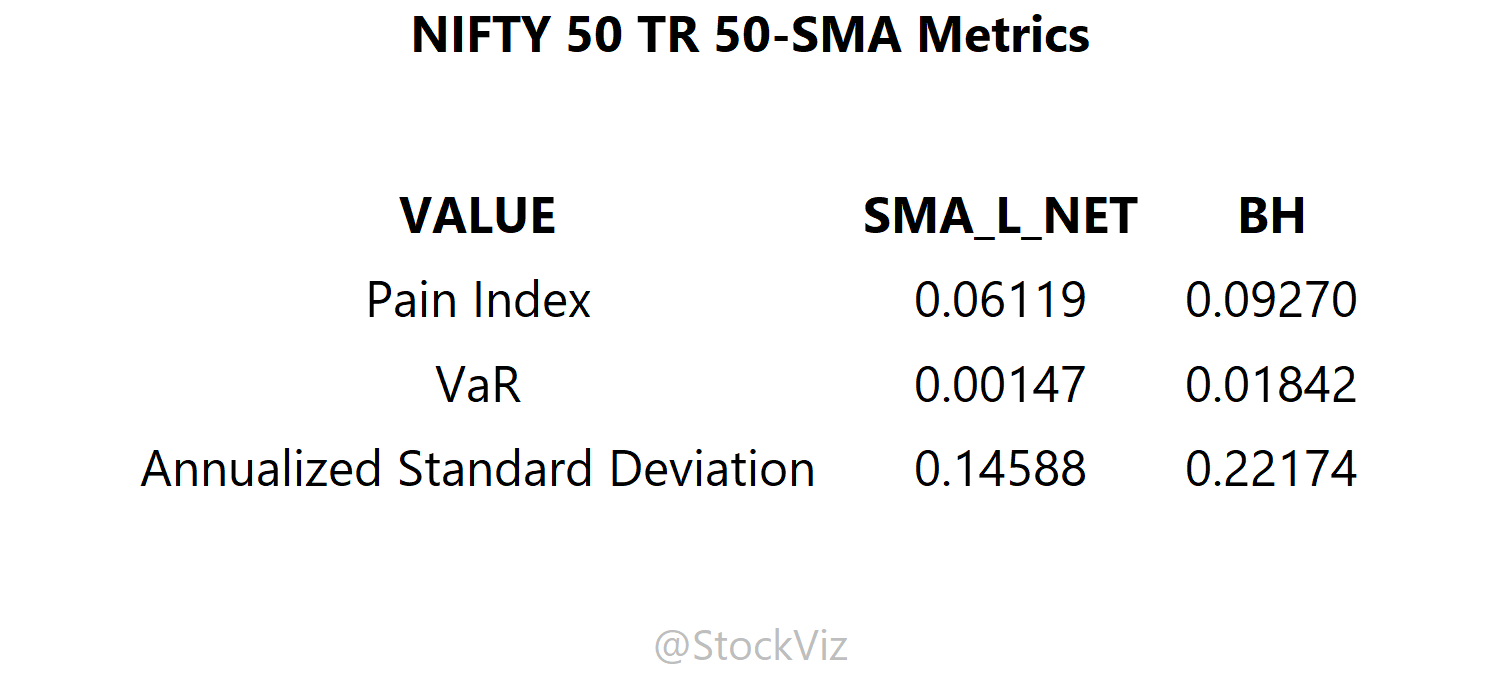
Trade-off between lower volatility and higher costs/gross returns.

Problems

  • When it comes to avoiding drawdowns, you win some, you lose some.
  • Transaction costs matter. The above was modeled using an STT of 0.001% and slippage of 0.05% on the sell side. And capital gains taxes have been ignored.
  • Trading this using ETFs would be sub-optimal. So it is not clear how this strategy can be expressed.
  • Outcomes would depend on holding periods. Investors can go a long time under-performing the index and experiencing every bump that comes along.
  • Shorter the SMA period (50-day shown above is not written in stone,) more the transaction costs and slippage.

Different look-back periods

What if you shortened the SMA period to 20 days?
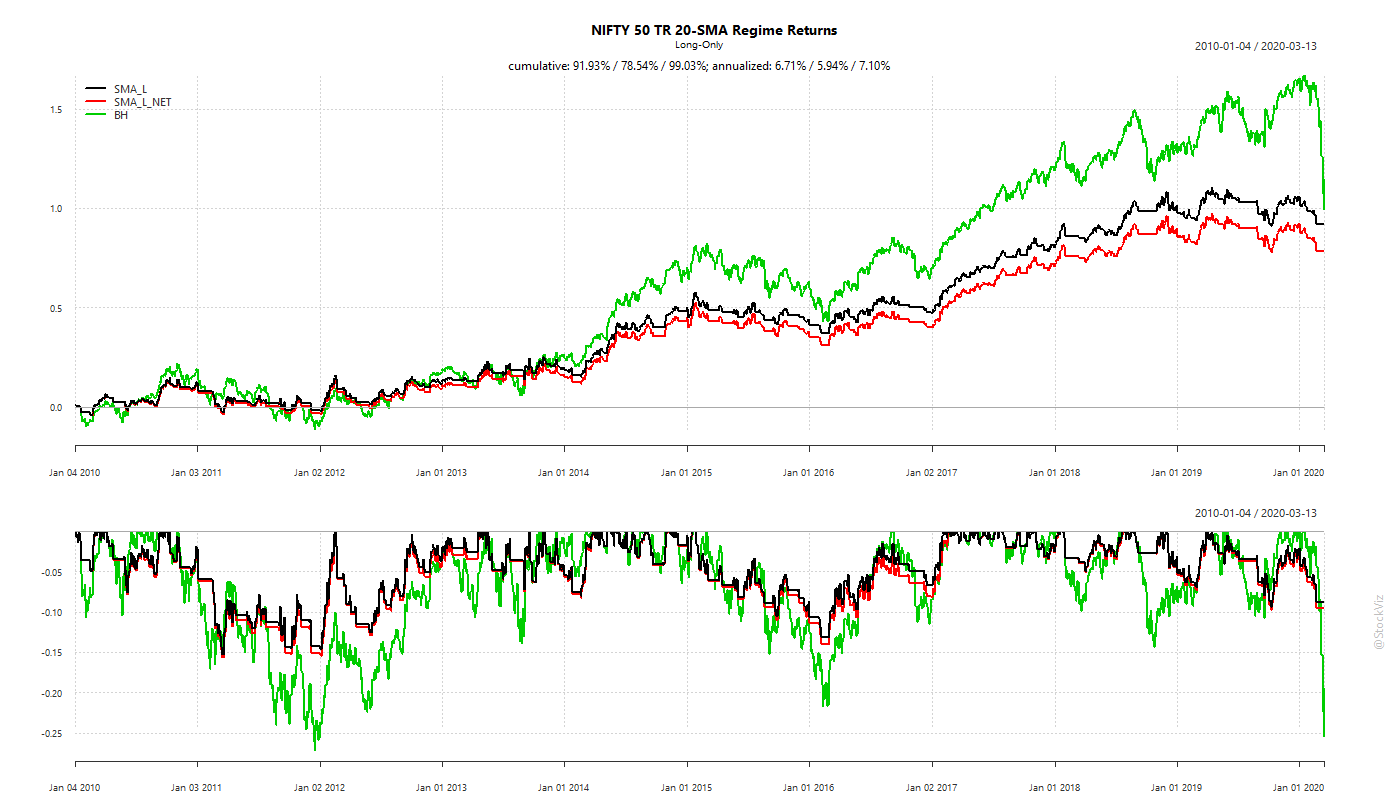
20-days

And what if you increased it to 200 days?
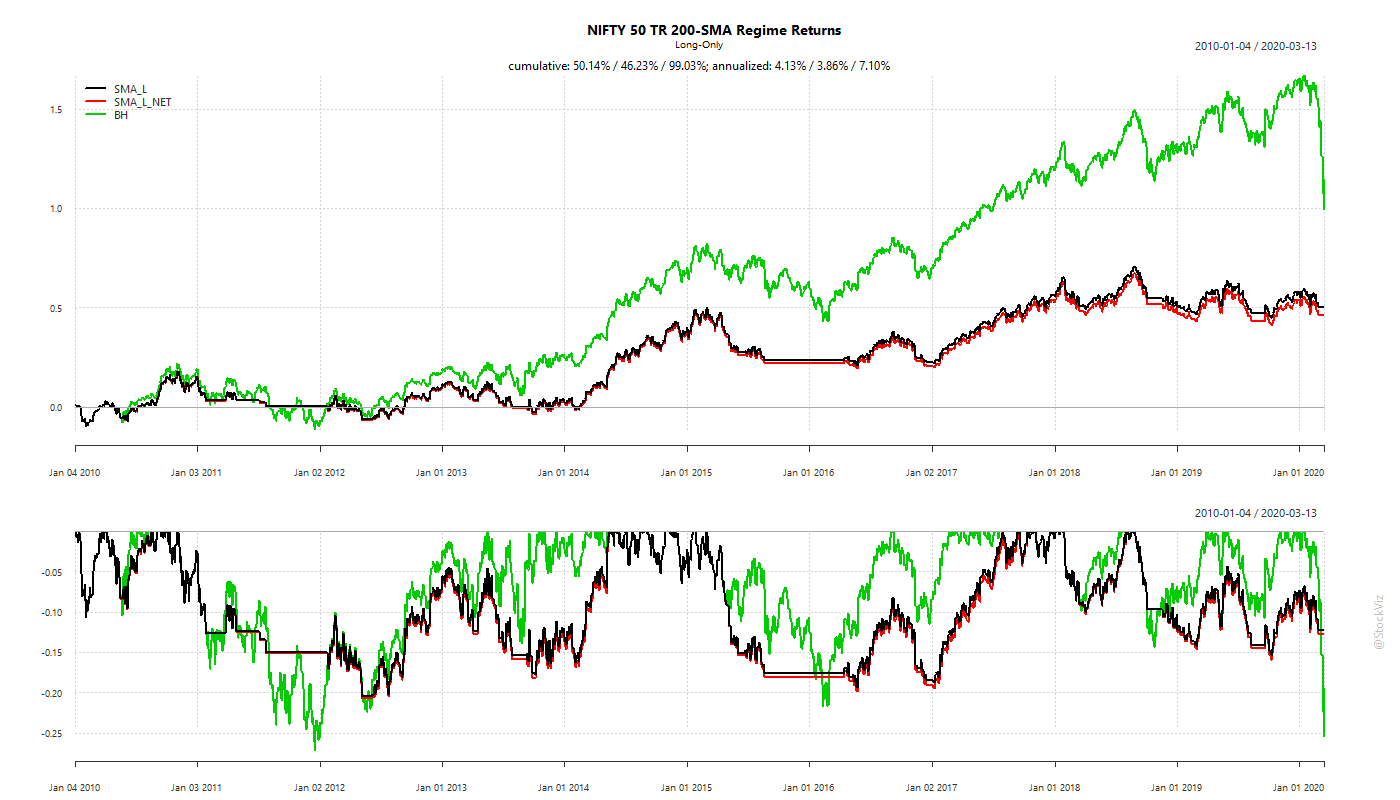
200-days

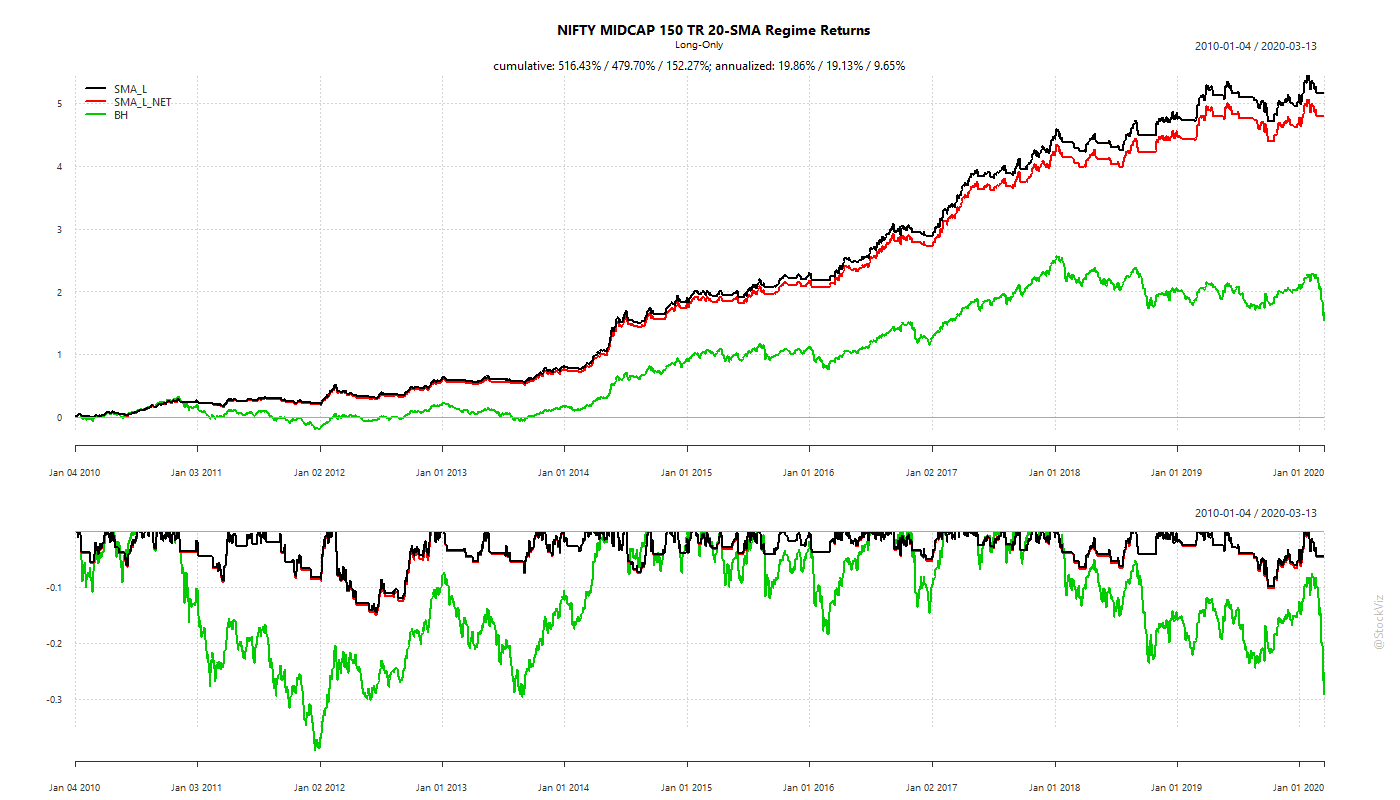
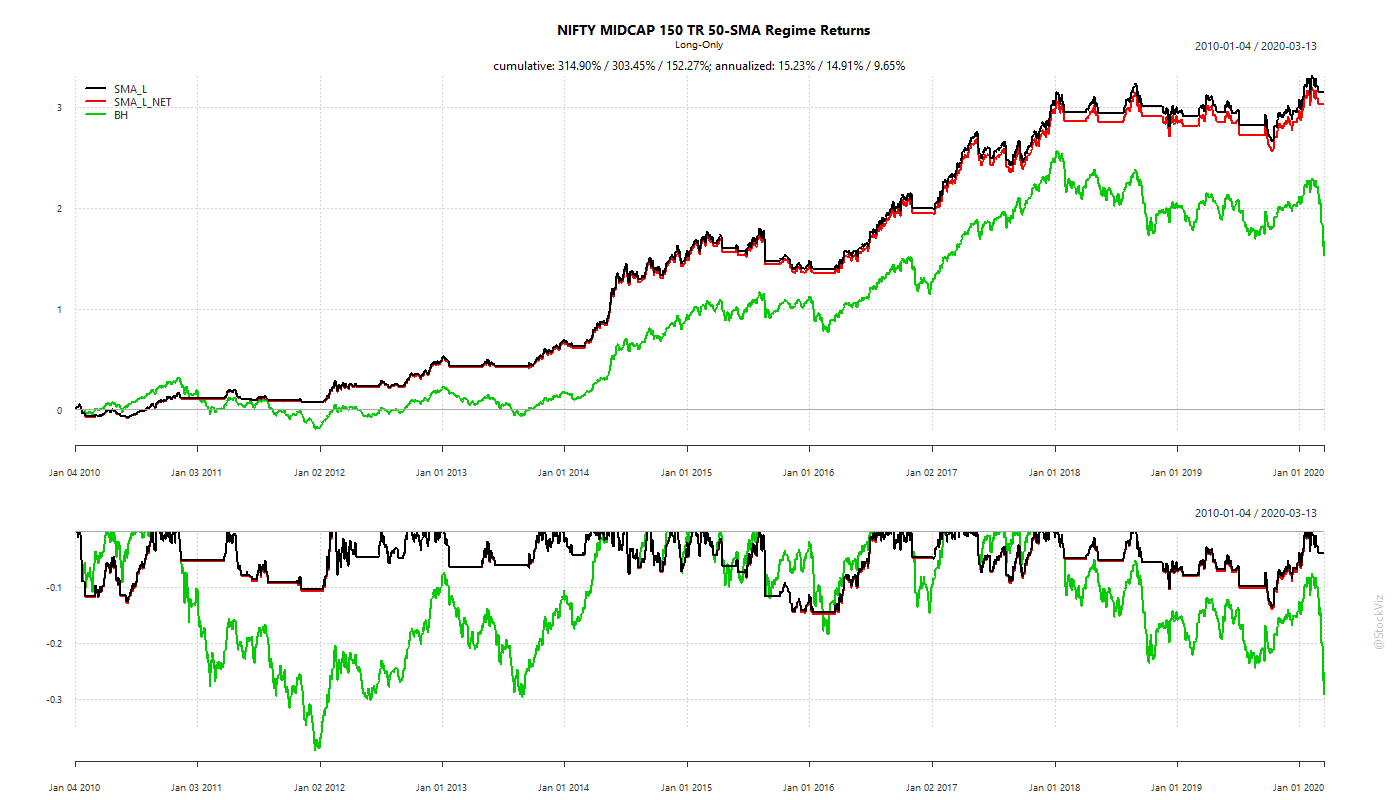
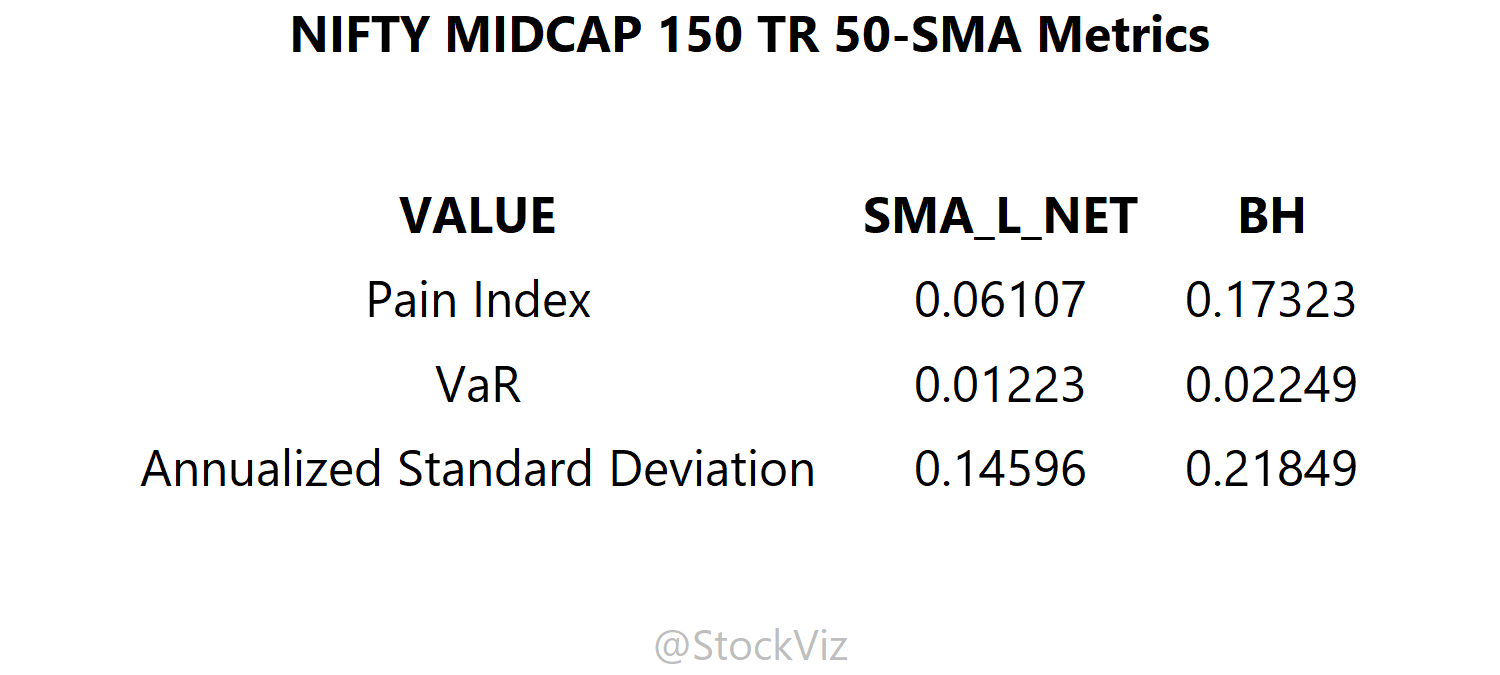
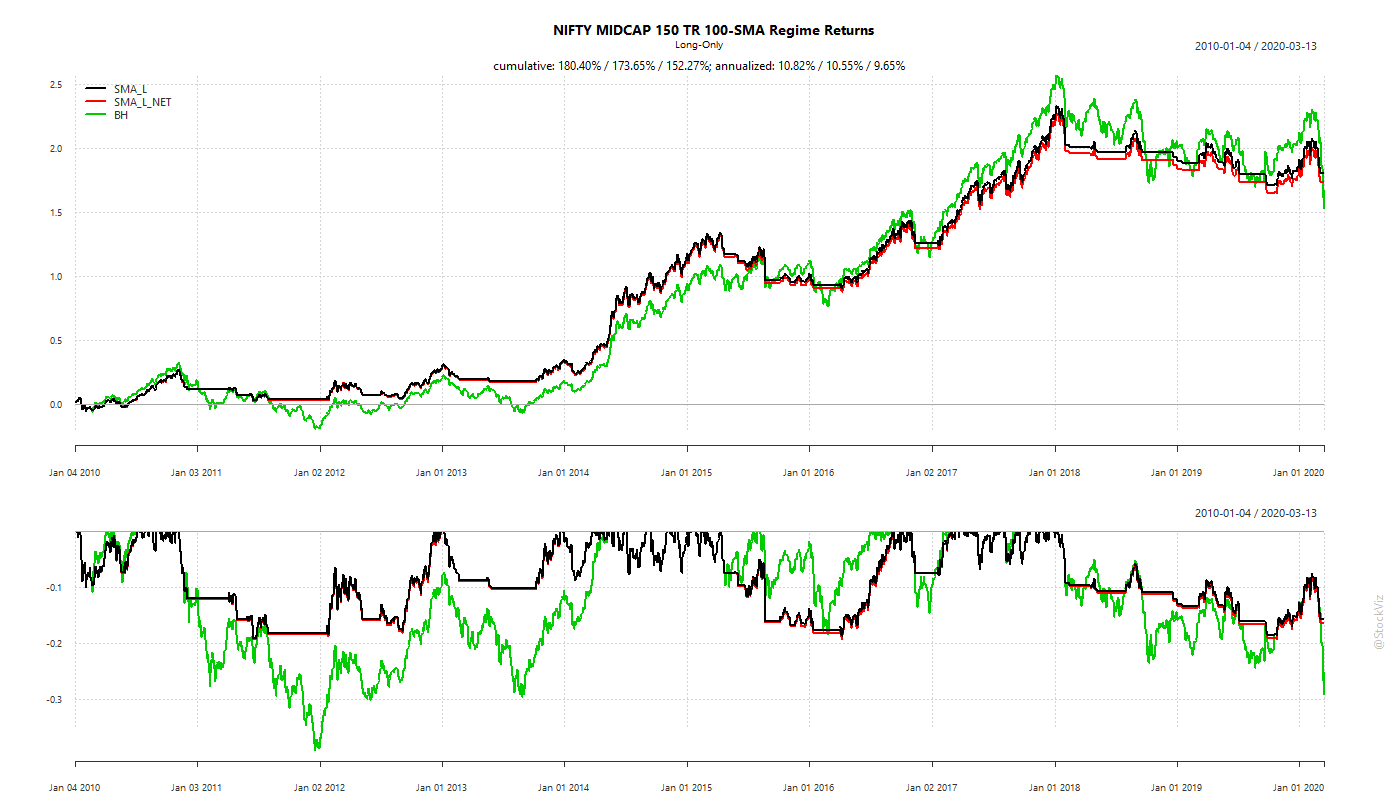
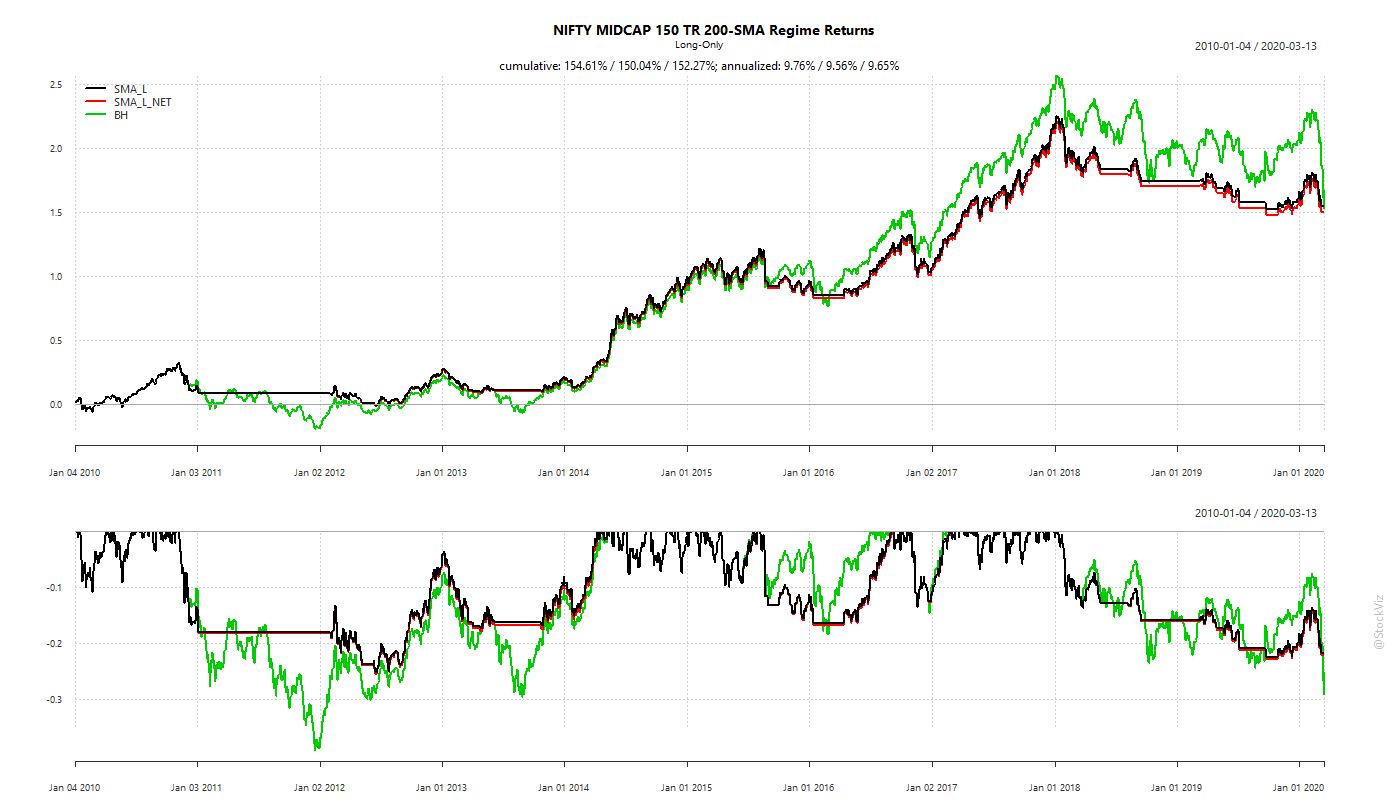
What about Midcaps?

20-days
50-days
100-days
200-days

Who should hedge?

Most of the time, markets recover. However, the recovery time varies each time and there is no way to time hedging strategies. And each under-lying index behaves differently.

So, the reason to do it is investor’s own psychology and the asset one is long. If you, as a buy-and-hold long-term investor, can stomach the volatility, then there is probably no reason to hedge. Besides, portfolio volatility can be reduced through asset allocation as well (here, here.)

And remember: risk-management, whatever the strategy, involves paying upfront to mitigate risk that may or may-not befall.

Code and more charts on github.
Are Stop-Losses Worth It?

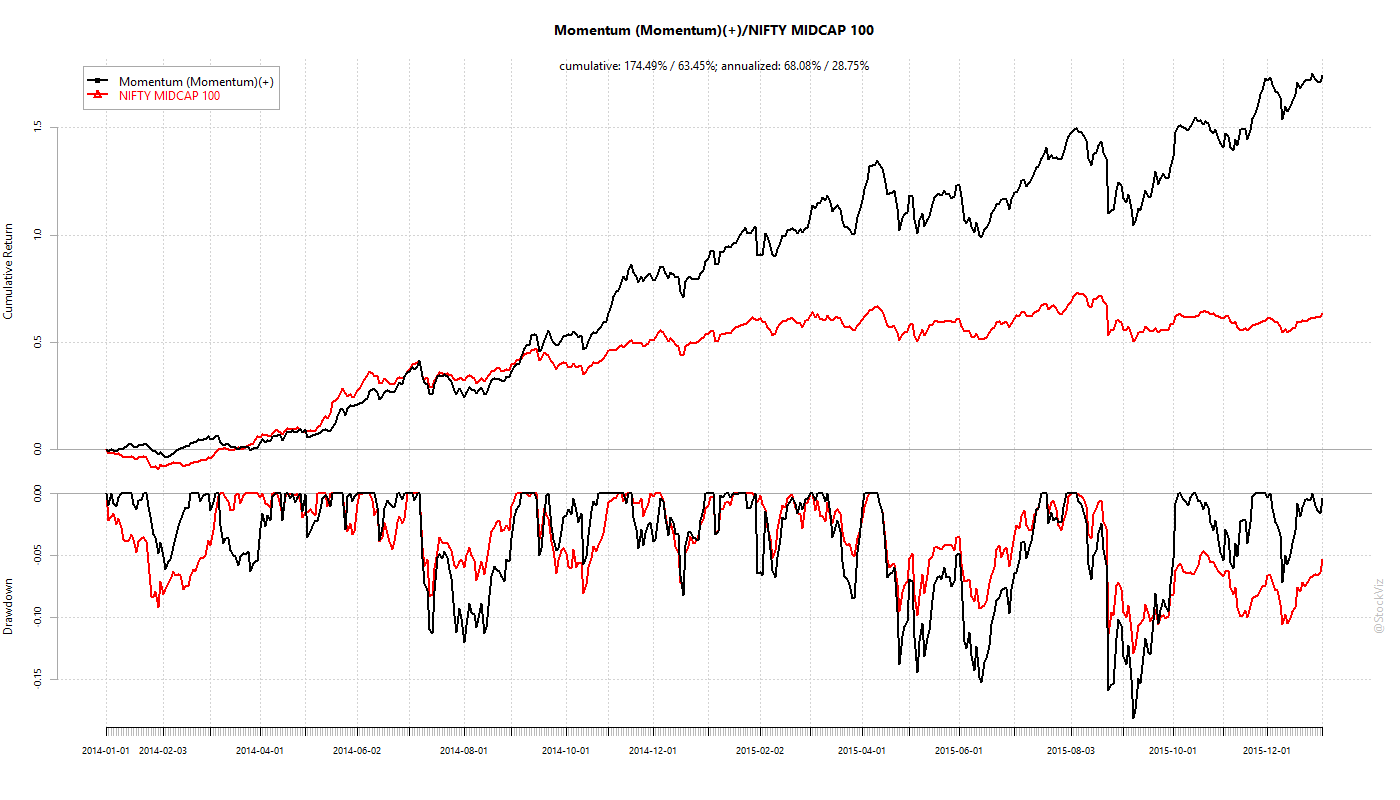
StockViz introduced Themes back in August 2013. We went live with two strategies: Momentum, rebalanced once a month, and Quality to Price, rebalanced once a quarter. The Modi bull market was just getting started and returns were spectacular in the beginning. Here is Momentum, from Jan-2014 through Dec-2015:
Momentum Jan-2014 through Dec-2015

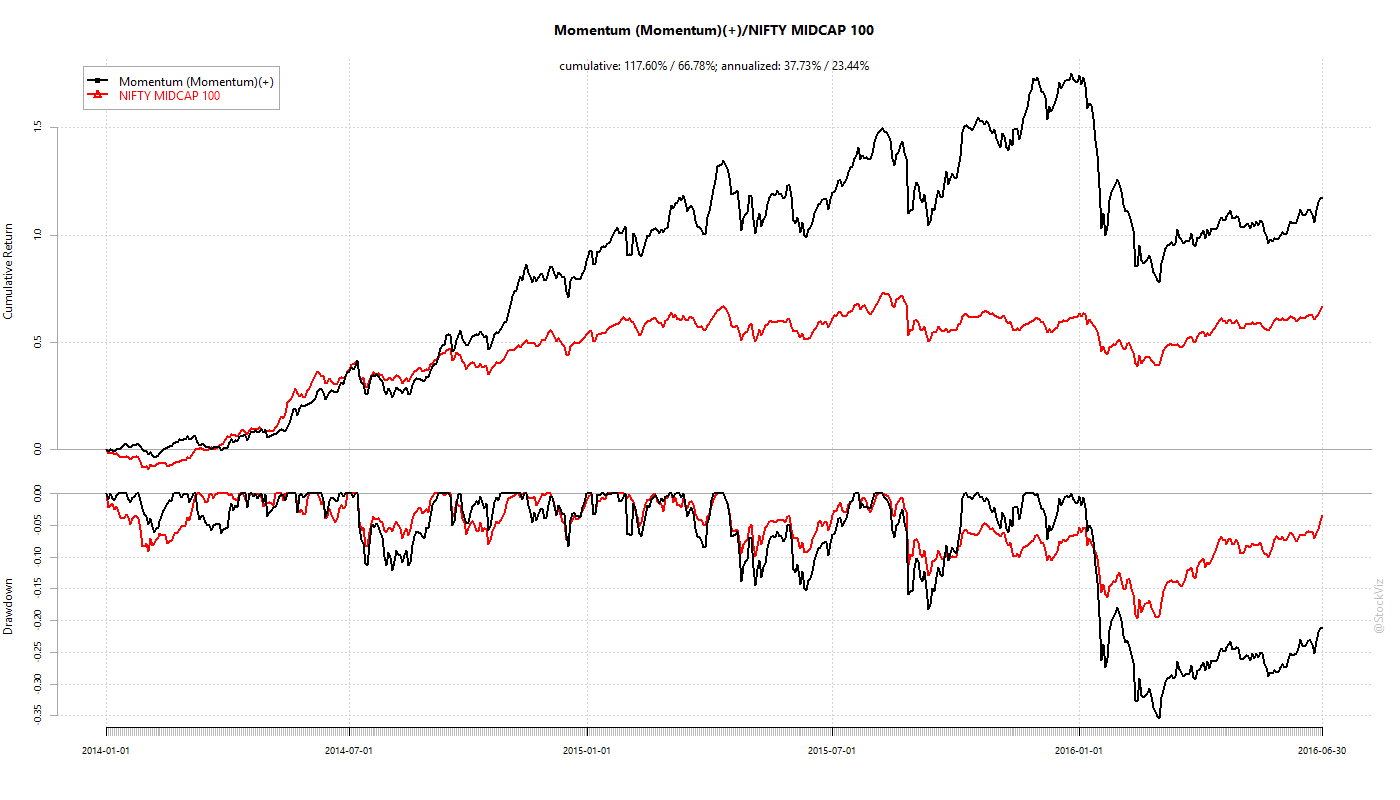
And then, in Jan-2016, the Chinese market crash rippled through world financial markets (WaPo). Momentum collapsed. This is the previous chart extended to June-2016:
Momentum Jan-2014 through June-2016

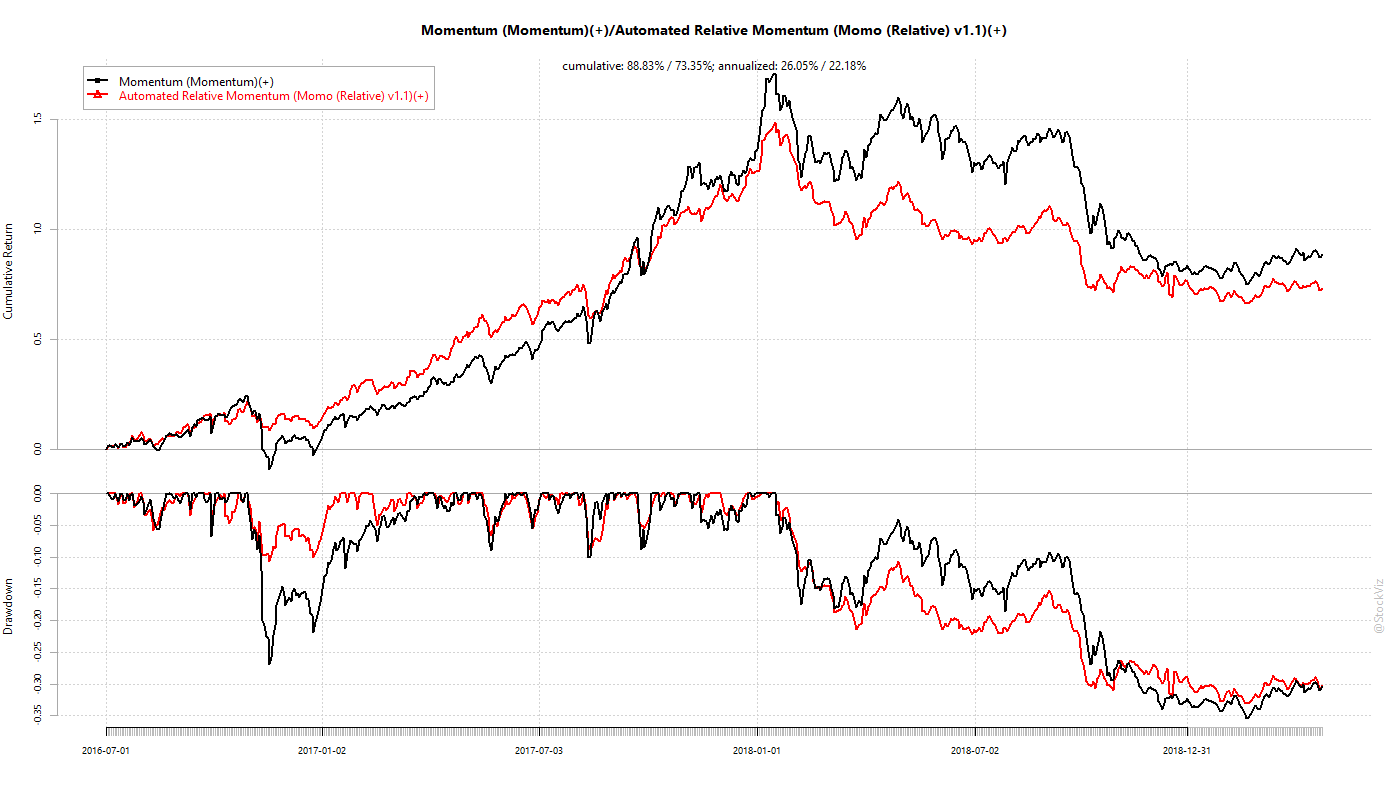
Momentum investors clamored for a safety net. Enter stop-losses. We created a new set of Themes, called Momos, that had a 5% trailing stop loss at the position level. Positions hitting the stop loss were substituted with stocks that had favorable momentum and trend. The logic was that if the entire market crashed, the strategy would be in cash until stocks gained momentum. We introduced these Themes in June and they worked as advertised on the subsequent market correction in November that year. Idea validated? Here is a chart comparing the returns of Momentum (vanilla) vs. Momo (Relative) v1.1:
Momentum (vanilla) vs. Momo

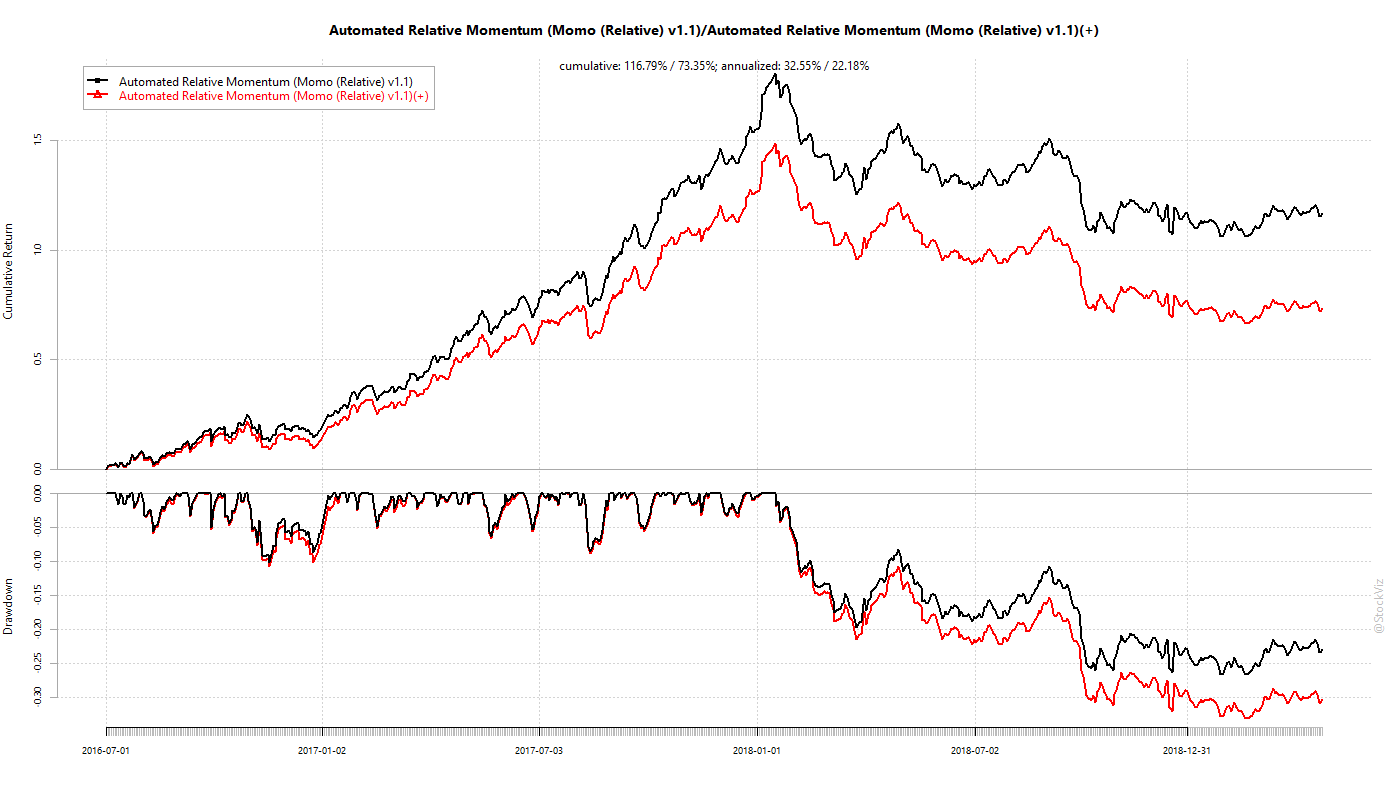
Momo trails its plain-vanilla counterpart over a ~3 year period. There has been plenty of volatility during that time – November 2016, August 2017 and January 2018 through now. And Momo traded a lot more than its plain-vanilla counterpart (the turnover charts are on the Theme pages linked above) through these bouts of volatility. And what was saved through stop-losses was paid for in taxes and transaction costs. Here is a chart that shows the Momo strategy with and without transaction costs:

So, are stop-losses worth it? Probably not. It is very difficult to de-risk a high-risk strategy intrinsically. It is better for investors to focus on asset allocation to bring down overall portfolio volatility to a level that they can bear. Think of it like trying to tame a tiger. You may very well succeed. But a tame tiger is a cat.

How long is long term?

Most new equity investors think “long term” is three years. Some think its five. This leads to expectations that are setup to fail. We wrote about projecting future returns recently where we showed how we expect 20-year returns to be statistically distributed. In the simulations that we ran for that article, we also projected returns for 10- and 30-year horizons. We reproduce the charts below.

10-year S&P 500 return distribution

SP500.GLD 10-year

20-year S&P 500 return distribution

SP500.GLD 20-year

30-year S&P 500 return distribution

SP500.GLD 30-year

As your investment horizon grows larger, the probability of you facing severe losses come down and the overall probability of positive outcomes increase.

Fama and French agree

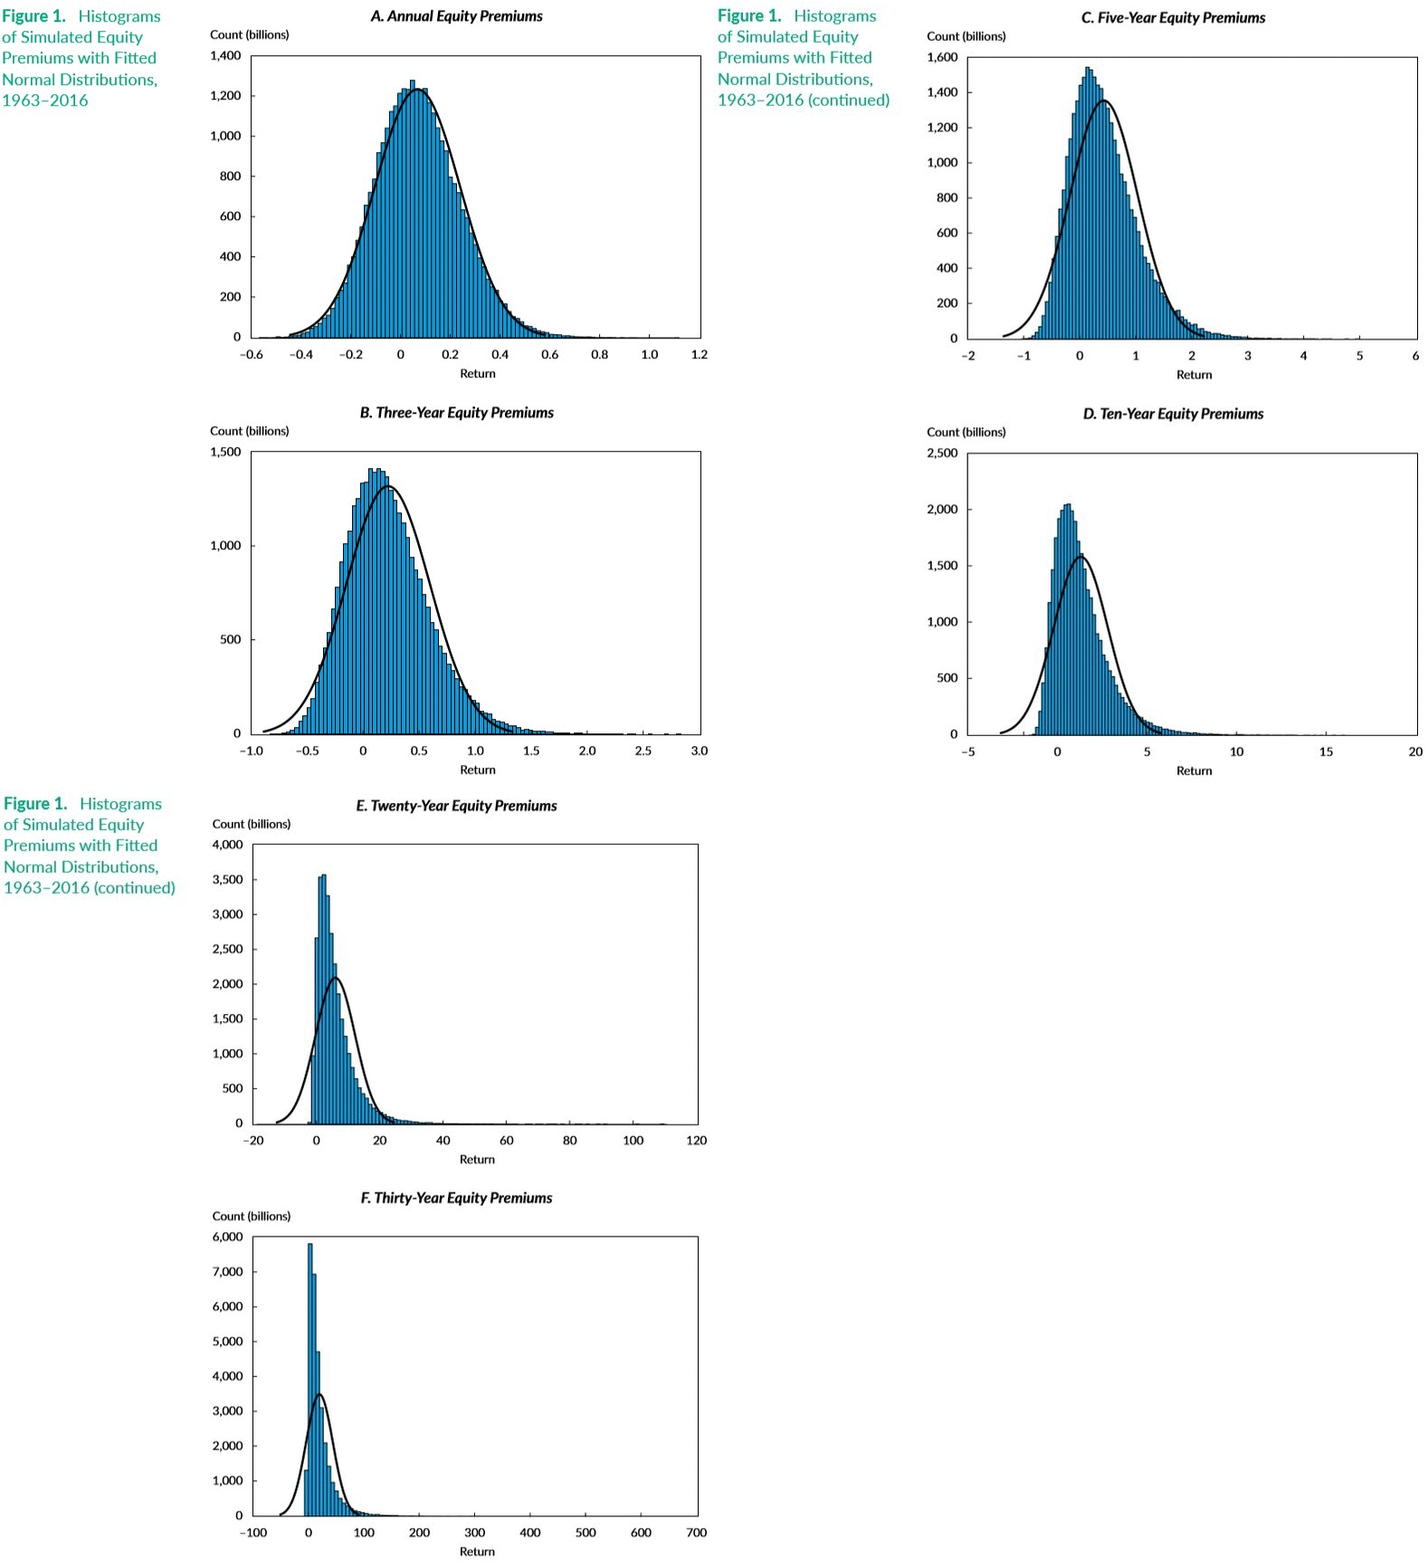
In a recent paper, Volatility Lessons for the Financial Analysts Journal, Eugene F. Fama and Kenneth R. French pretty much arrive at the same result. Here are the charts from their paper:

And they conclude:

The high volatility of monthly stock returns and premiums means that for the three- and five-year periods used by many professional investors to evaluate asset allocations, the probabilities that premiums are negative on a purely chance basis are substantial, and they are nontrivial even for 10- and 20-year periods.

Basically, long-term is ~30 years, anything less that is prone to be influenced by noise (luck.)

Country Equity Index Drawdowns vs. Returns

Previously, we saw how US Midcaps have out-performed Indian midcaps in dollar terms (US vs. Indian Midcaps.) But that is only one part of a bigger question: How do Indian equities stack up with the rest of the world?

Here is a chart of peak drawdown (largest loss) vs. cumulative return for country equity total return NASDAQOMX indices:
NASDAQOMX.dd.vs.returns
India: red square. World: black triangle. Full key: here.

Sure, Indian equities have put up a decent show. However, they have by no means been the best market out there. Investors would have got similar returns but with a vastly lower drawdown if they had just bought a NASDAQ-100 ETF (XNDX on the chart, ETF ticker: QQQ). Moreover, diversifying and asset allocation strategies are cheaper in the US than in India – both in terms of management fees and tax impact.

Related: Funding Your Dollar Dreams.

Source: NASDAQOMX data from Quandl.

SIP: Expected Returns

“A monthly Rs. 5,000/- SIP will make you a crore-pathi!” Screamed a Facebook ad. Really? Is it that simple? Lets break it apart and find out the assumptions baked into that bold assertion.

Historical annualized mid-cap returns

annualized historical midcap 100 returns

The NIFTY MIDCAP 100 index has given an annualized return of ~21% between 2002 and 2016. If you assume a 20% return over the next 20 years, then a monthly SIP of Rs. 5,000 will indeed result in a Rs. 1,21,94,282/- corpus, making you are crore-pathi.

But what happens if you were 100% invested in Midcaps (20% returns!) and retired in 2007? All your crore-pathi dreams would have gone poof (Midcaps crashed 60% in 2008.)

Static Asset allocation

One way to mitigate blow-up risk is to diversify away from equities into bonds. A popular allocation scheme is the 60/40 equity/bond allocation. So how much should you expect a 20 year, Rs. 5,000/- monthly SIP to return under this scheme?

SIP returns

It is a range of returns because it looks at a 10,000 random samples of 20×12 monthly (historical) returns to reflect the path-dependency of SIPs.

Now, what about the size of the final corpus under this scheme?

SIP returns

On average, you should not expect more then Rs. 60 lakhs as the final corpus under a static 60/40 allocation scheme. You could get unlucky and end up with Rs. 30 lakhs or get very lucky and end up with Rs. 1 crore. But this is the expected range of returns.

If you still want to get to the magic one-crore mark, you will have to “step-up” the SIP contributions.

The final corpus if the SIP is Rs. 5k a month for the first 5 years and 10k, 15k and 20k for the next 5 year blocks, under a static 60/40 allocation:
SIP returns

Glide-path Asset allocation

The 60/40 split would still leave you exposed to market downturns towards the end. One way to eliminate most equity market risks is to adopt an asset allocation scheme that starts with 100% equity, 0% bonds and “glides” to 5% equity and 95% bonds over a period of 20 years. This way, you will have progressively less exposure to equity as you near the end. Under a fixed Rs. 5,000/- a month SIP, your final corpus is likely to be:

SIP returns

And what if you stepped it up?
SIP returns

Take-away

The kind of “straight-line” thinking that the ad propagates will set you up for disappointment if you don’t understand the underlying assumptions that went into it. Prudent asset allocation is much more than raw performance. It is making sure that you will have the money when you need it. And it inevitably compresses returns, so it requires you to save more.

Next time you see such an ad, you can respond by saying “Give me one crore now and I will give you 5k every month for the next 20 yrs.”


Notes:
Rebalanced once a year.
Allows the allocation to drift by 5% before triggering a rebalance.
Assumes a 10% tax on returns at every rebalance.
“0_5” is the total return index of the 0-5 year government bond.

Code and additional charts (with returns using the NIFTY 50 index) are on github.