Now that we are in the middle of a massive virus induced selloff, investors are once again interested in risk management. Similar to how flood insurance is mostly bought after a flood, investors end up paying a hefty premium for fighting the last war. Our experience with offering strategies that try to manage downside risk has been that investors flock to it after a drawdown, only to get disappointed by its returns once the market recovers and getting rid of it right before the next one. Rinse, Repeat.
Risk management is not free
No matter how you hedge your risk (buying options, sell futures, trend-following,) it costs money. There is no system where risk management makes the investor money. So, by definition, hedged investment returns will trail buy-and-hold for long periods of time.
Drawdowns and Returns are sides of the same coin
Equity risk premium exists because of tail-risk that cannot be modeled.
No matter what your time-horizon, there are always periods when you will be deeply in a hole.
Hedging instruments are not perpetual
Equities are perpetual but hedging instruments like futures and options have definite terms. They have their own peculiarities based on risk that is already being priced in vs. true tails.
Simple Moving Averages can help
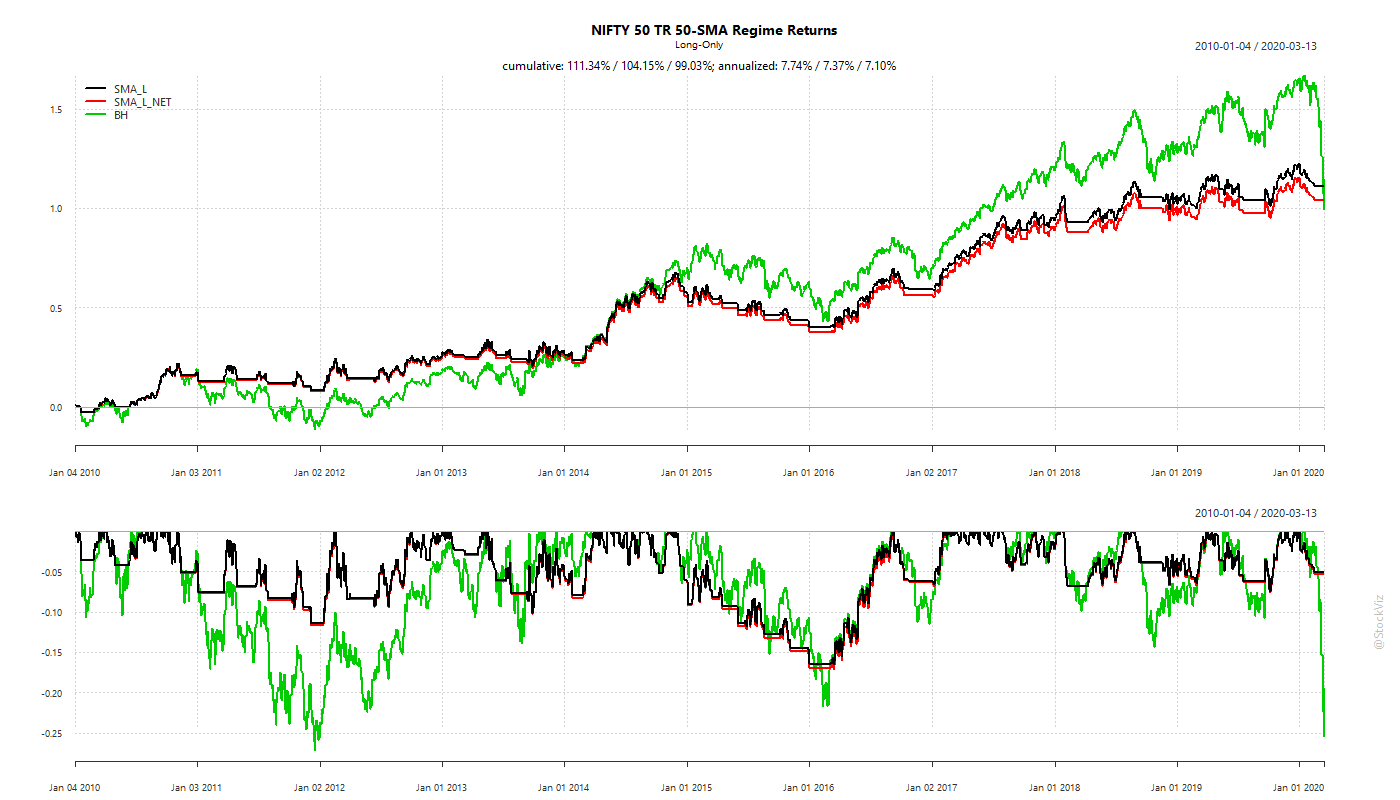
Being long an index only when it above an SMA is one way to overcome the problems highlighted above. It doesn’t involve hedging instruments, so you don’t have to worry about derivative pricing, expiry, etc. The odds are in your favor in terms of the trend being your friend.
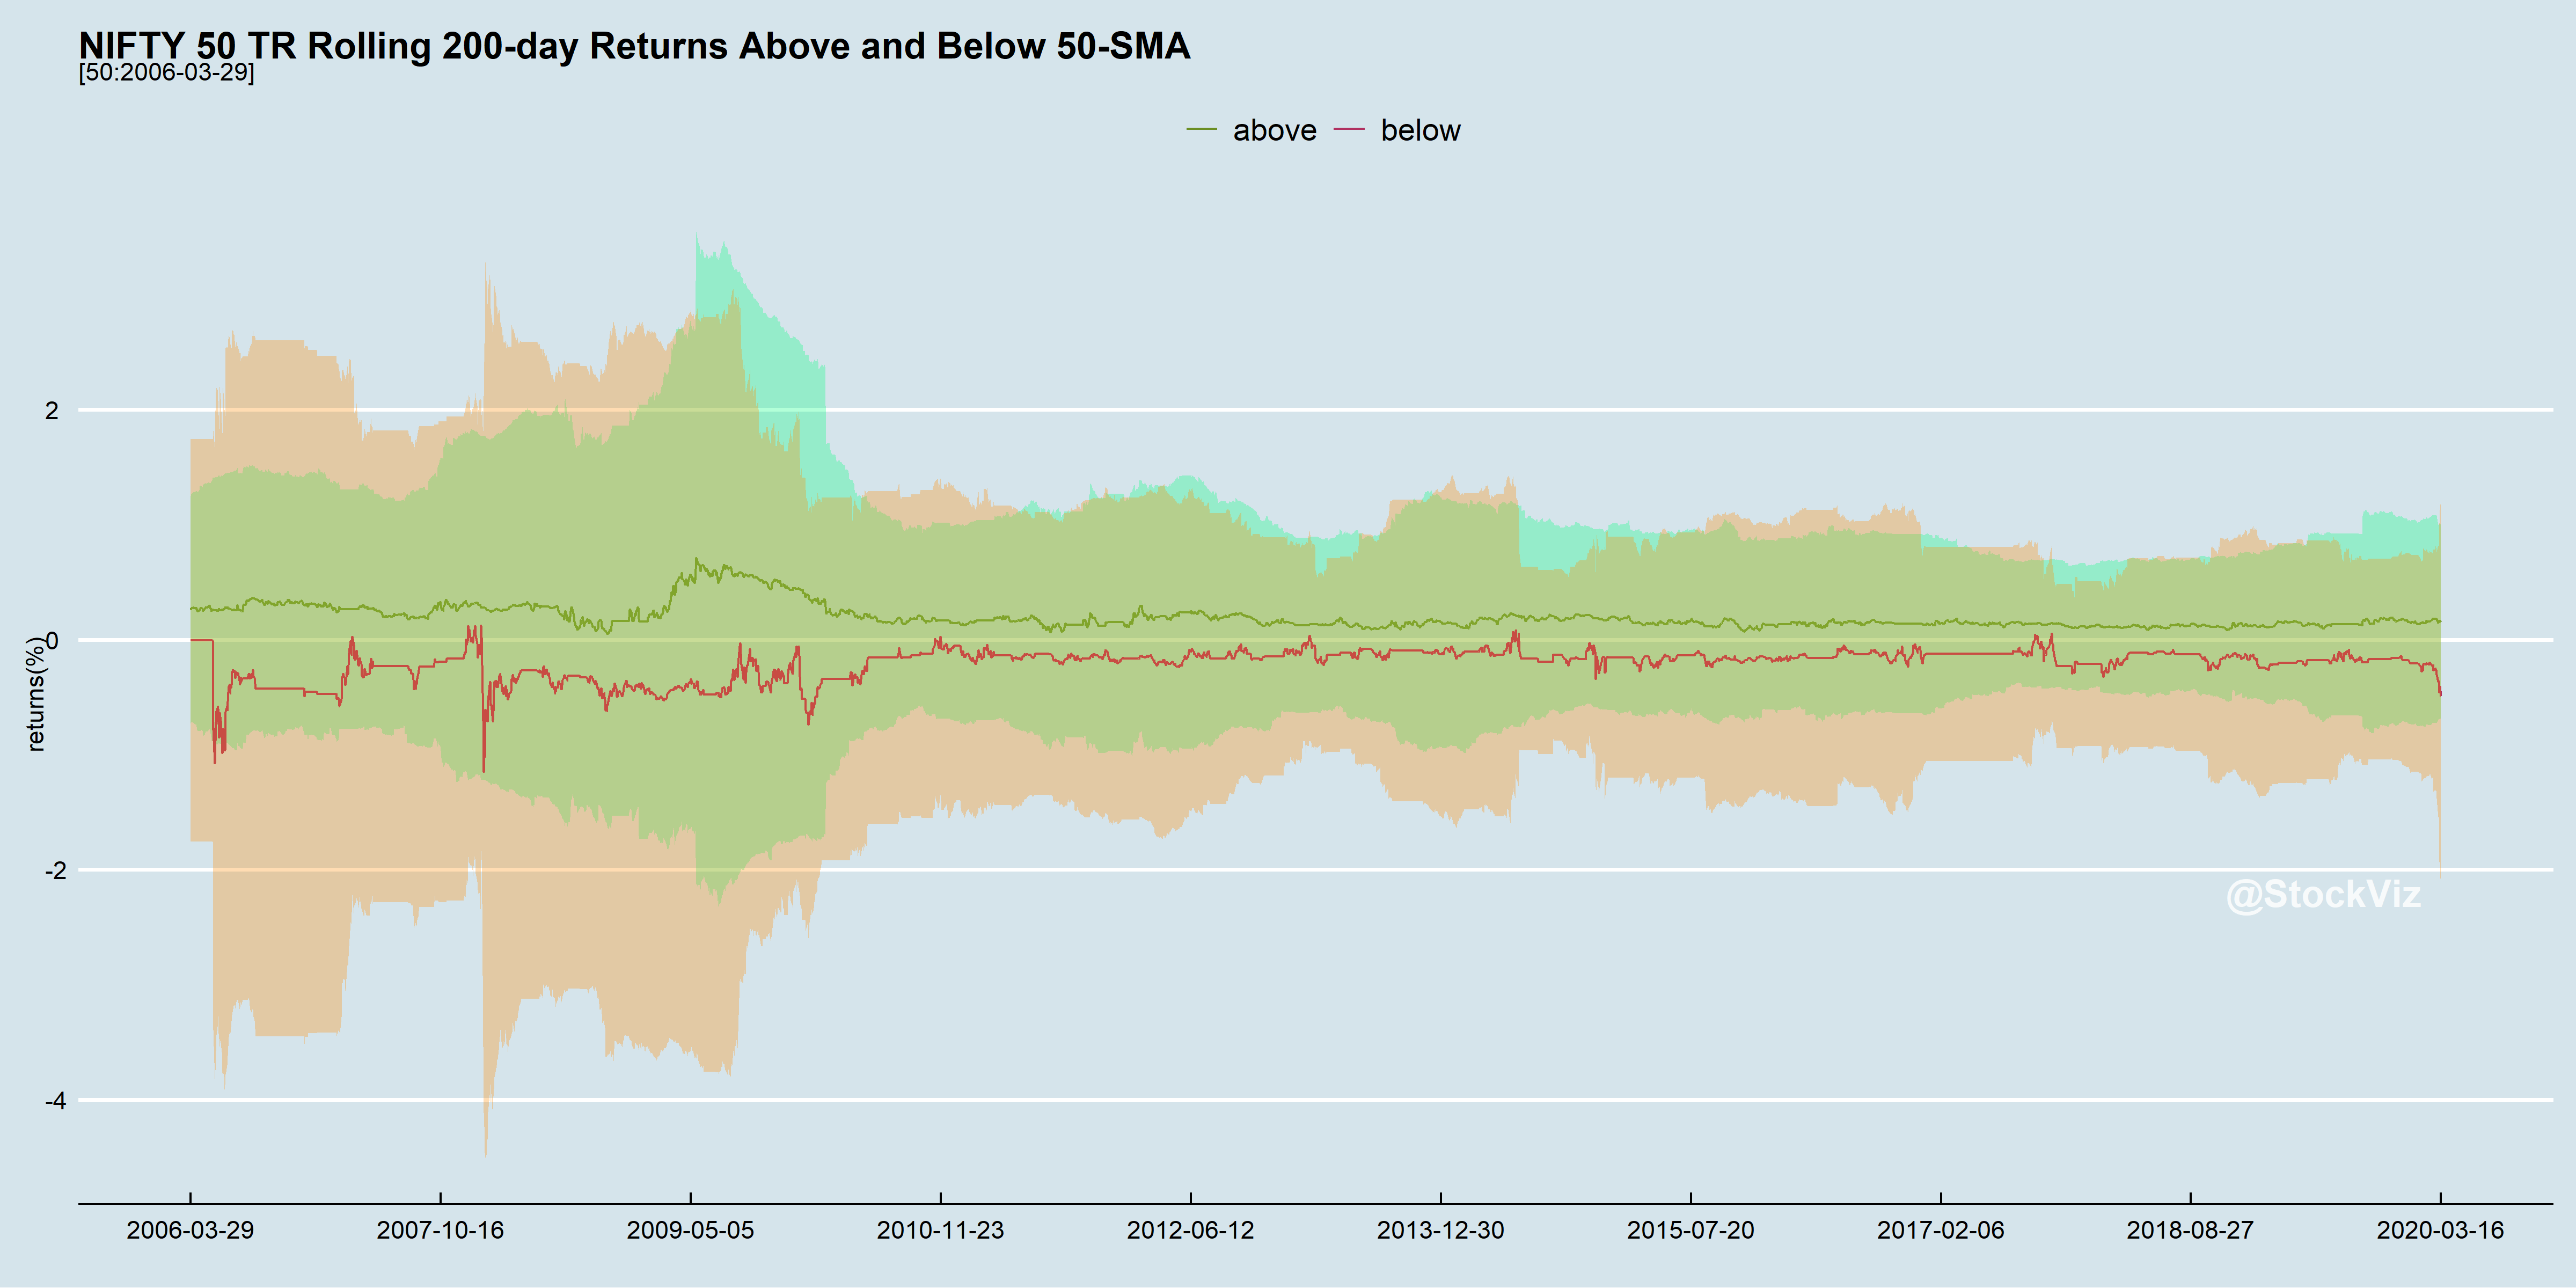
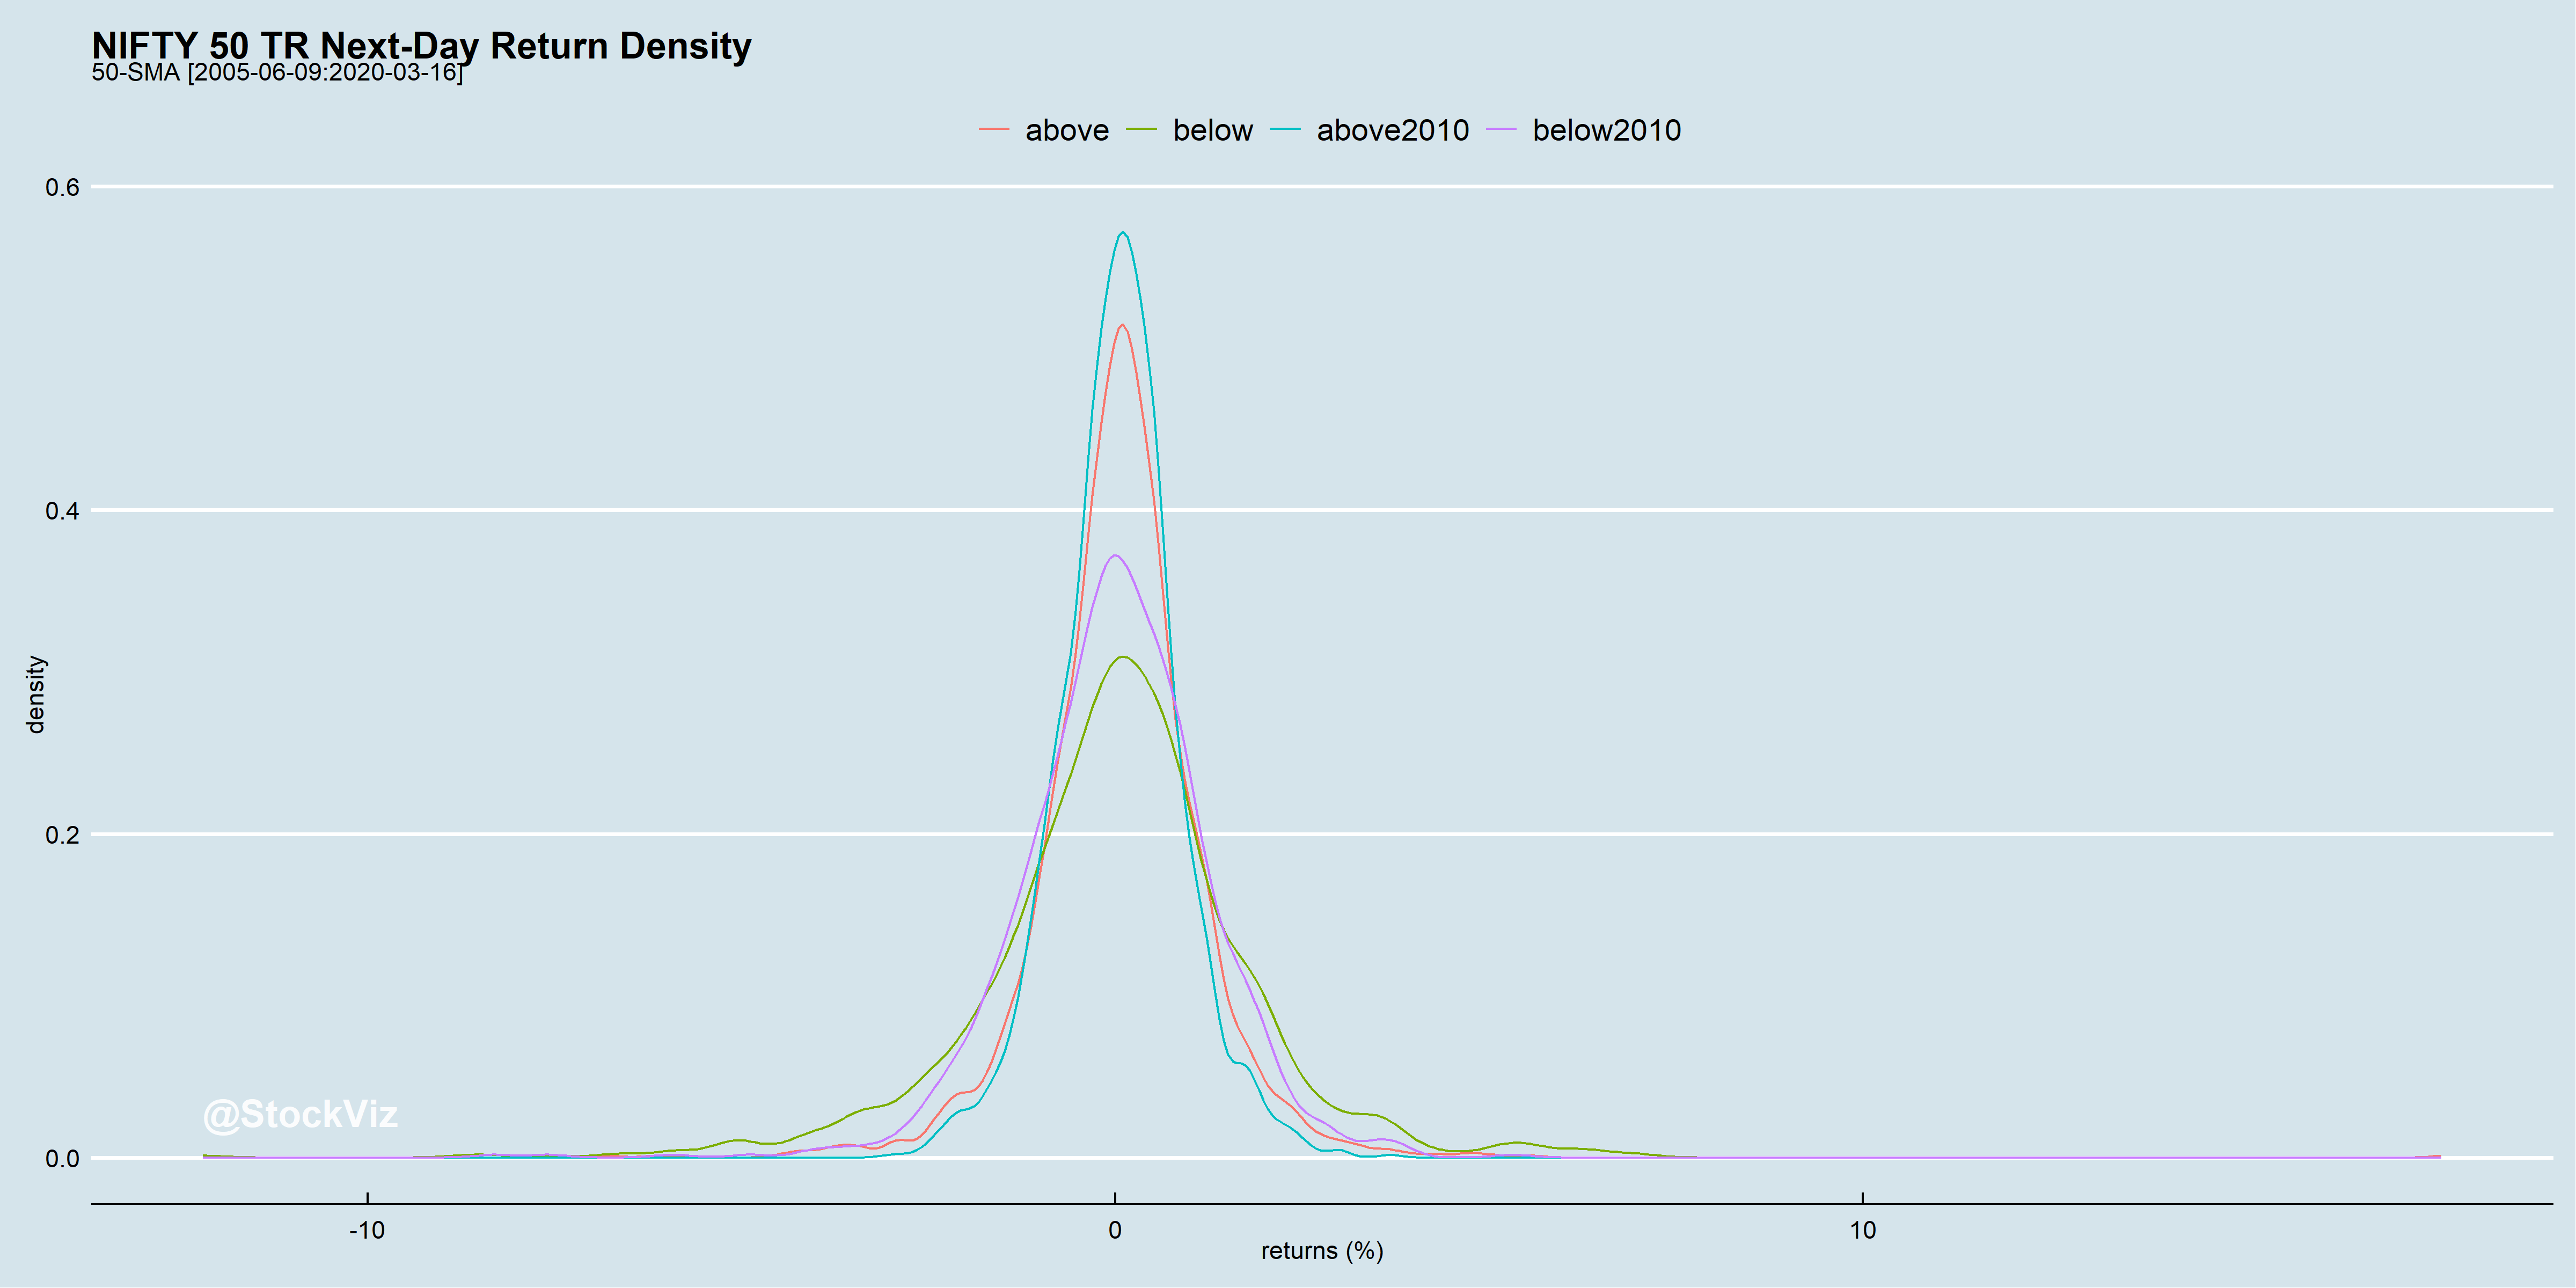
Most of the large daily moves occur when the index is below the SMA. Higher volatility is not necessarily bad if the drift is higher. But most investors rather sit out the volatility than dive in get their guts punched.
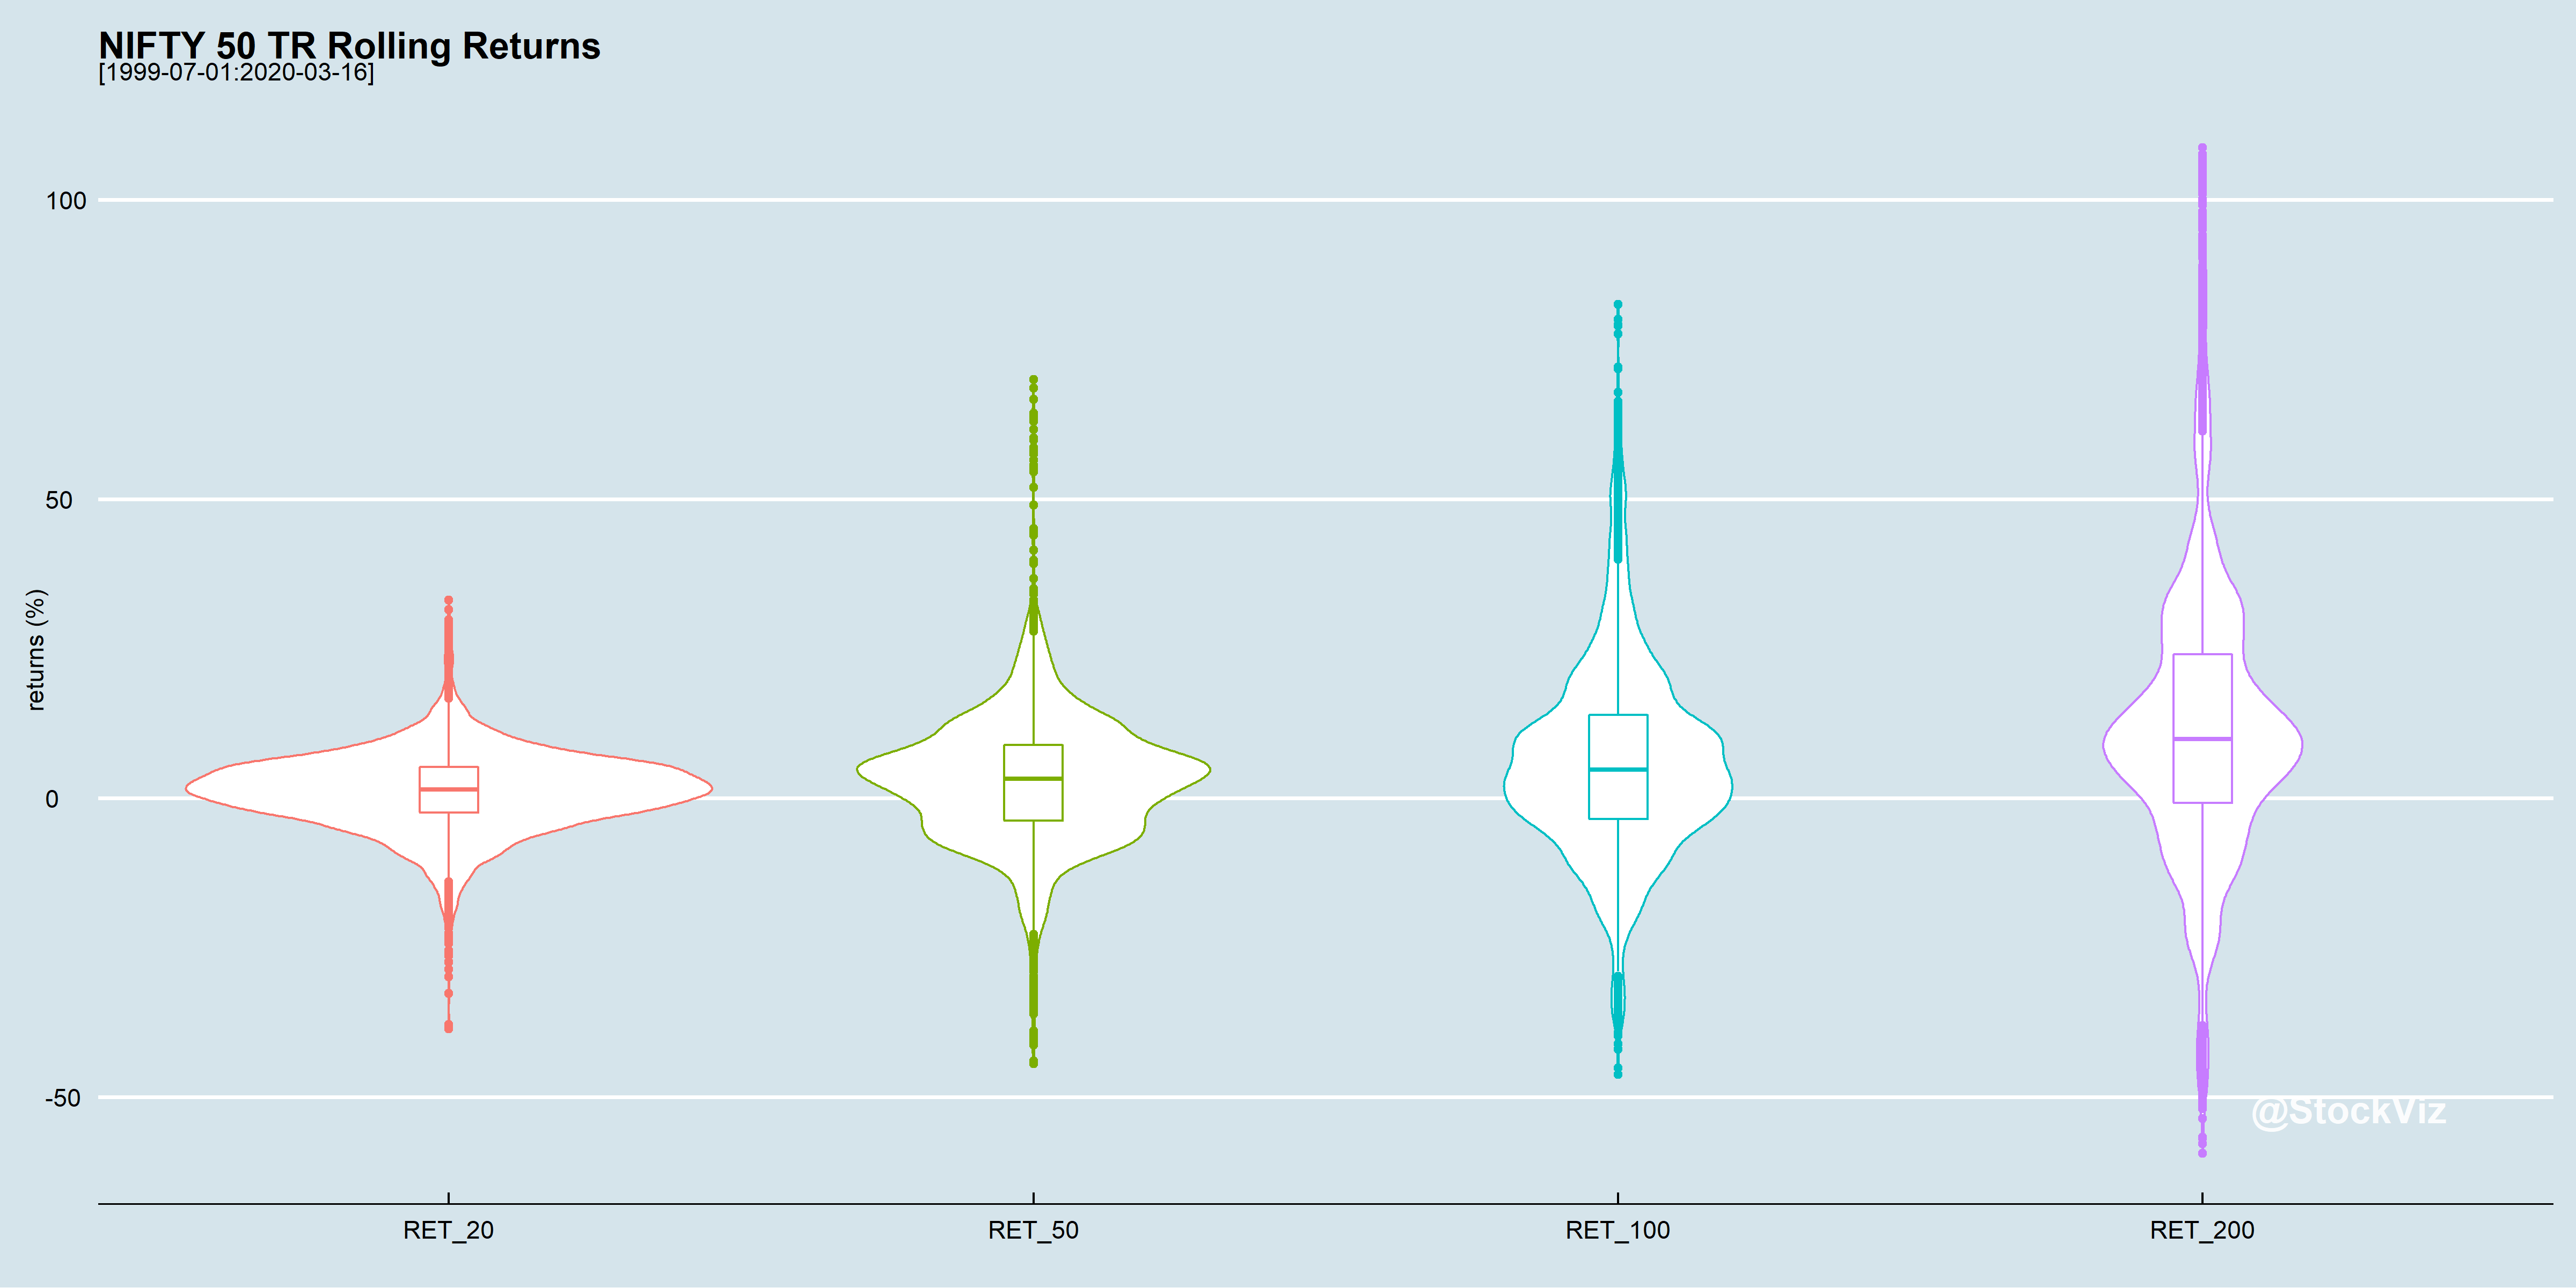
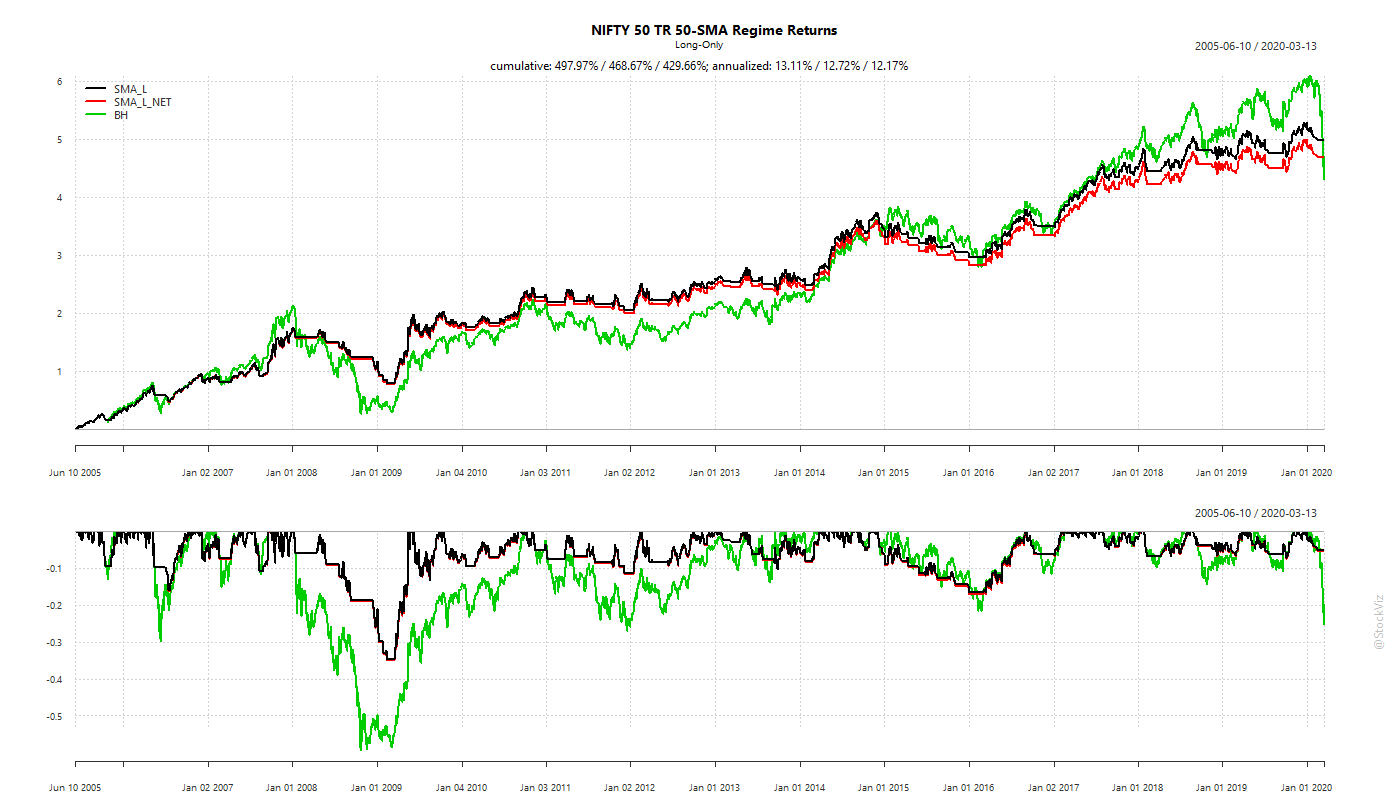
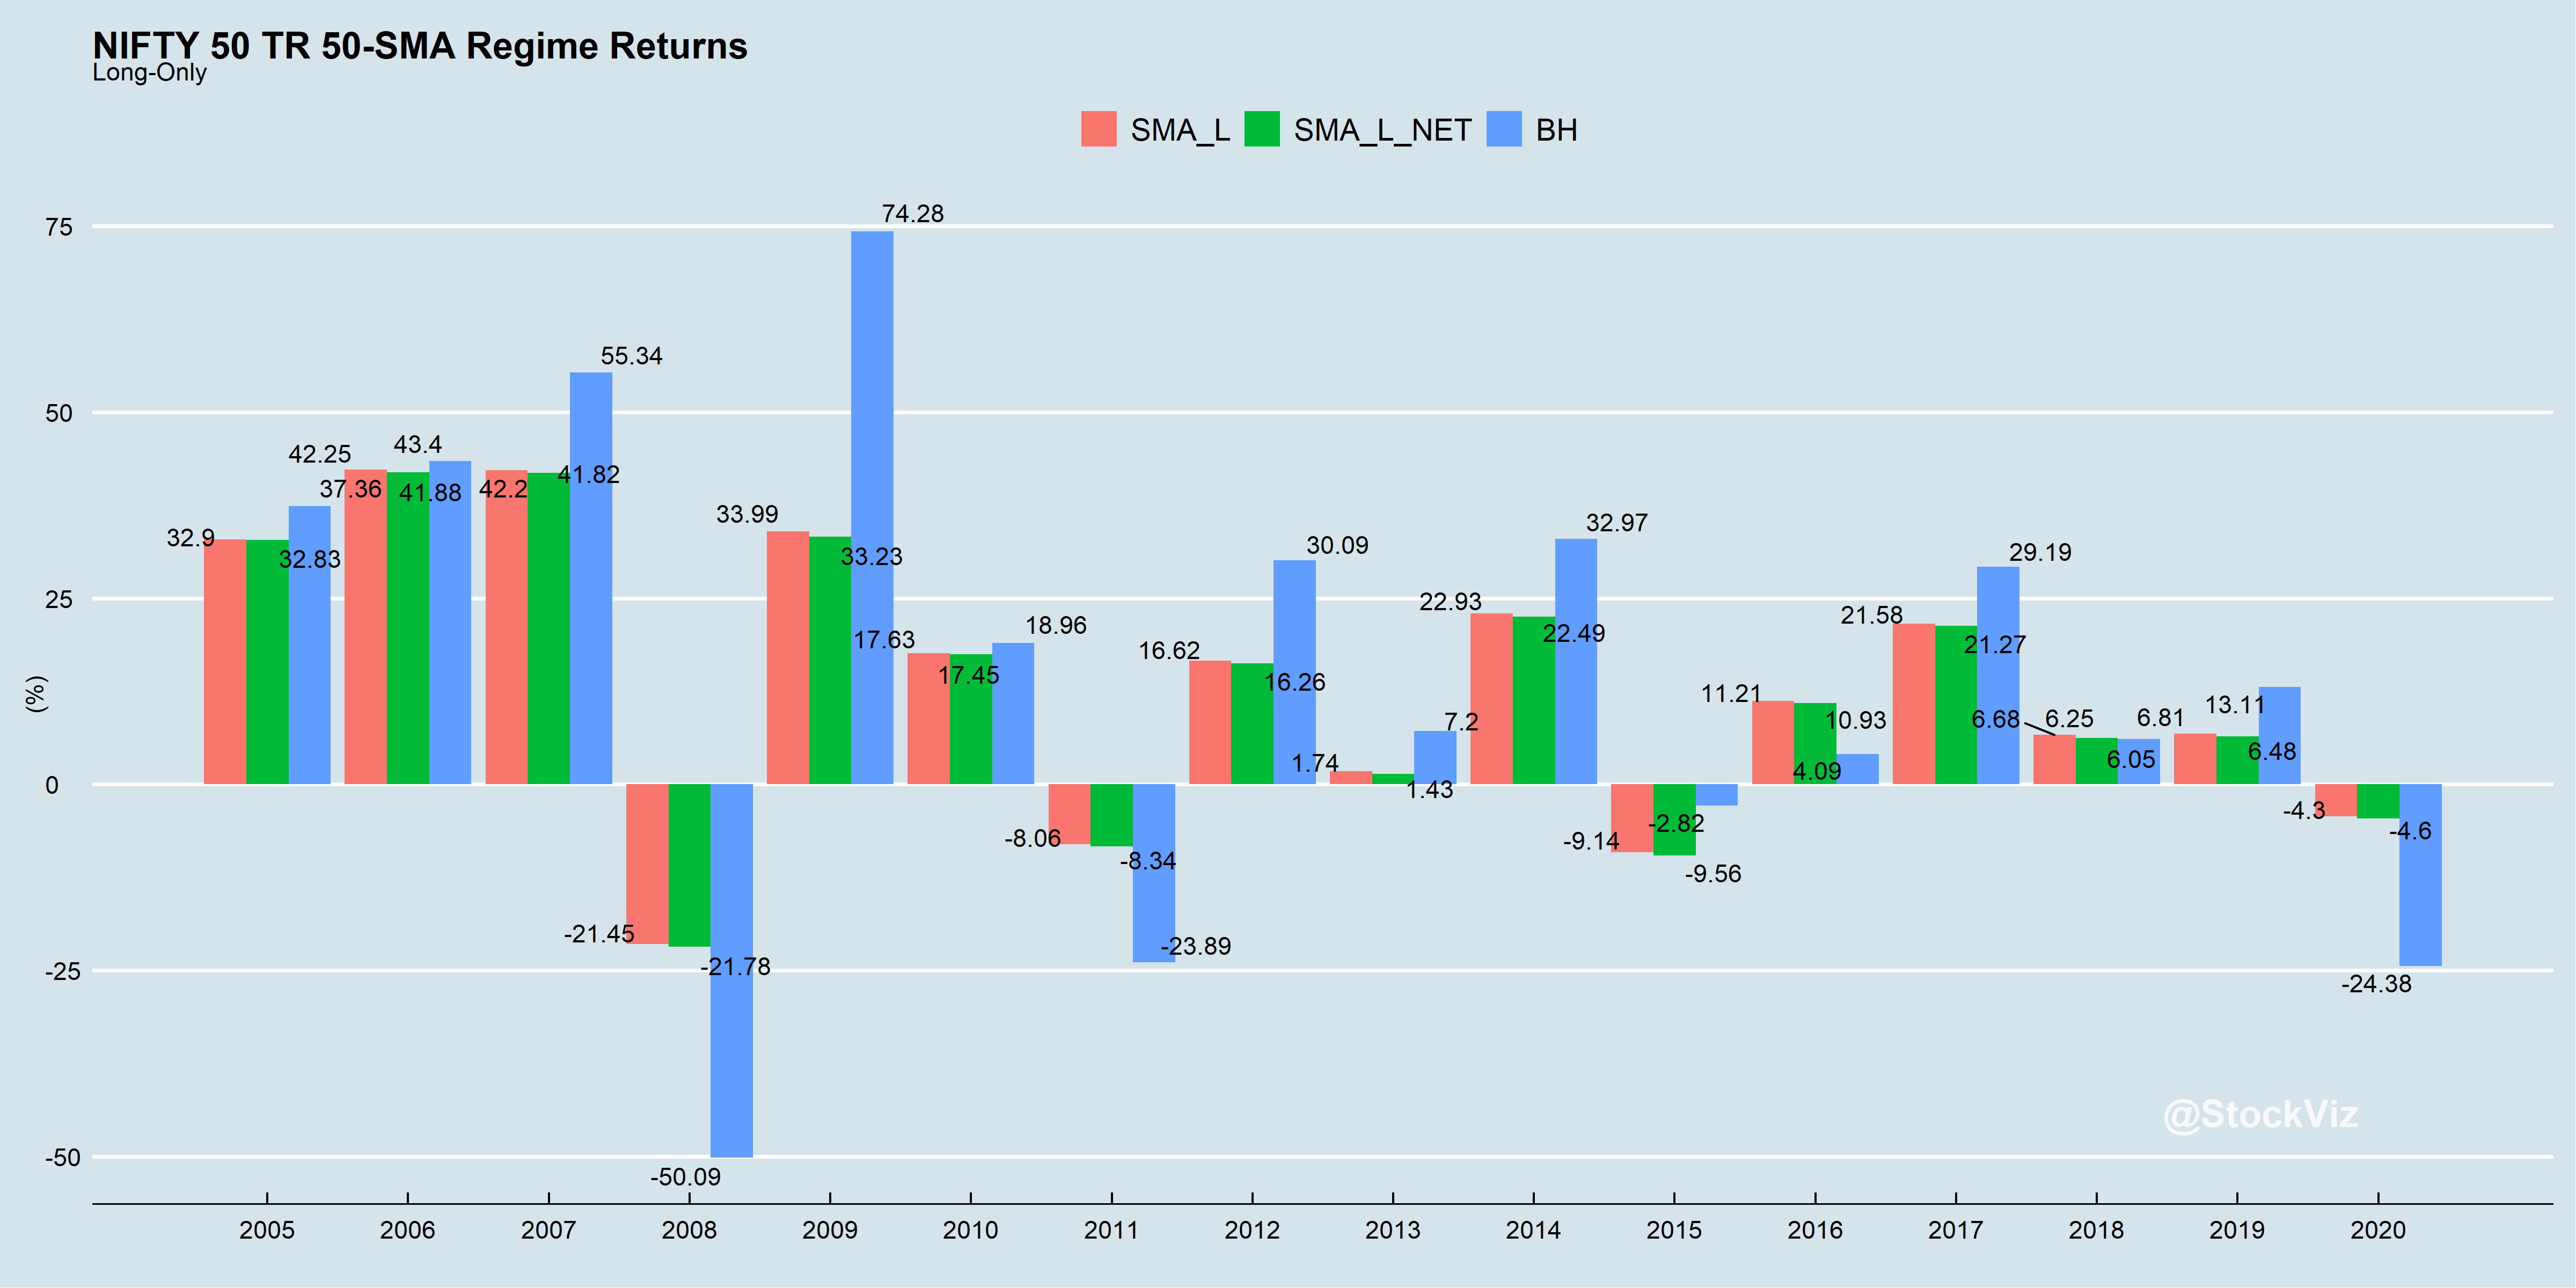
What would returns look like if you were long only when the index traded above its SMA? It really depends on your time horizon.
Problems
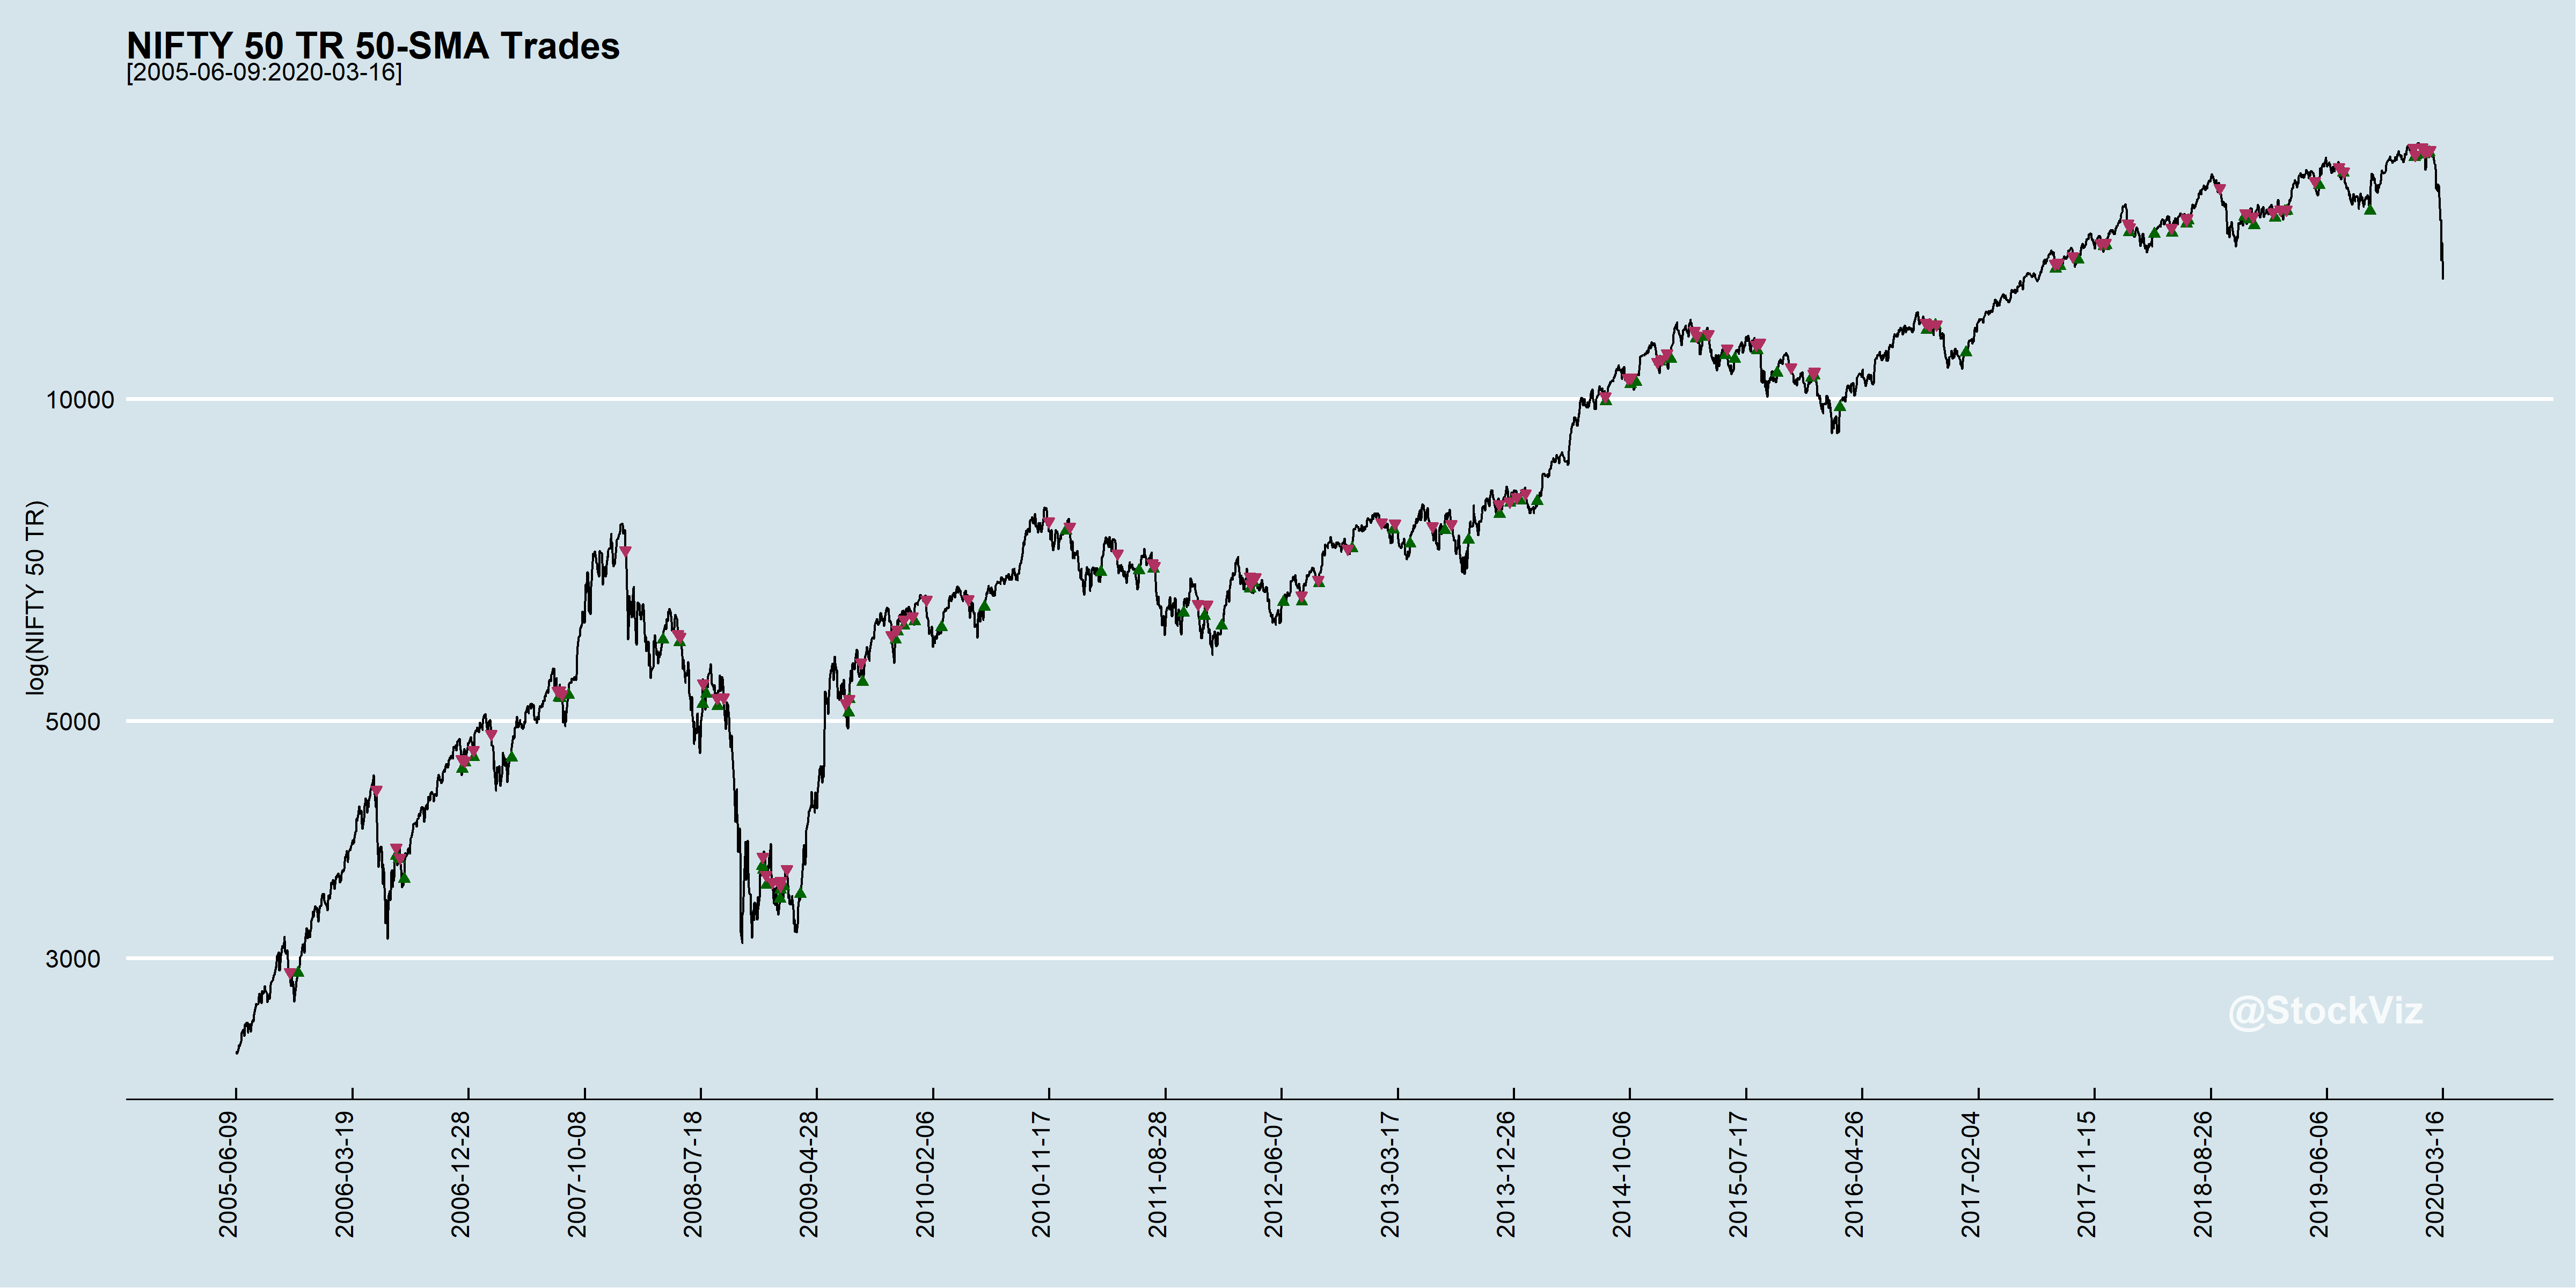
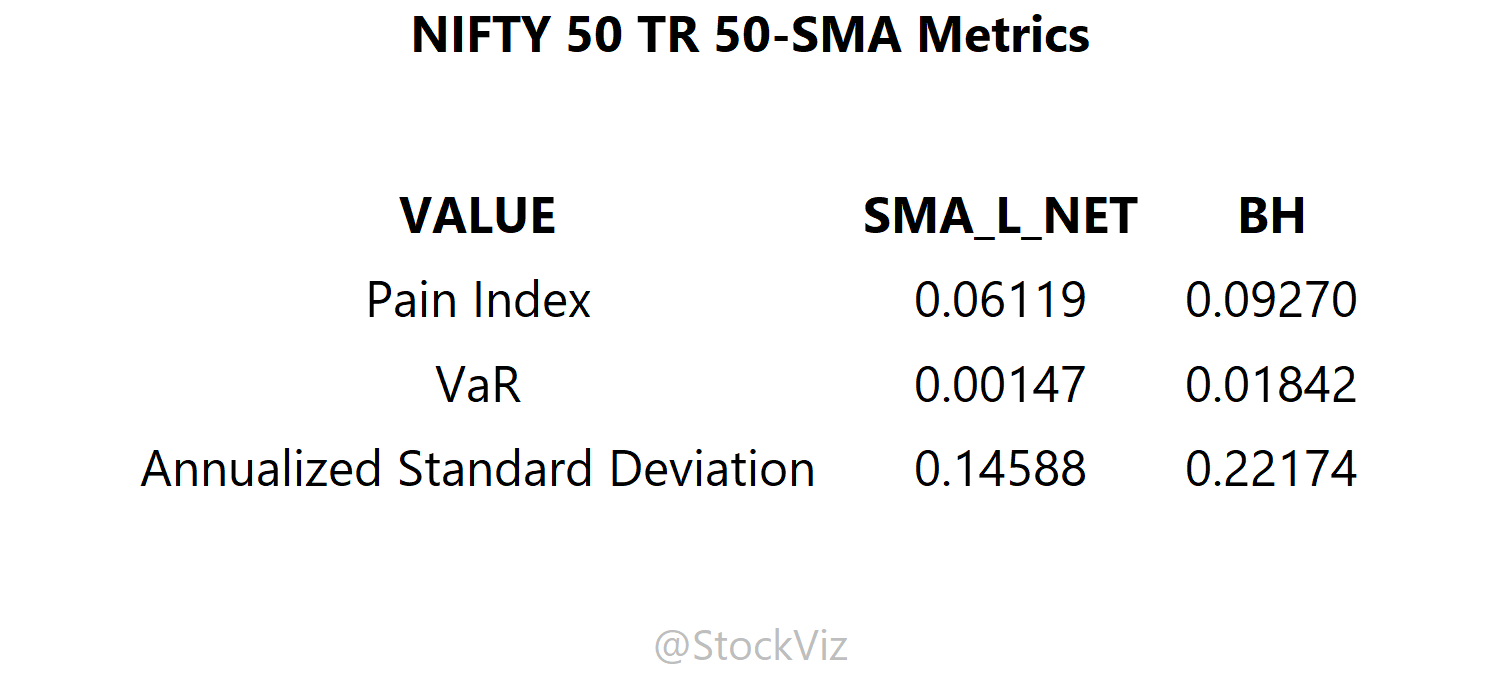
- When it comes to avoiding drawdowns, you win some, you lose some.
- Transaction costs matter. The above was modeled using an STT of 0.001% and slippage of 0.05% on the sell side. And capital gains taxes have been ignored.
- Trading this using ETFs would be sub-optimal. So it is not clear how this strategy can be expressed.
- Outcomes would depend on holding periods. Investors can go a long time under-performing the index and experiencing every bump that comes along.
- Shorter the SMA period (50-day shown above is not written in stone,) more the transaction costs and slippage.
Different look-back periods
What if you shortened the SMA period to 20 days?
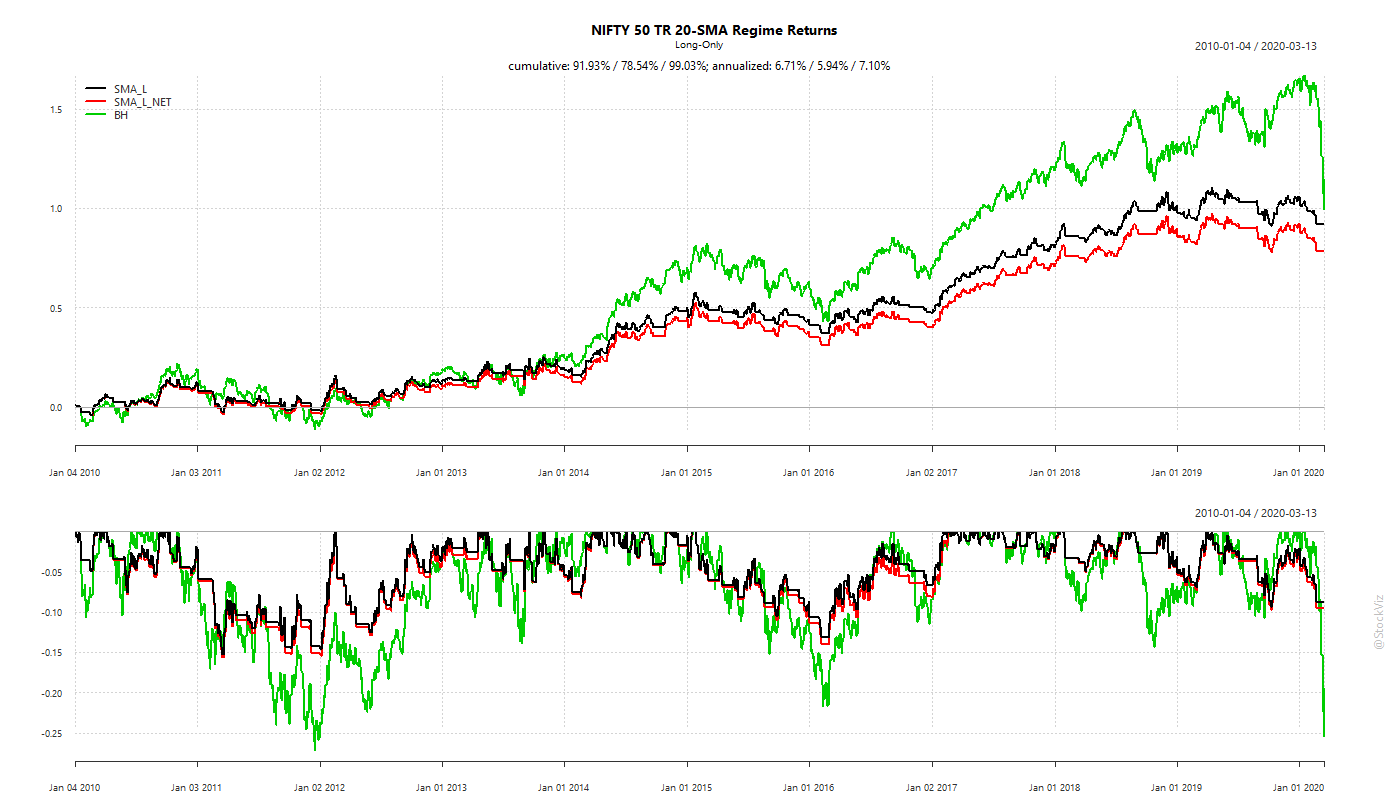
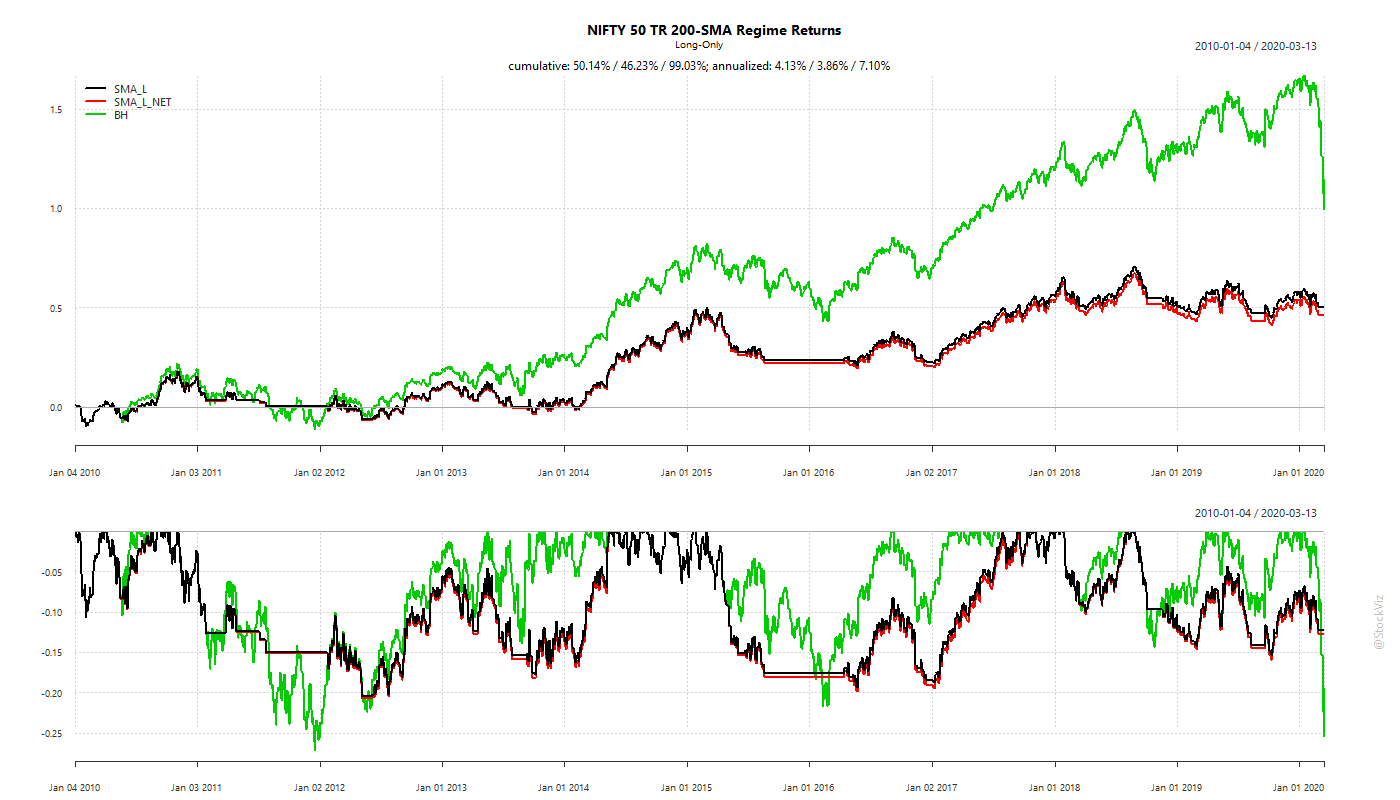
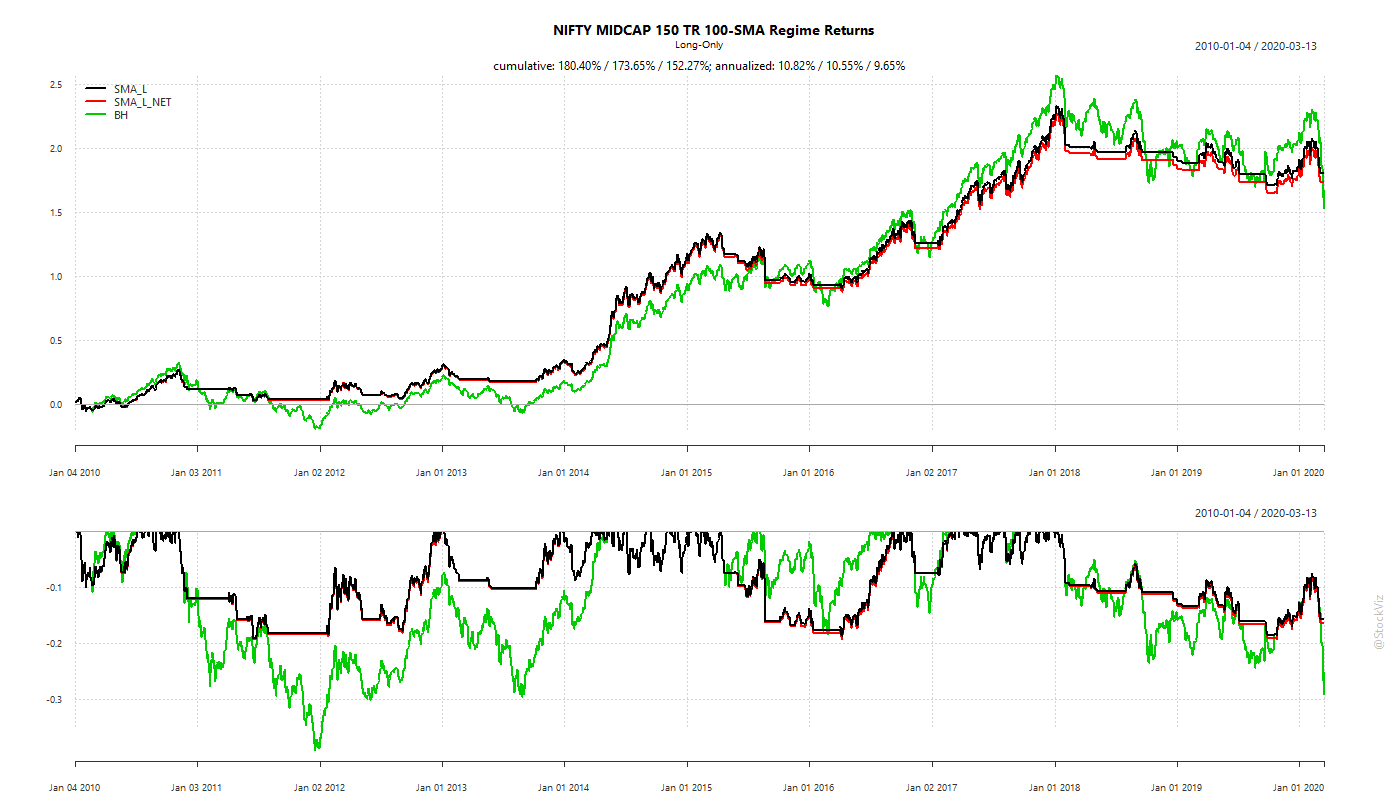
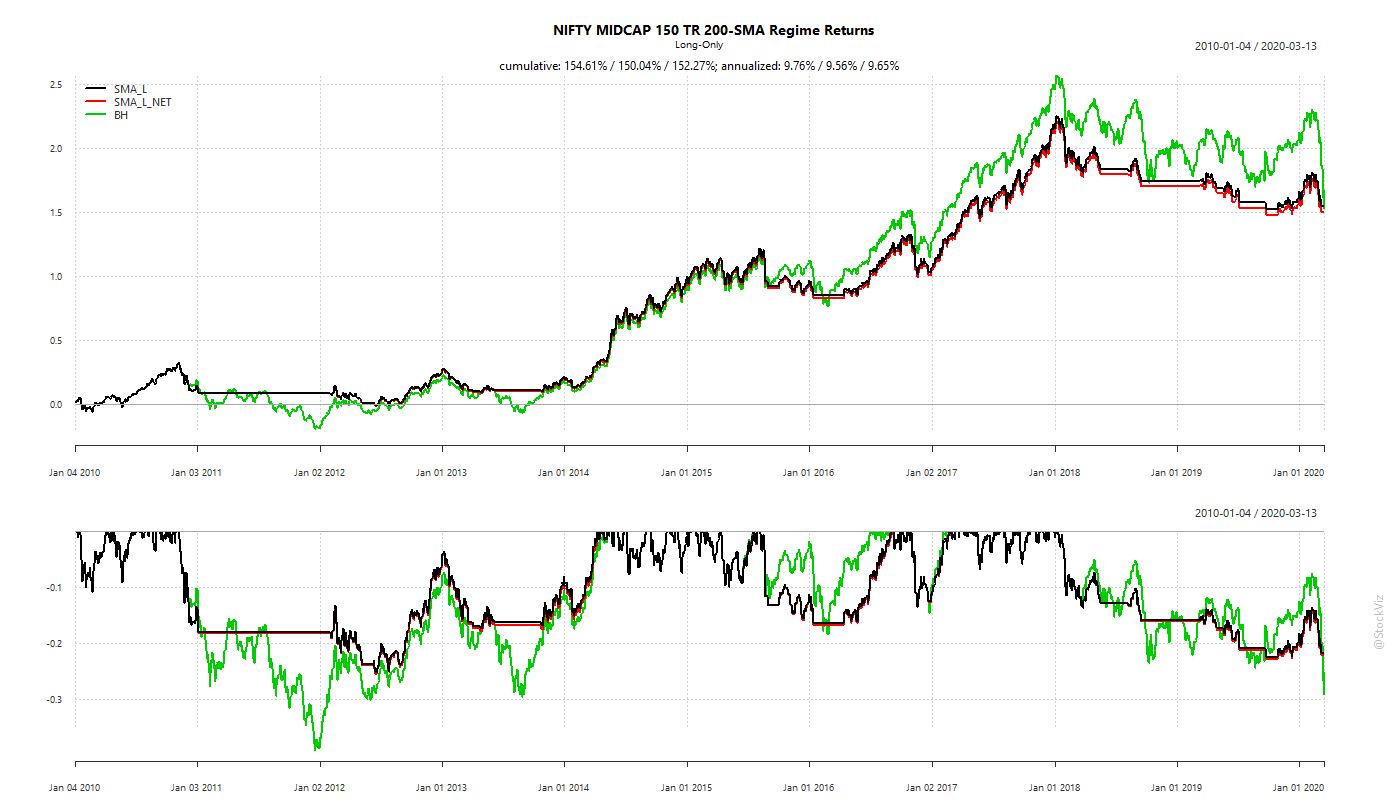
And what if you increased it to 200 days?
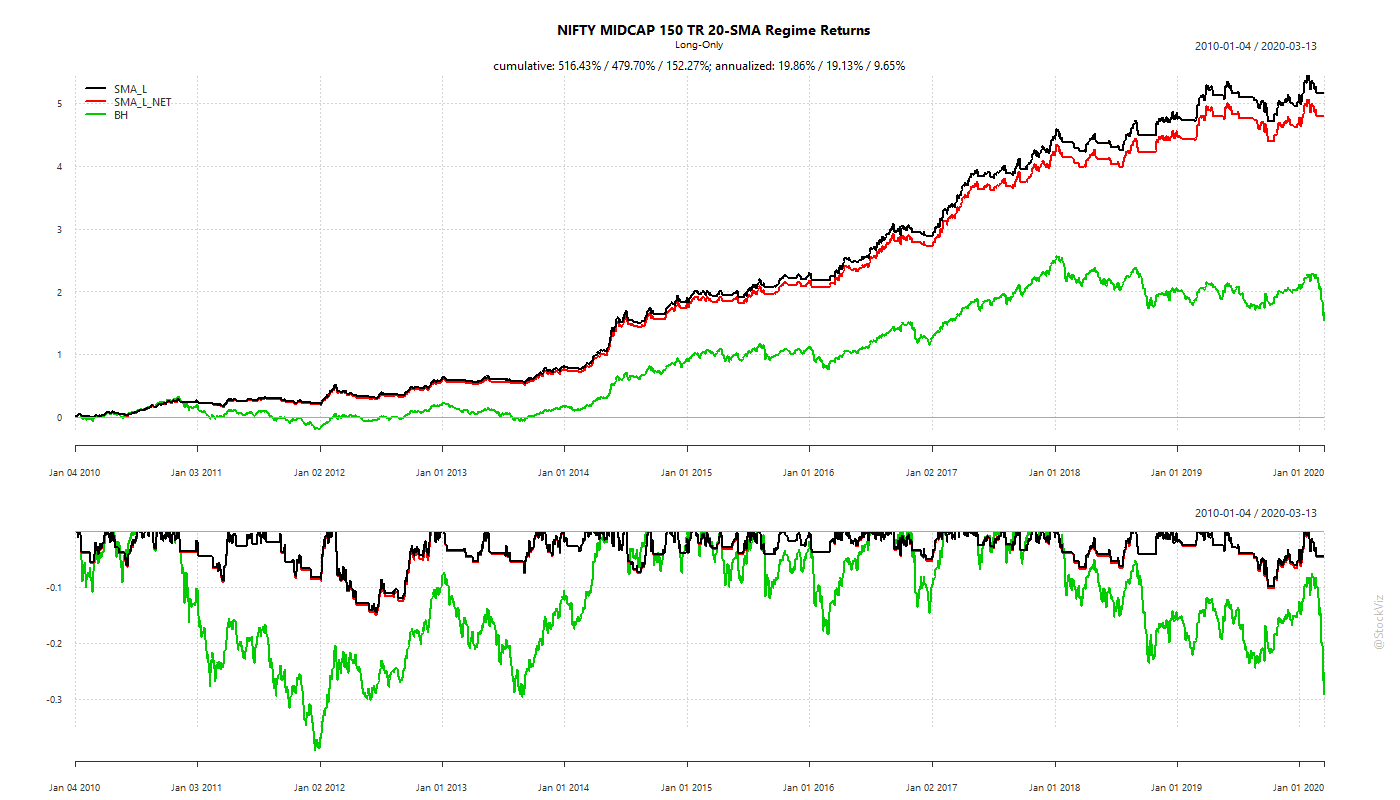
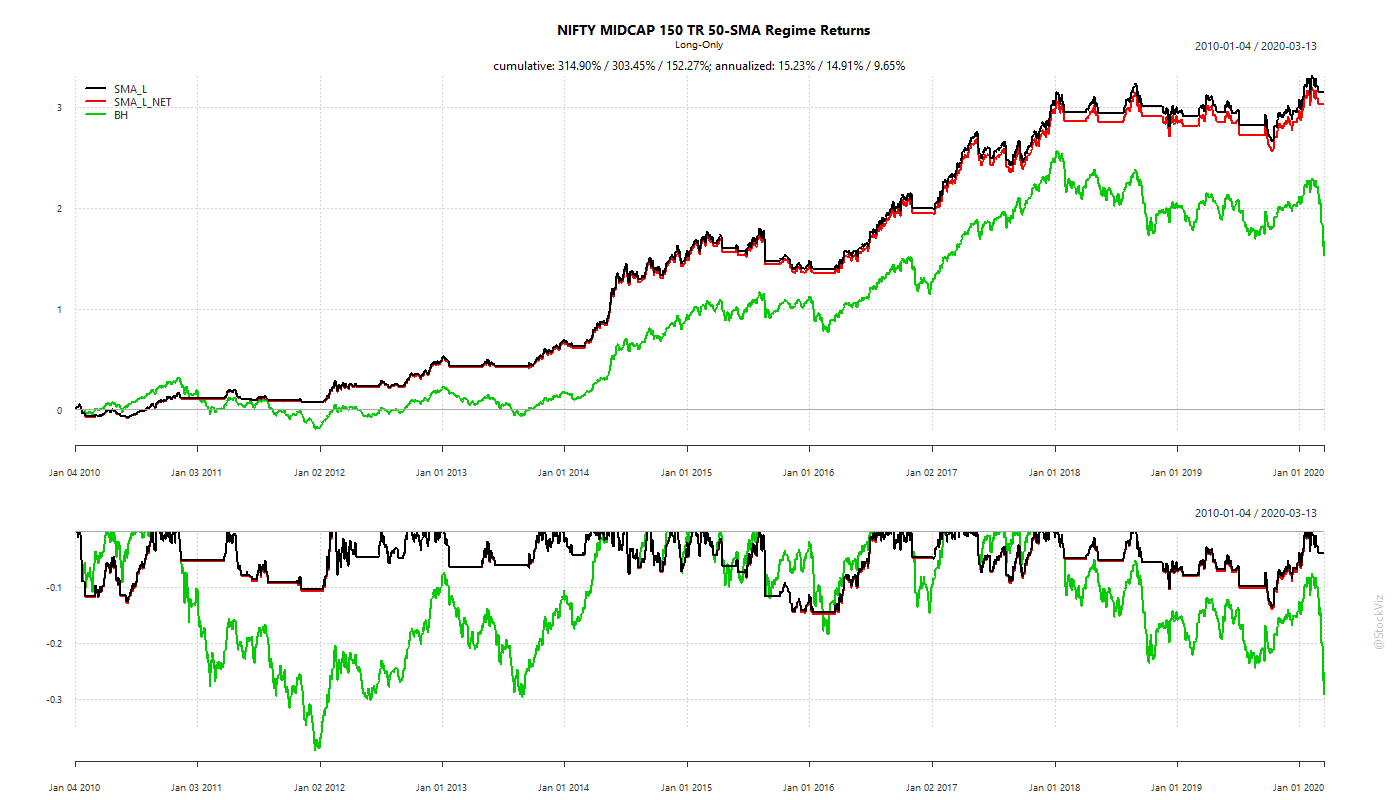
What about Midcaps?
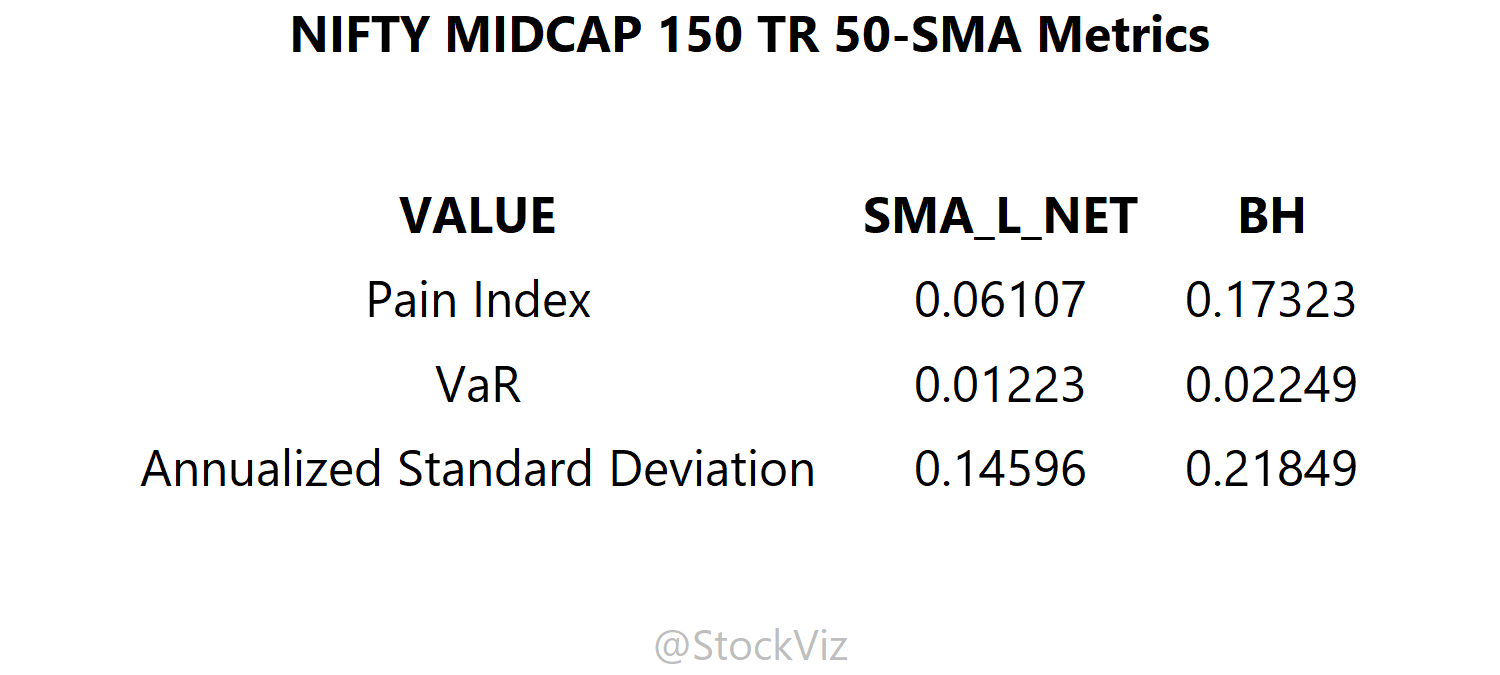
Who should hedge?
Most of the time, markets recover. However, the recovery time varies each time and there is no way to time hedging strategies. And each under-lying index behaves differently.
So, the reason to do it is investor’s own psychology and the asset one is long. If you, as a buy-and-hold long-term investor, can stomach the volatility, then there is probably no reason to hedge. Besides, portfolio volatility can be reduced through asset allocation as well (here, here.)
And remember: risk-management, whatever the strategy, involves paying upfront to mitigate risk that may or may-not befall.
Code and more charts on github.