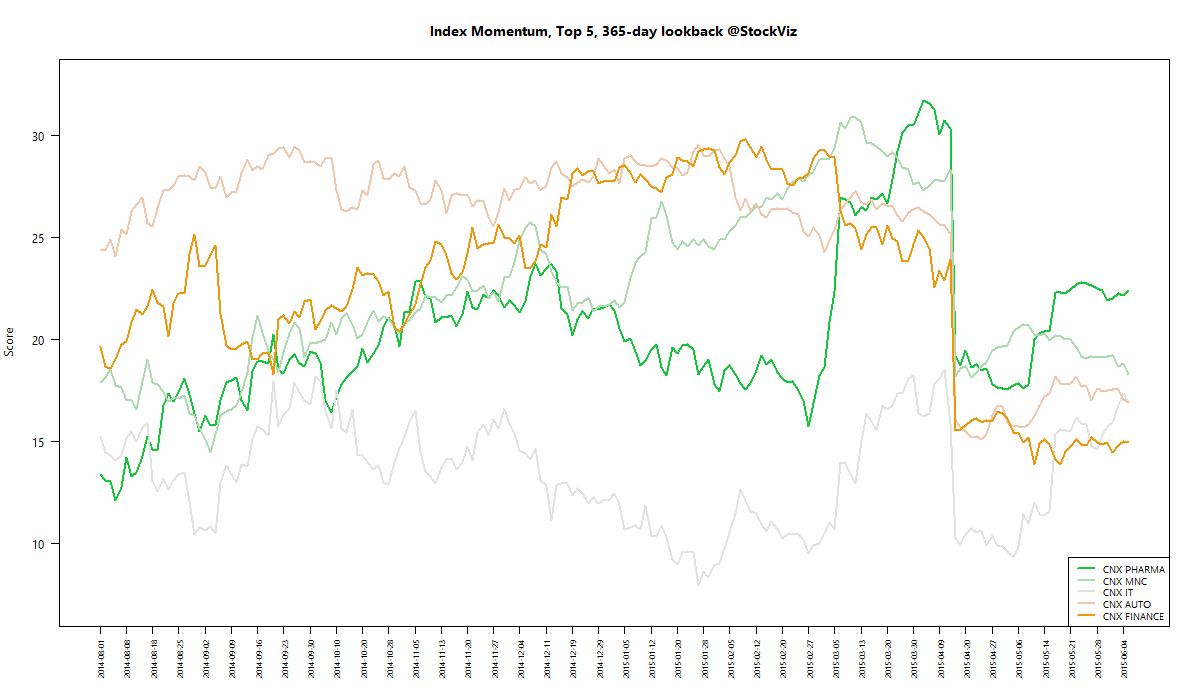
MOMENTUM
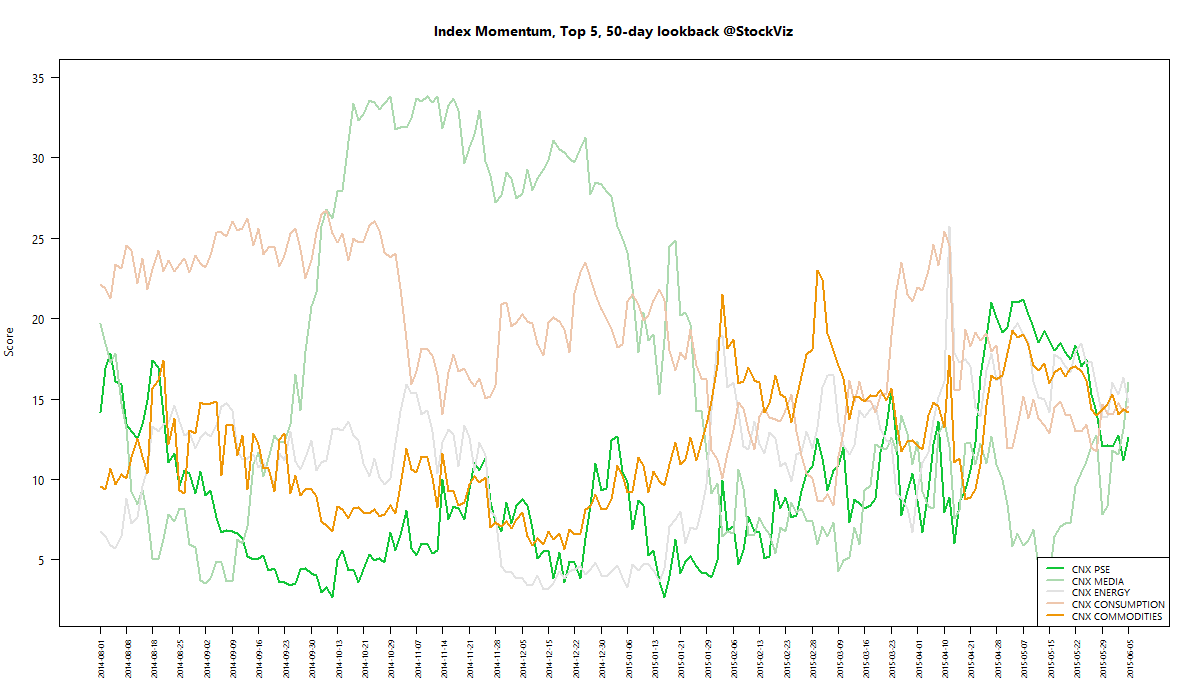
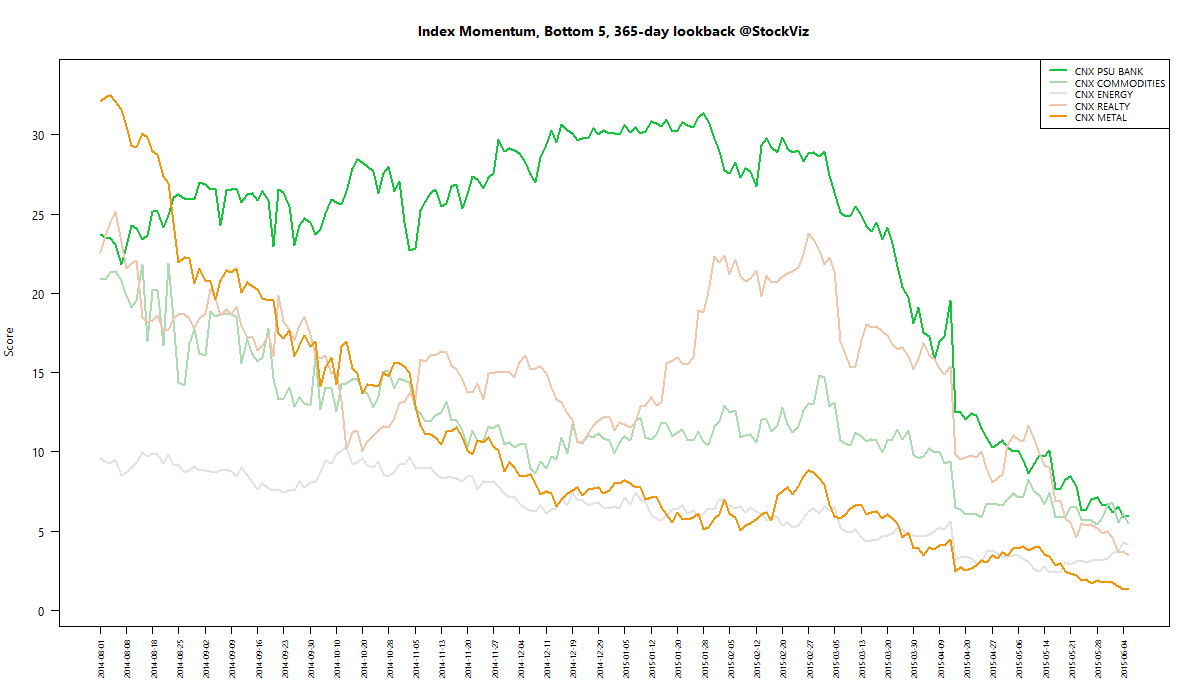
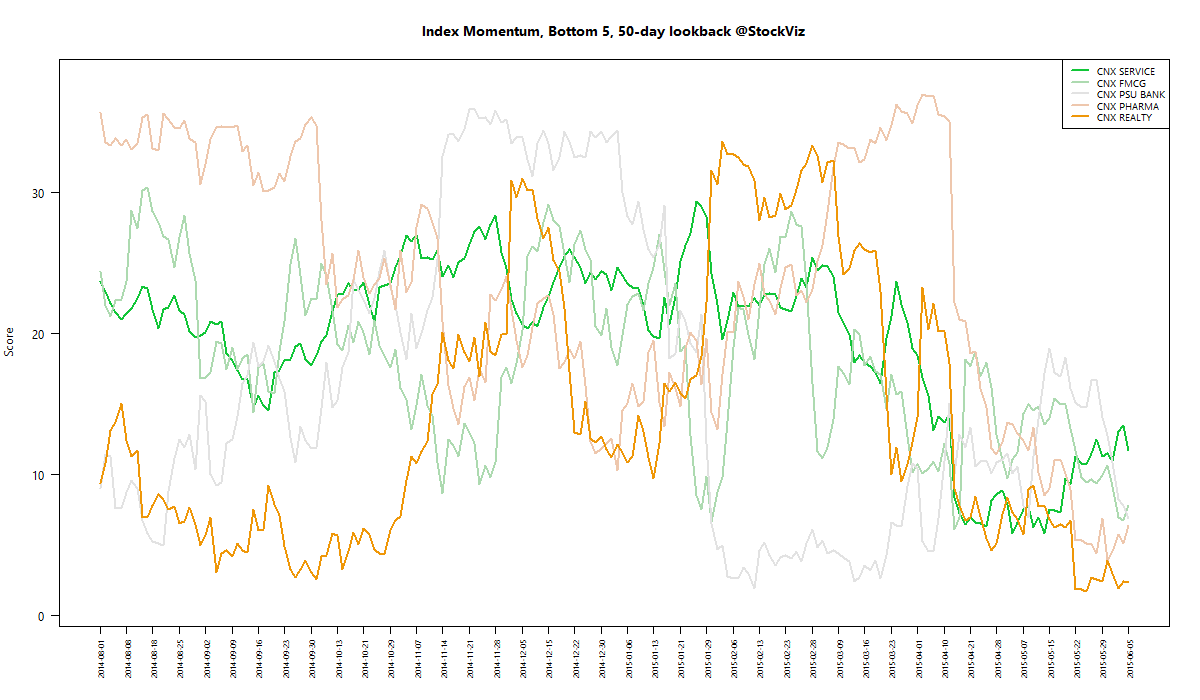
We run our proprietary momentum scoring algorithm on indices just like we do on stocks. You can use the momentum scores of sub-indices to get a sense for which sectors have the wind on their backs and those that are facing headwinds.
Traders can pick their longs in sectors with high short-term momentum and their shorts in sectors with low momentum. Investors can use the longer lookback scores to position themselves using our re-factored index Themes.
You can see how the momentum algorithm has performed on individual stocks here.
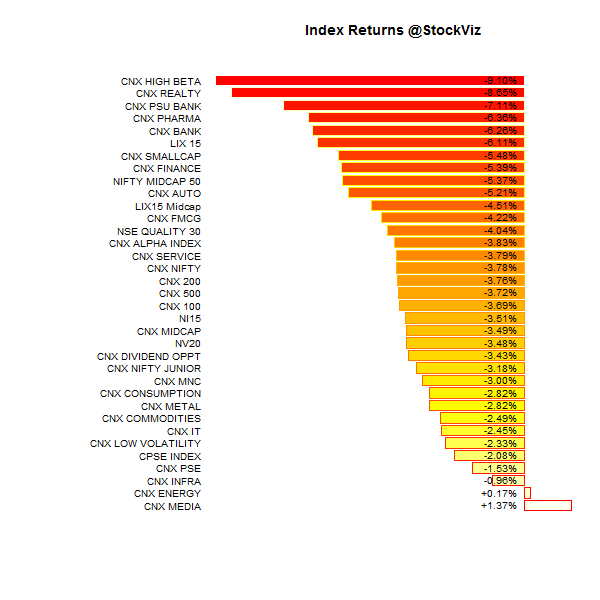
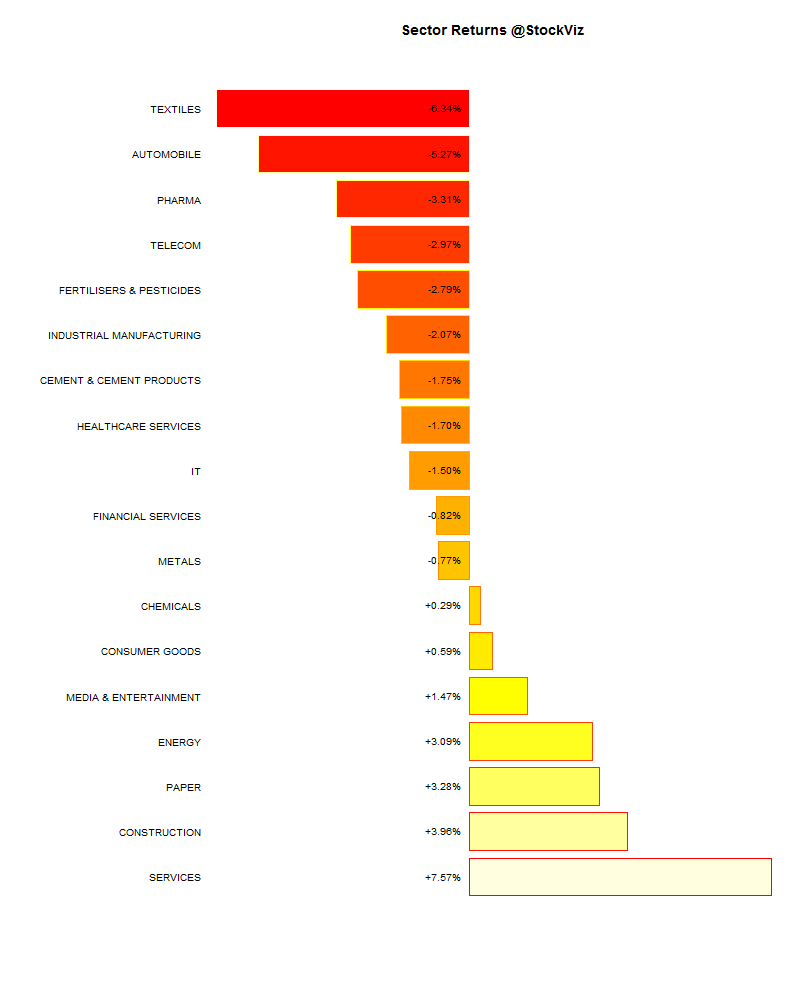
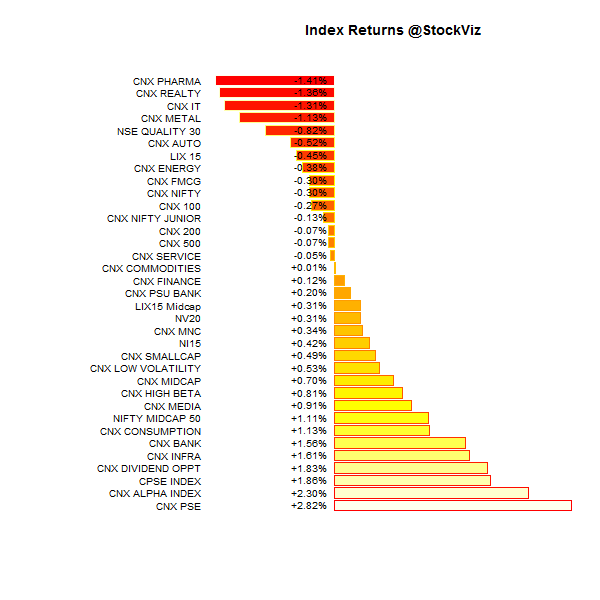
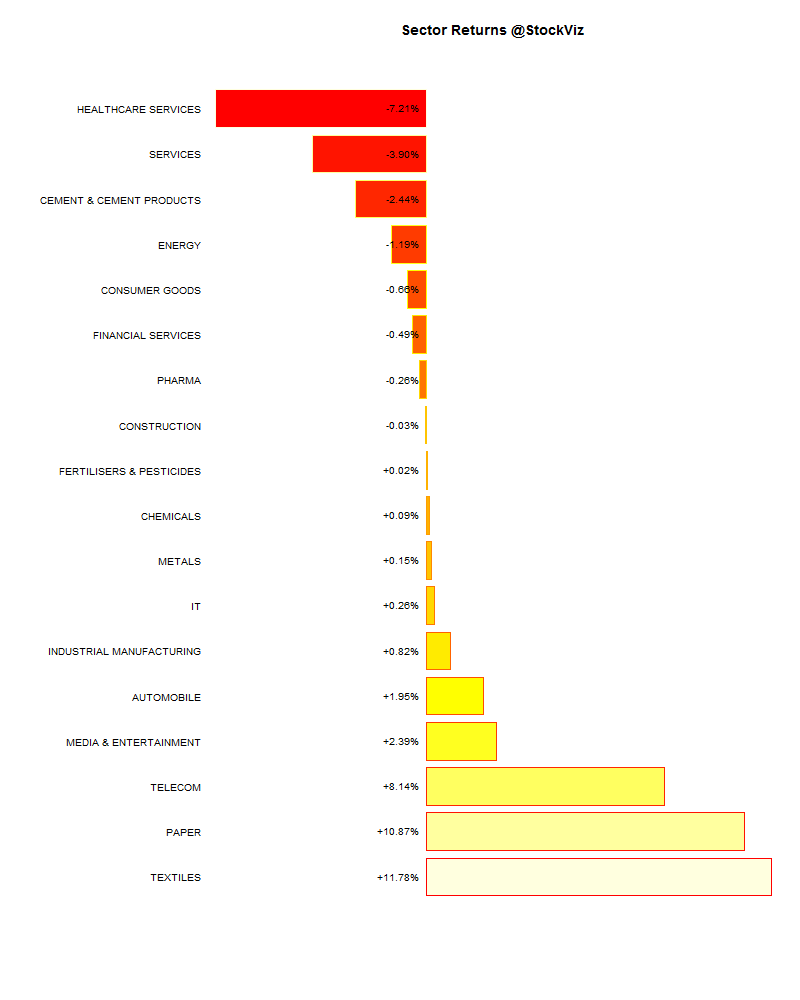
Here are the best and the worst sub-indices:
Refactored Index Performance
50-day performance, from March 24, 2015 through June 05, 2015:
Trend Model Summary
| Index |
Signal |
% From Peak |
Day of Peak |
| CNX AUTO |
SHORT |
11.07
|
2015-Jan-27
|
| CNX BANK |
SHORT |
14.62
|
2015-Jan-27
|
| CNX ENERGY |
SHORT |
29.22
|
2008-Jan-14
|
| CNX FMCG |
SHORT |
13.62
|
2015-Feb-25
|
| CNX INFRA |
SHORT |
49.05
|
2008-Jan-09
|
| CNX IT |
SHORT |
88.18
|
2000-Feb-21
|
| CNX MEDIA |
SHORT |
27.38
|
2008-Jan-04
|
| CNX METAL |
SHORT |
57.85
|
2008-Jan-04
|
| CNX MNC |
SHORT |
6.54
|
2015-Mar-12
|
| CNX NIFTY |
SHORT |
9.80
|
2015-Mar-03
|
| CNX PHARMA |
SHORT |
15.29
|
2015-Apr-08
|
| CNX PSE |
SHORT |
25.24
|
2008-Jan-04
|
| CNX REALTY |
SHORT |
90.30
|
2008-Jan-14
|
Banks and pharma down more than 15% from its April peak, Nifty 10% and MNC 7%…