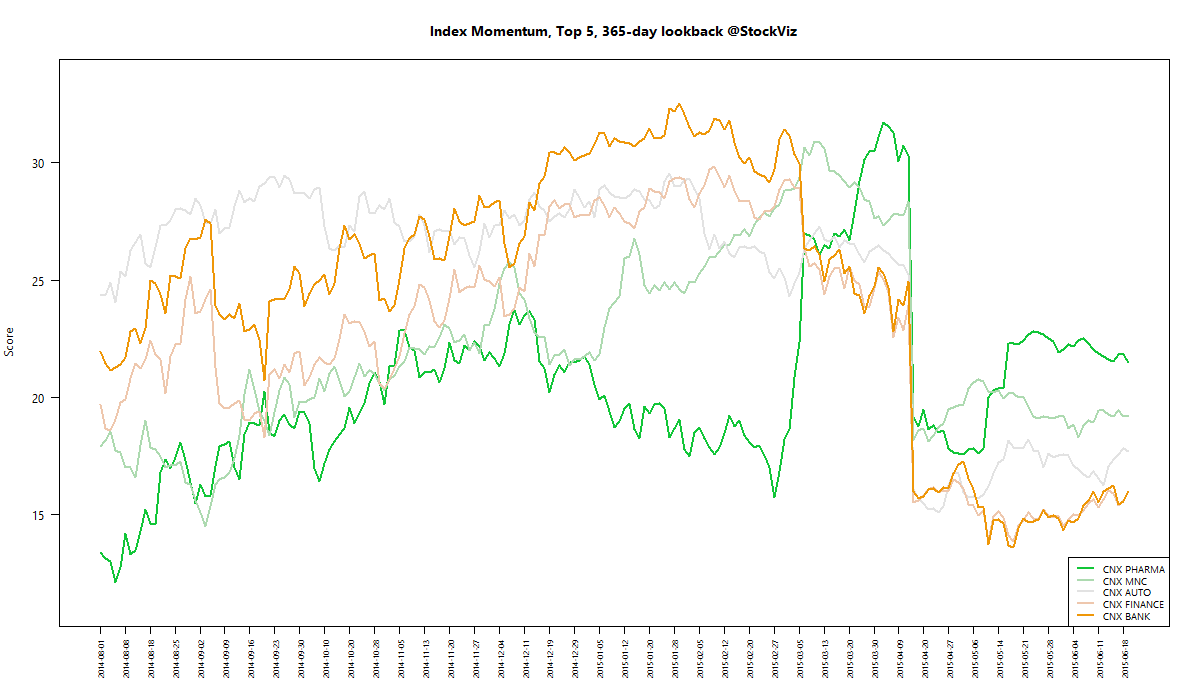
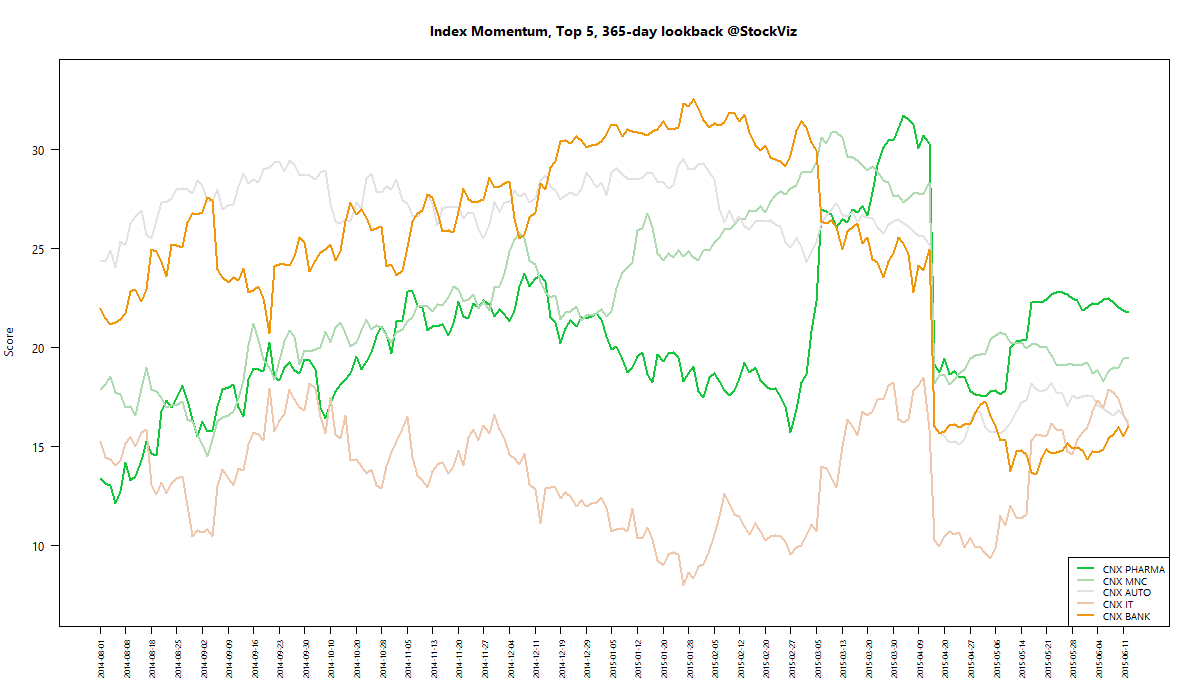
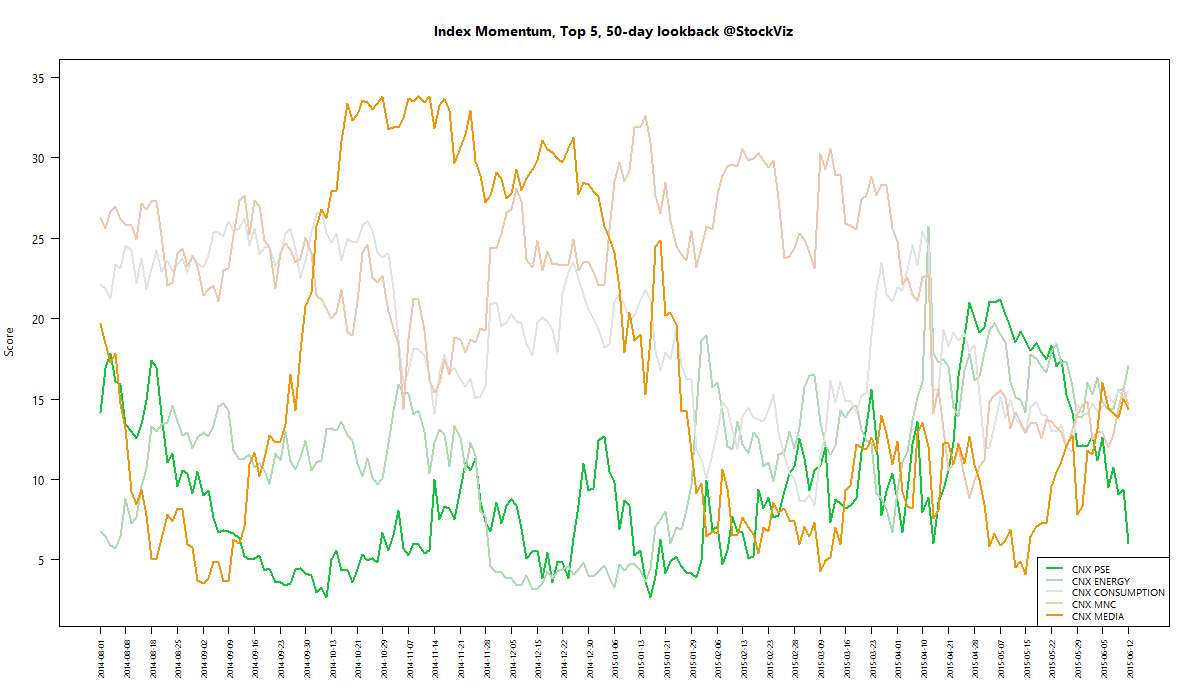
MOMENTUM
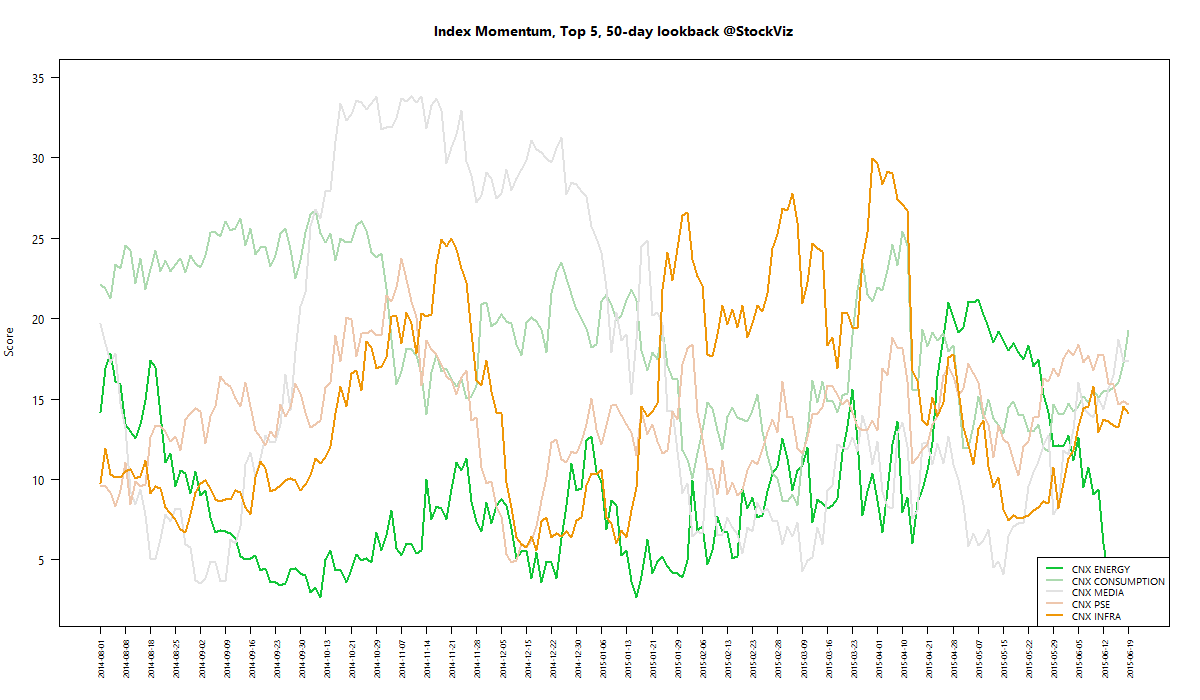
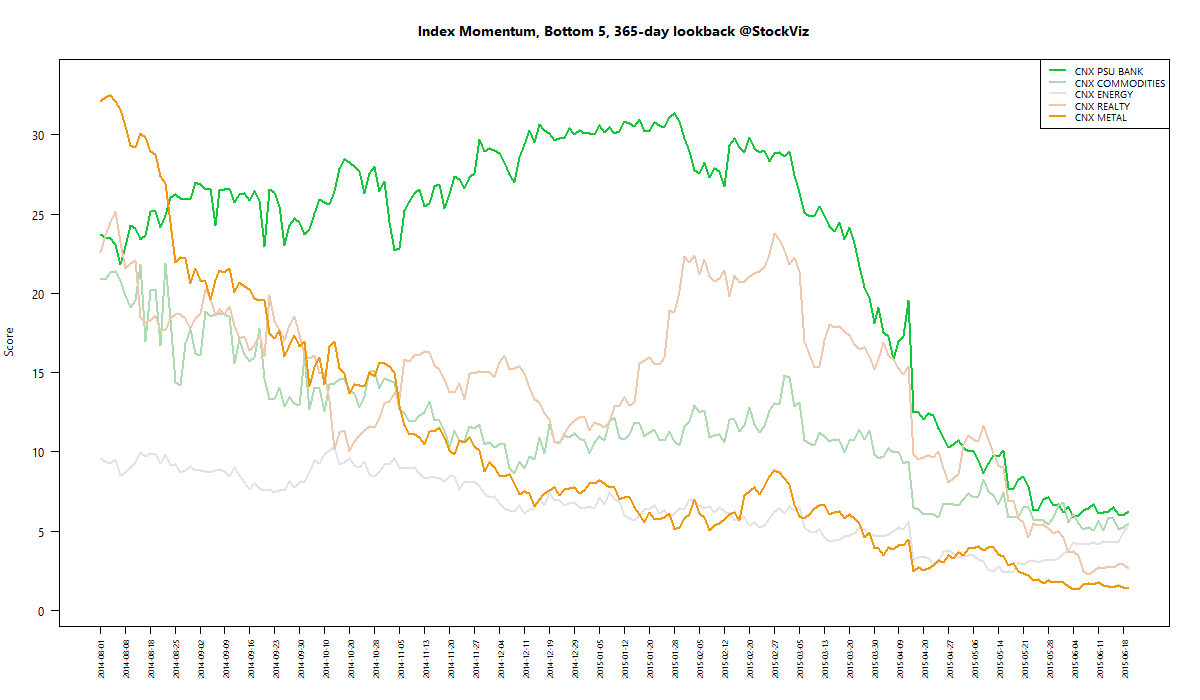
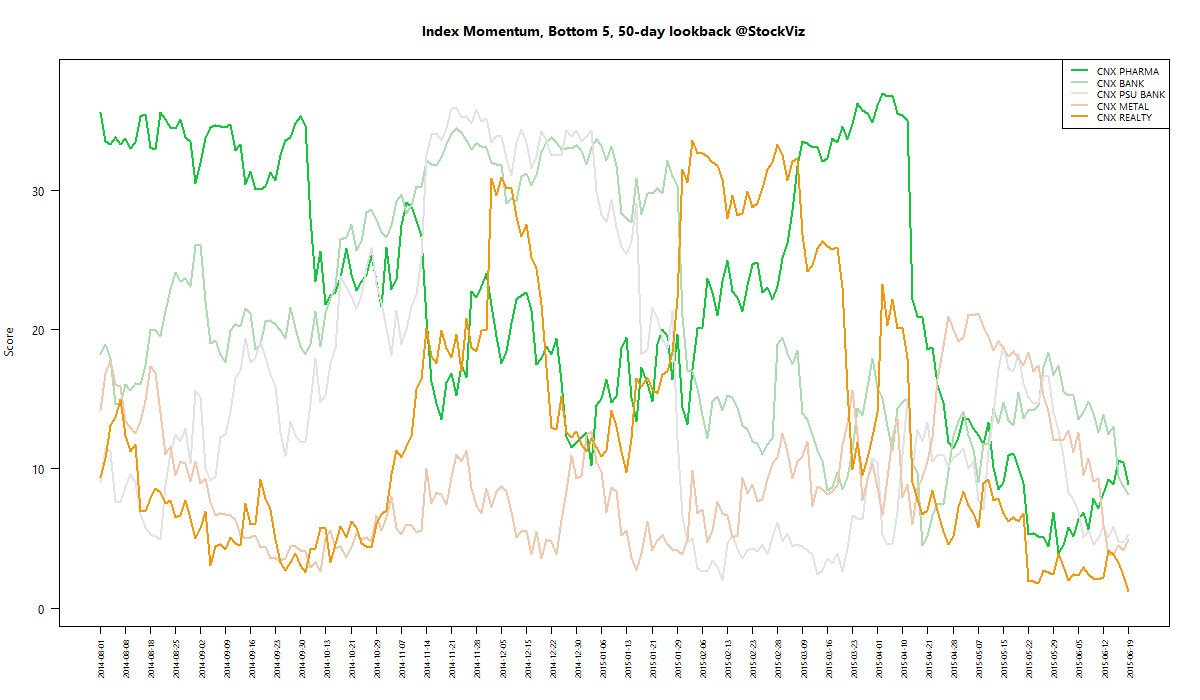
We run our proprietary momentum scoring algorithm on indices just like we do on stocks. You can use the momentum scores of sub-indices to get a sense for which sectors have the wind on their backs and those that are facing headwinds.
Traders can pick their longs in sectors with high short-term momentum and their shorts in sectors with low momentum. Investors can use the longer lookback scores to position themselves using our re-factored index Themes.
You can see how the momentum algorithm has performed on individual stocks here.
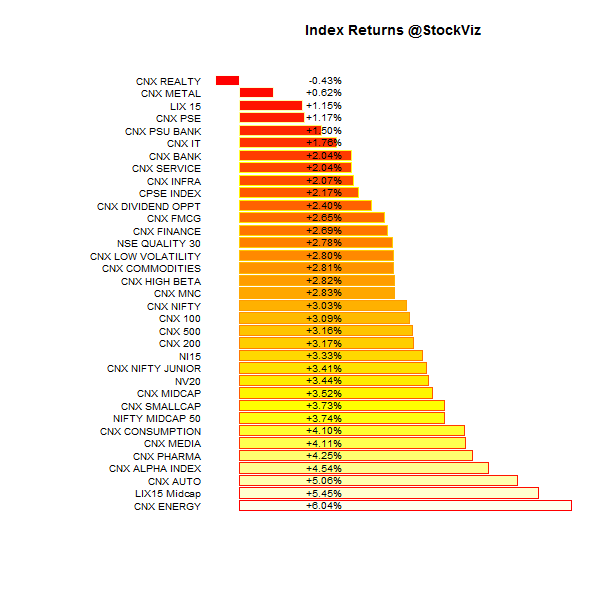
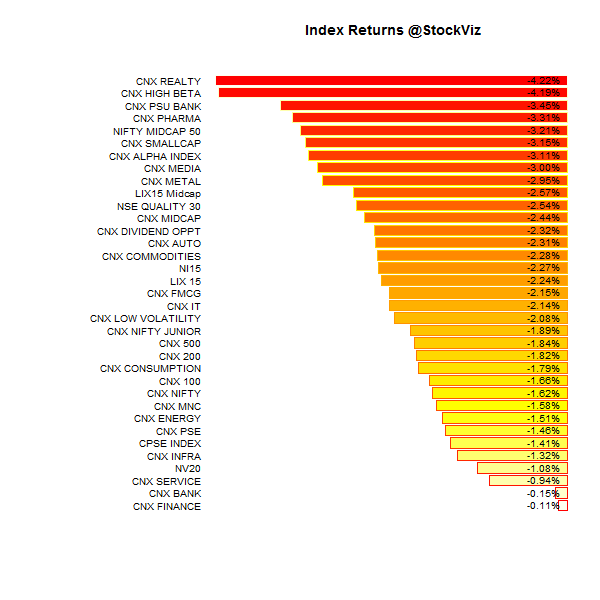
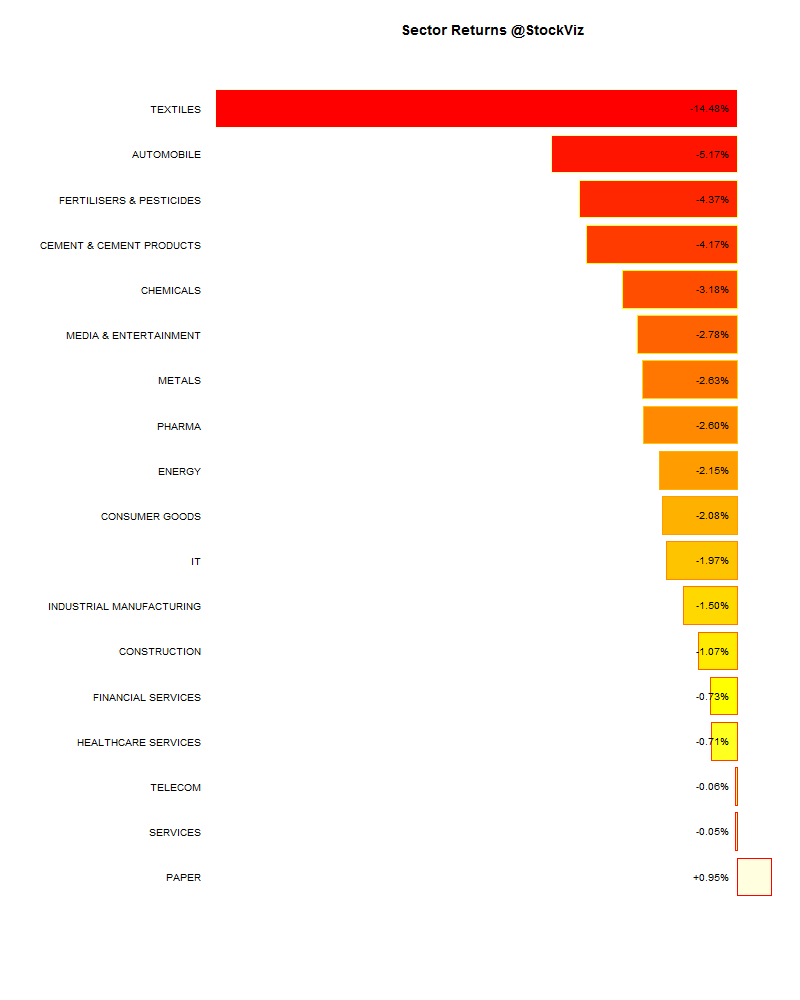
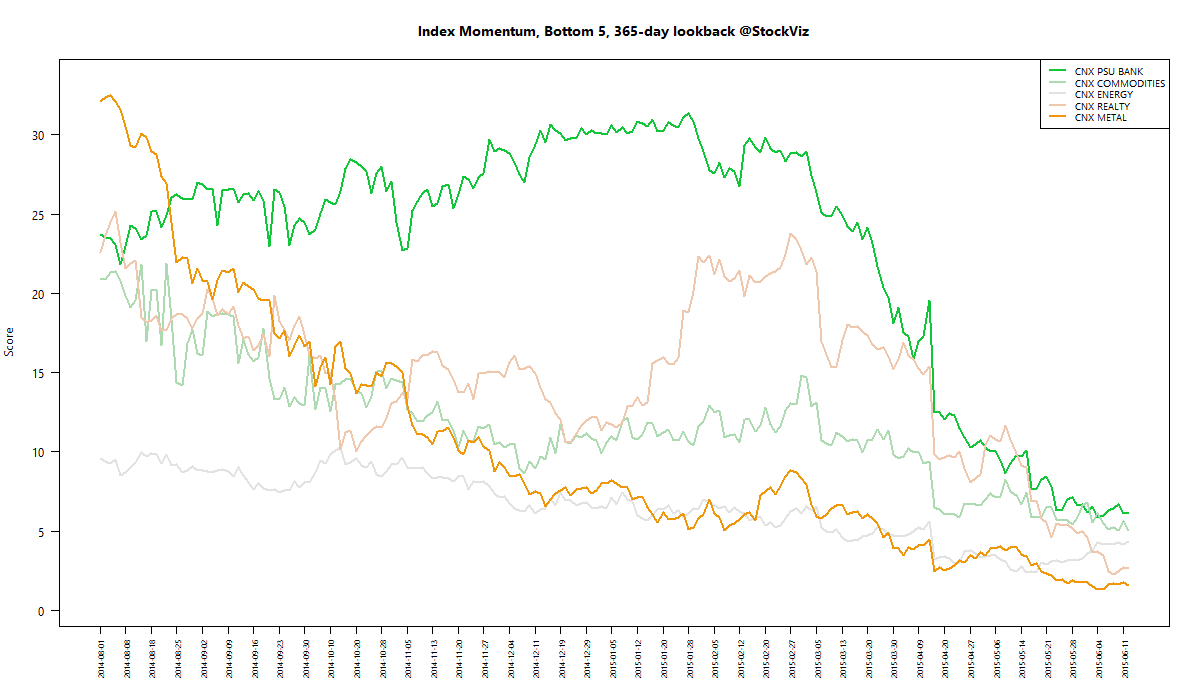
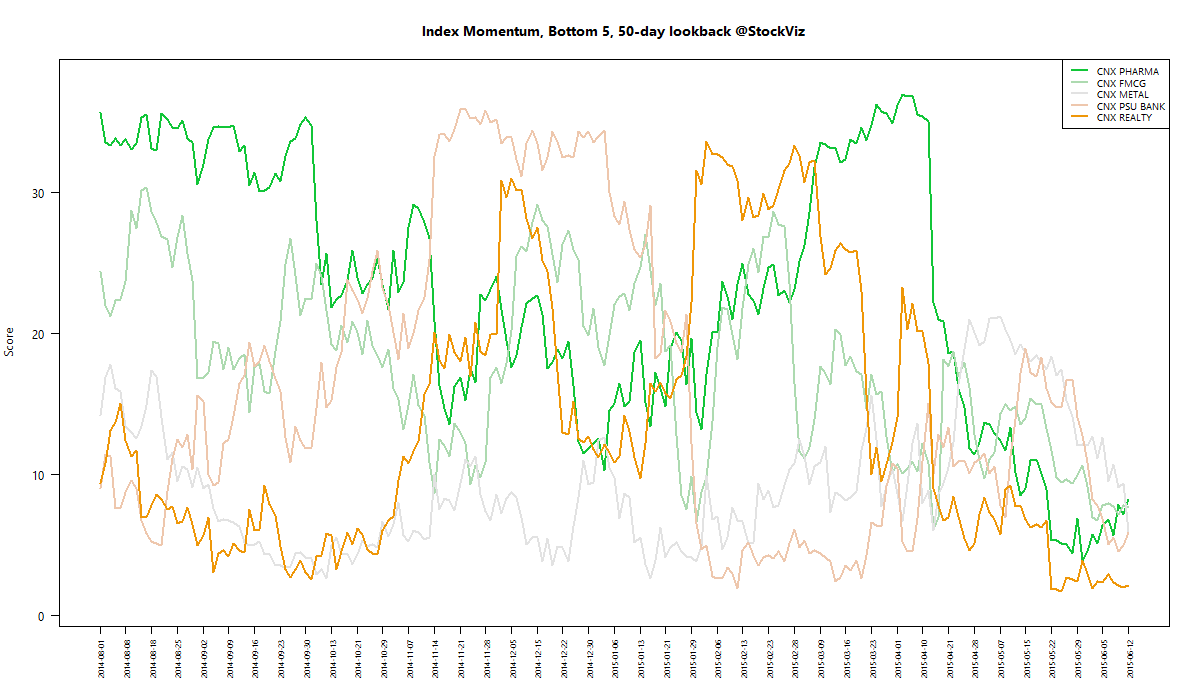
Here are the best and the worst sub-indices:
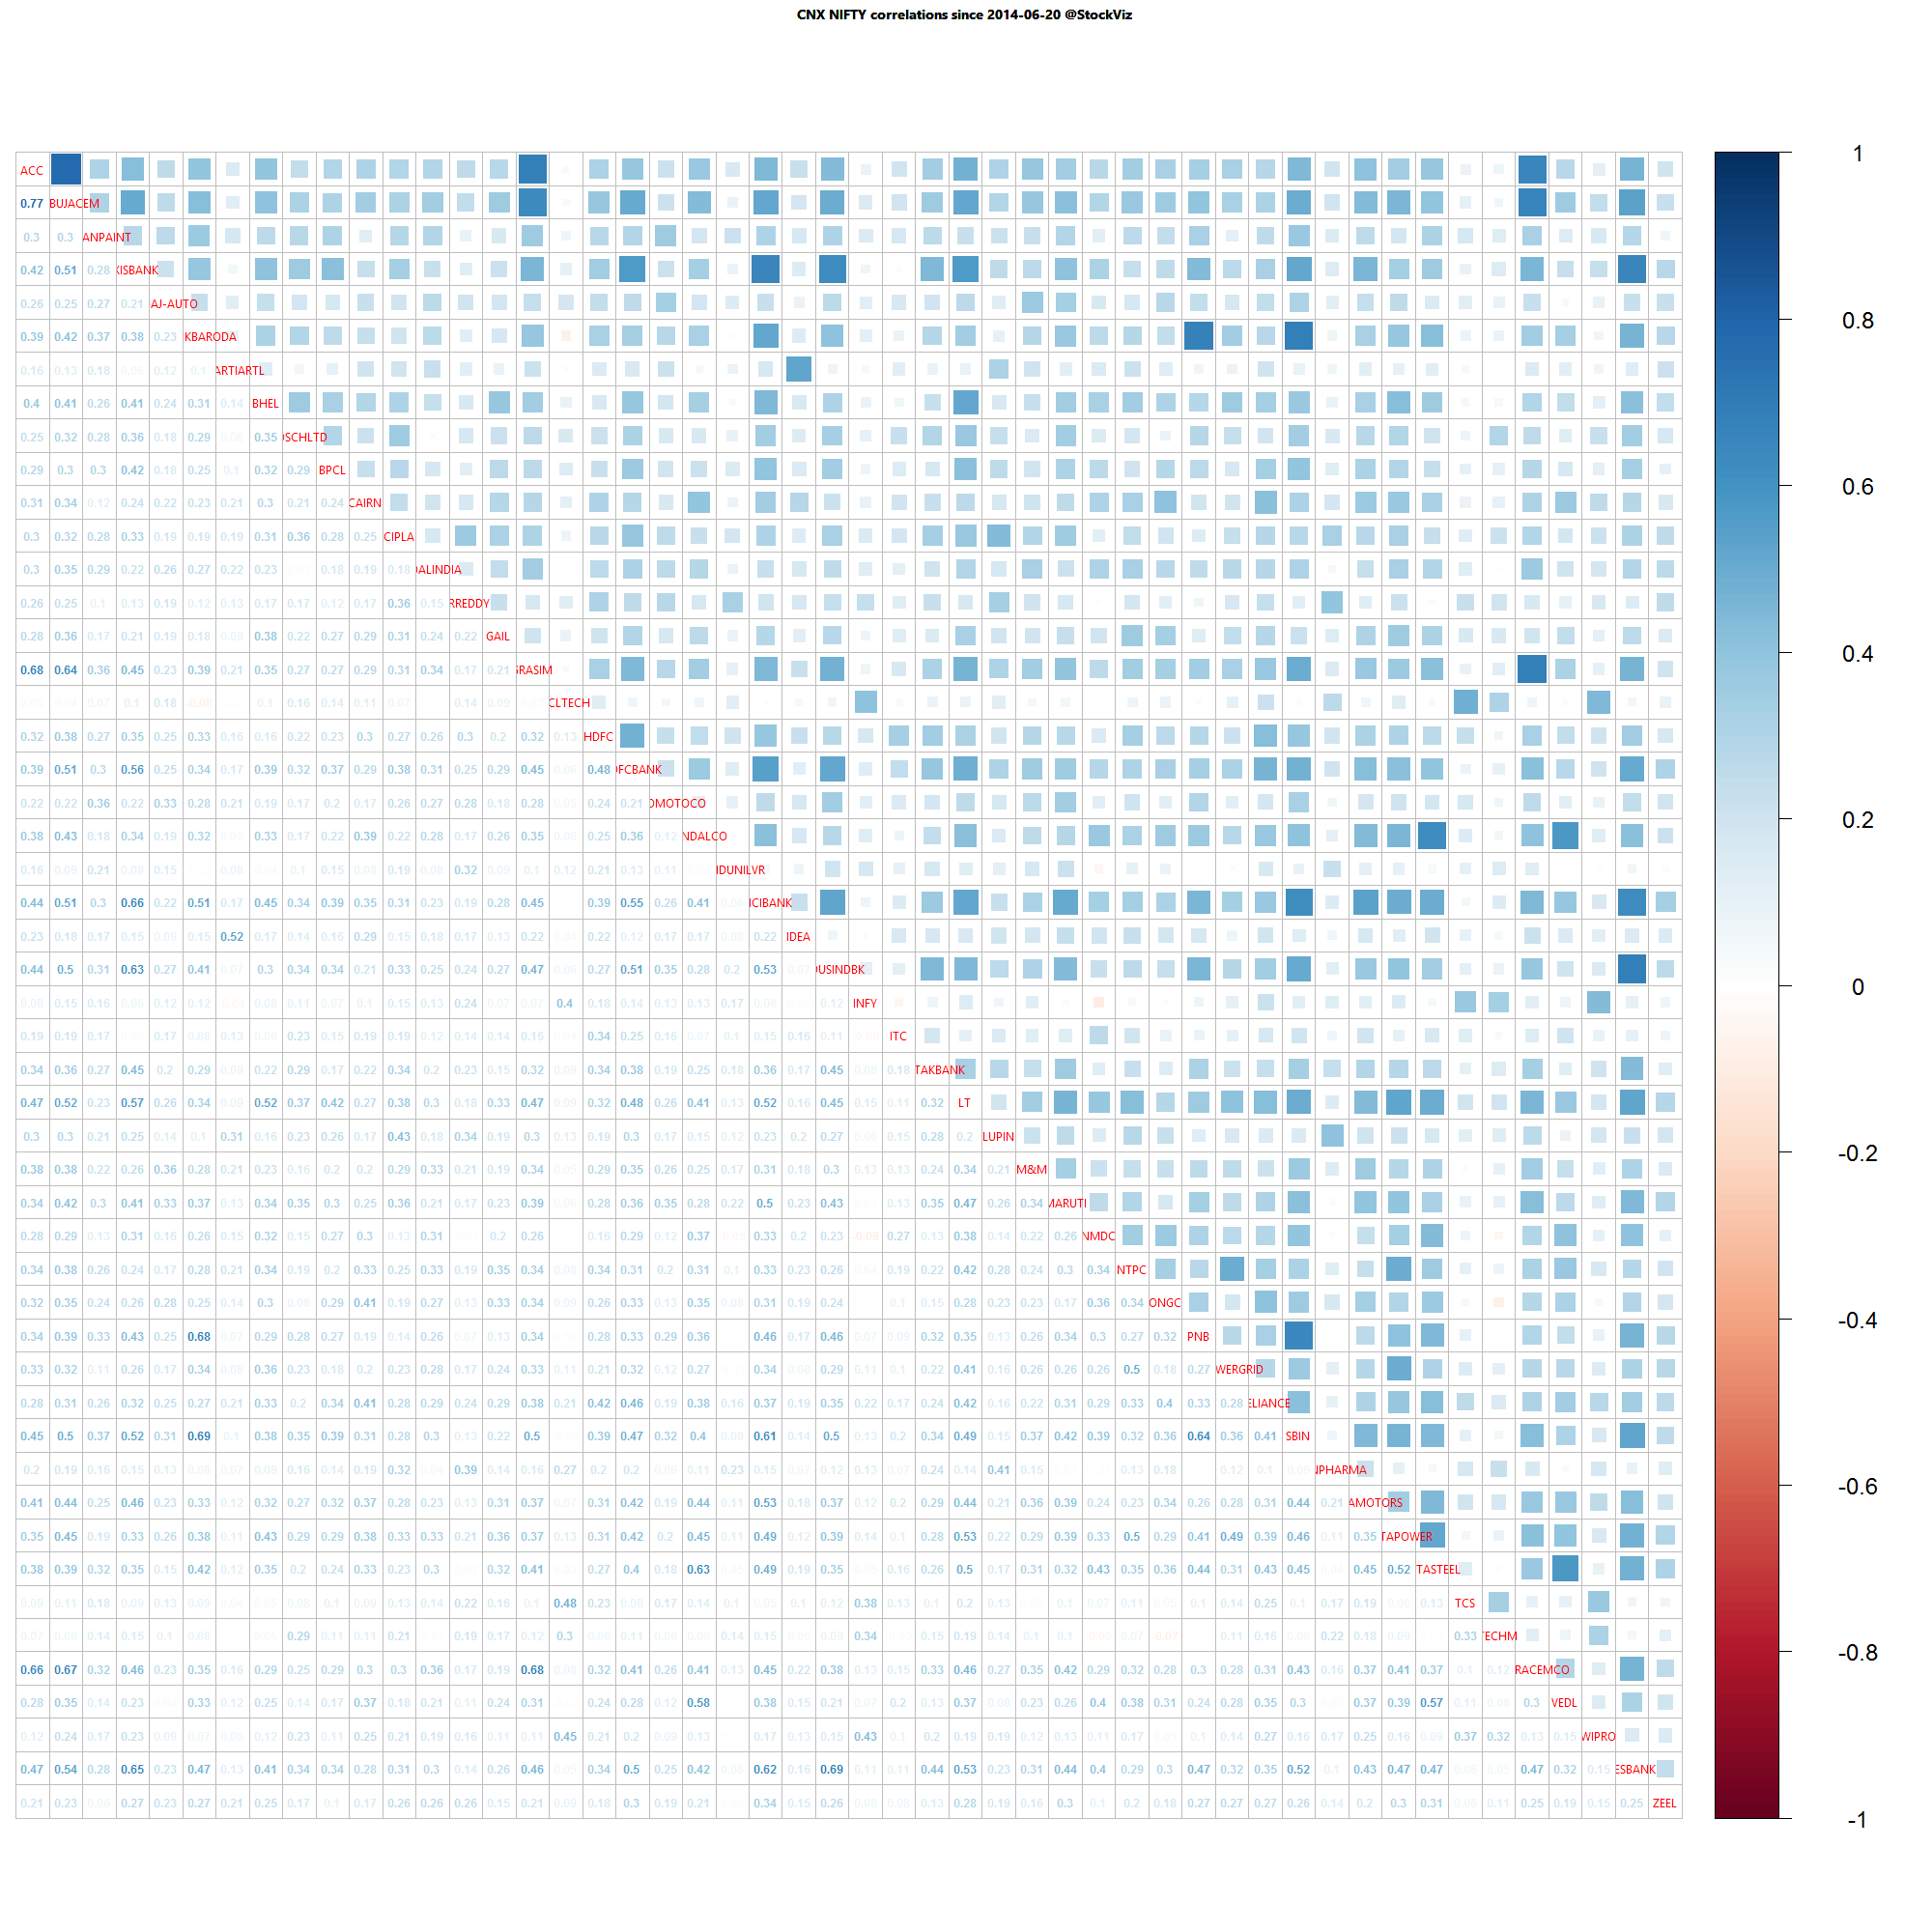
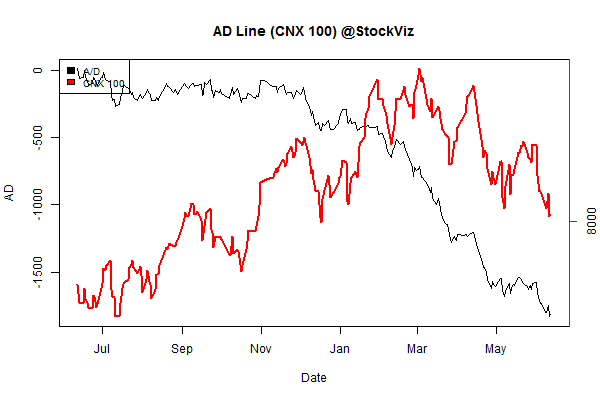
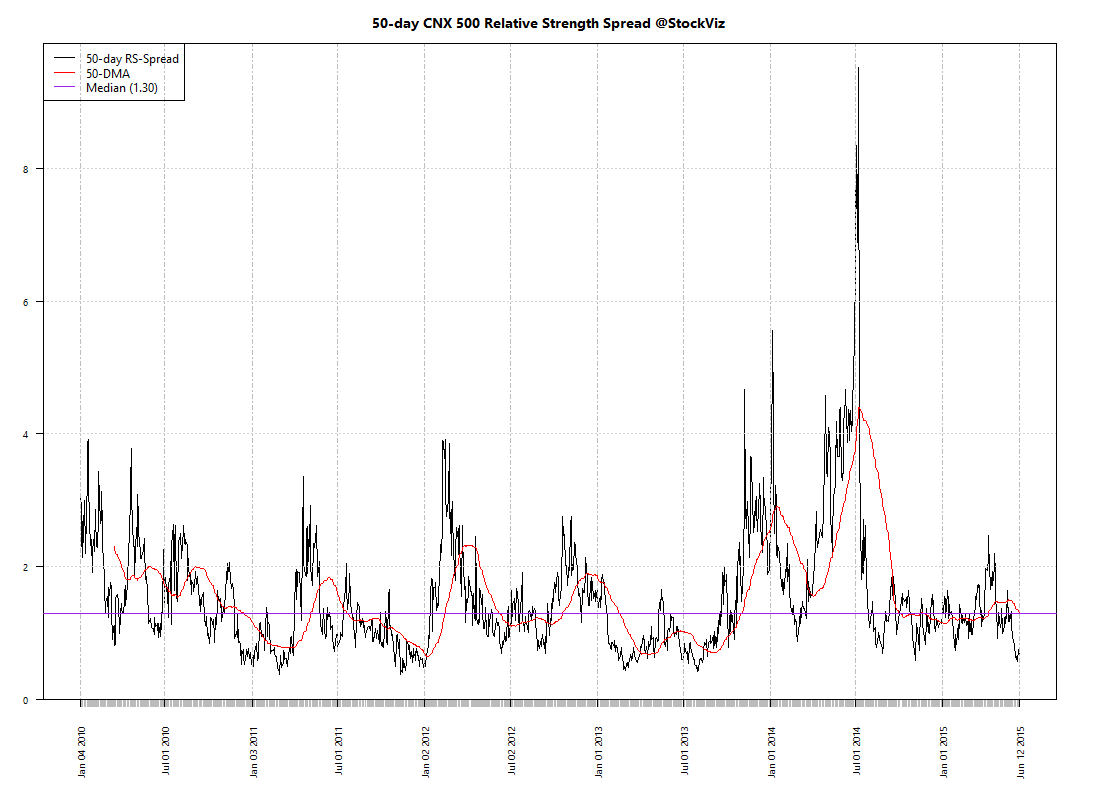
Relative Strength Spread
Refactored Index Performance
50-day performance, from March 31, 2015 through June 12, 2015:
Trend Model Summary
| Index |
Signal |
% From Peak |
Day of Peak |
| CNX AUTO |
LONG |
13.13
|
2015-Jan-27
|
| CNX BANK |
LONG |
14.75
|
2015-Jan-27
|
| CNX ENERGY |
SHORT |
30.29
|
2008-Jan-14
|
| CNX FMCG |
LONG |
15.47
|
2015-Feb-25
|
| CNX INFRA |
SHORT |
49.72
|
2008-Jan-09
|
| CNX IT |
LONG |
88.43
|
2000-Feb-21
|
| CNX MEDIA |
SHORT |
29.56
|
2008-Jan-04
|
| CNX METAL |
LONG |
59.10
|
2008-Jan-04
|
| CNX MNC |
LONG |
8.01
|
2015-Mar-12
|
| CNX NIFTY |
LONG |
11.26
|
2015-Mar-03
|
| CNX PHARMA |
LONG |
18.09
|
2015-Apr-08
|
| CNX PSE |
SHORT |
26.34
|
2008-Jan-04
|
| CNX REALTY |
LONG |
90.71
|
2008-Jan-14
|
Given the state of the relative strength spread, good luck with trend following strategies! But it looks like there are some sectors where a positive trend is reasserting itself. Are we seeing green shoots in pharma, media and banks?