Equities
Commodities
| Energy |
| WTI Crude Oil |
-4.88% |
| Brent Crude Oil |
-3.01% |
| Ethanol |
+1.60% |
| Heating Oil |
-3.34% |
| Natural Gas |
+0.11% |
| RBOB Gasoline |
+1.27% |
| Metals |
| Gold 100oz |
-0.63% |
| Palladium |
-4.98% |
| Copper |
-2.67% |
| Platinum |
-4.71% |
| Silver 5000oz |
+0.00% |
| Agricultural |
| Coffee (Robusta) |
+0.16% |
| Soybean Meal |
+2.27% |
| Soybeans |
-0.19% |
| Sugar #11 |
+0.98% |
| Wheat |
-2.13% |
| White Sugar |
+0.59% |
| Cattle |
-2.51% |
| Cocoa |
+1.16% |
| Coffee (Arabica) |
-2.38% |
| Cotton |
-2.92% |
| Feeder Cattle |
-2.73% |
| Orange Juice |
+3.84% |
| Corn |
+1.55% |
| Lean Hogs |
+0.03% |
| Lumber |
+2.32% |
Credit Indices
| Index |
Change |
| Markit CDX EM |
-0.81% |
| Markit CDX NA HY |
-0.81% |
| Markit CDX NA IG |
+5.25% |
| Markit iTraxx Asia ex-Japan IG |
+11.27% |
| Markit iTraxx Australia |
+11.48% |
| Markit iTraxx Europe |
+7.27% |
| Markit iTraxx Europe Crossover |
+23.03% |
| Markit iTraxx Japan |
+7.04% |
| Markit iTraxx SovX Western Europe |
+2.68% |
| Markit LCDX (Loan CDS) |
+0.02% |
| Markit MCDX (Municipal CDS) |
+1.76% |
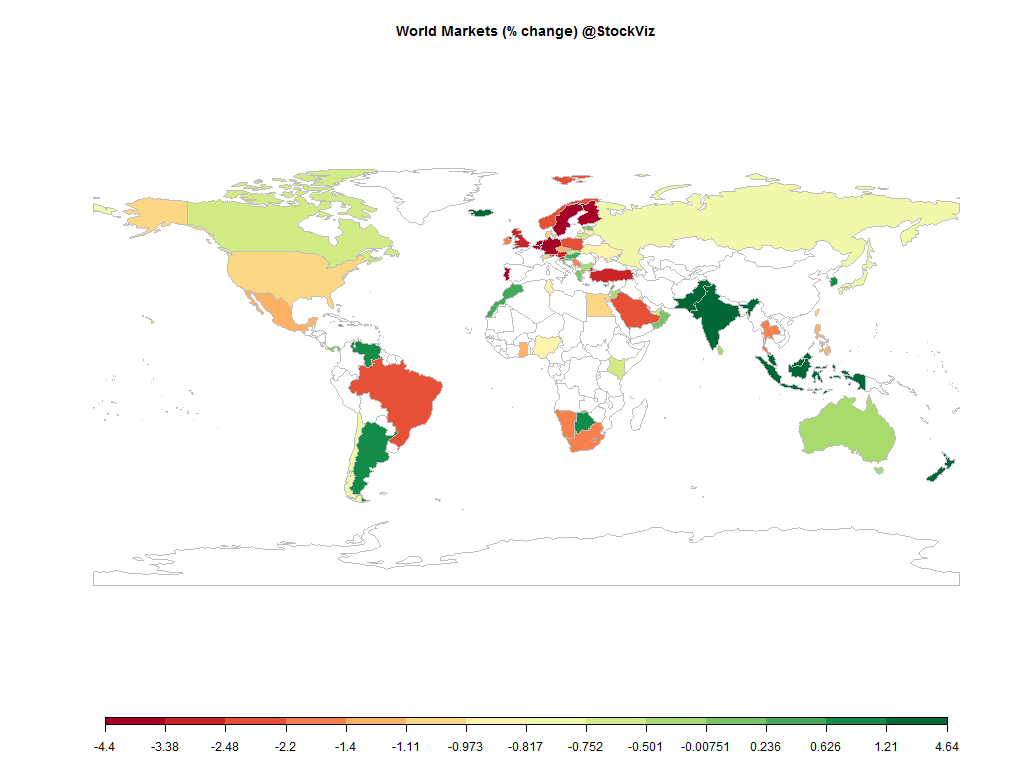
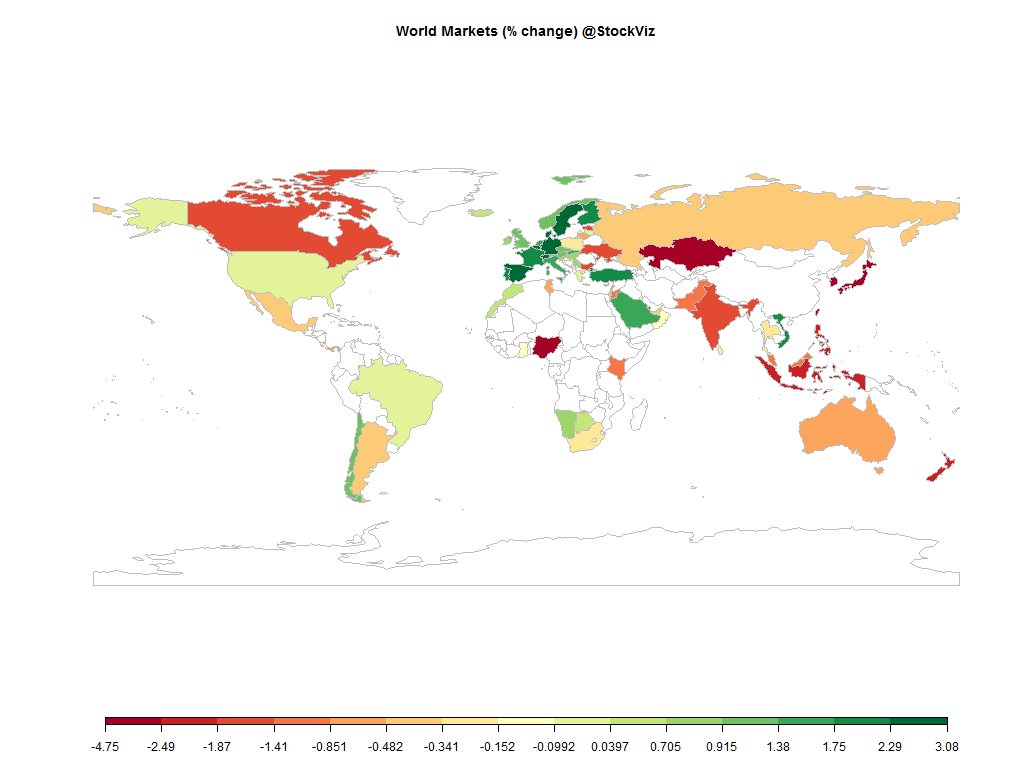
I think the market has had enough of Greece and China. The next few weeks are going to be all about earnings and how badly companies are going to disappoint investors…
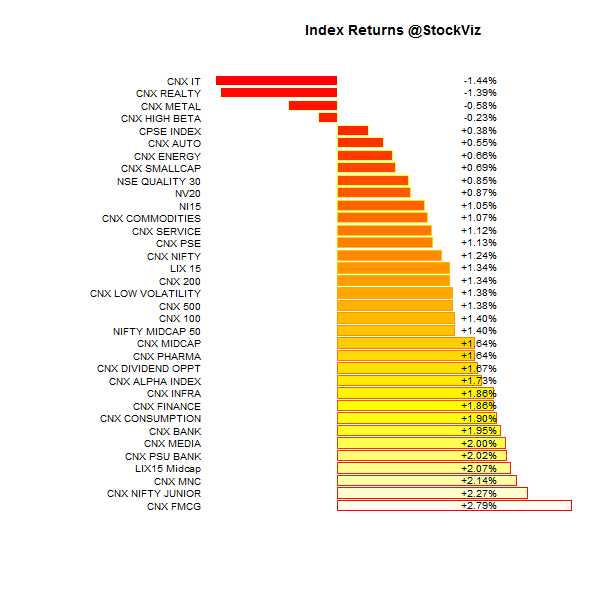
Index Returns
For a deeper dive into indices, check out our weekly Index Update.
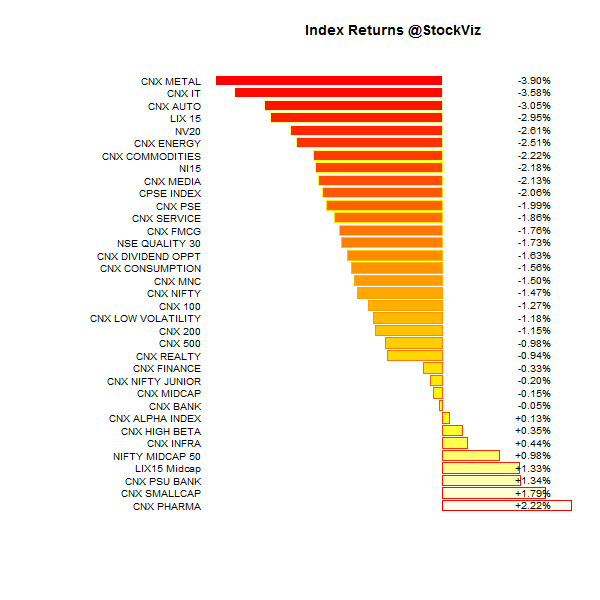
Market Cap Decile Performance
| Decile |
Mkt. Cap. |
Adv/Decl |
| 1 (micro) |
+7.34% |
77/57 |
| 2 |
+6.18% |
79/54 |
| 3 |
+7.31% |
77/57 |
| 4 |
+5.66% |
77/56 |
| 5 |
+4.21% |
74/59 |
| 6 |
+2.25% |
67/67 |
| 7 |
+1.04% |
71/62 |
| 8 |
+1.12% |
73/61 |
| 9 |
+0.60% |
63/70 |
| 10 (mega) |
-1.05% |
76/58 |
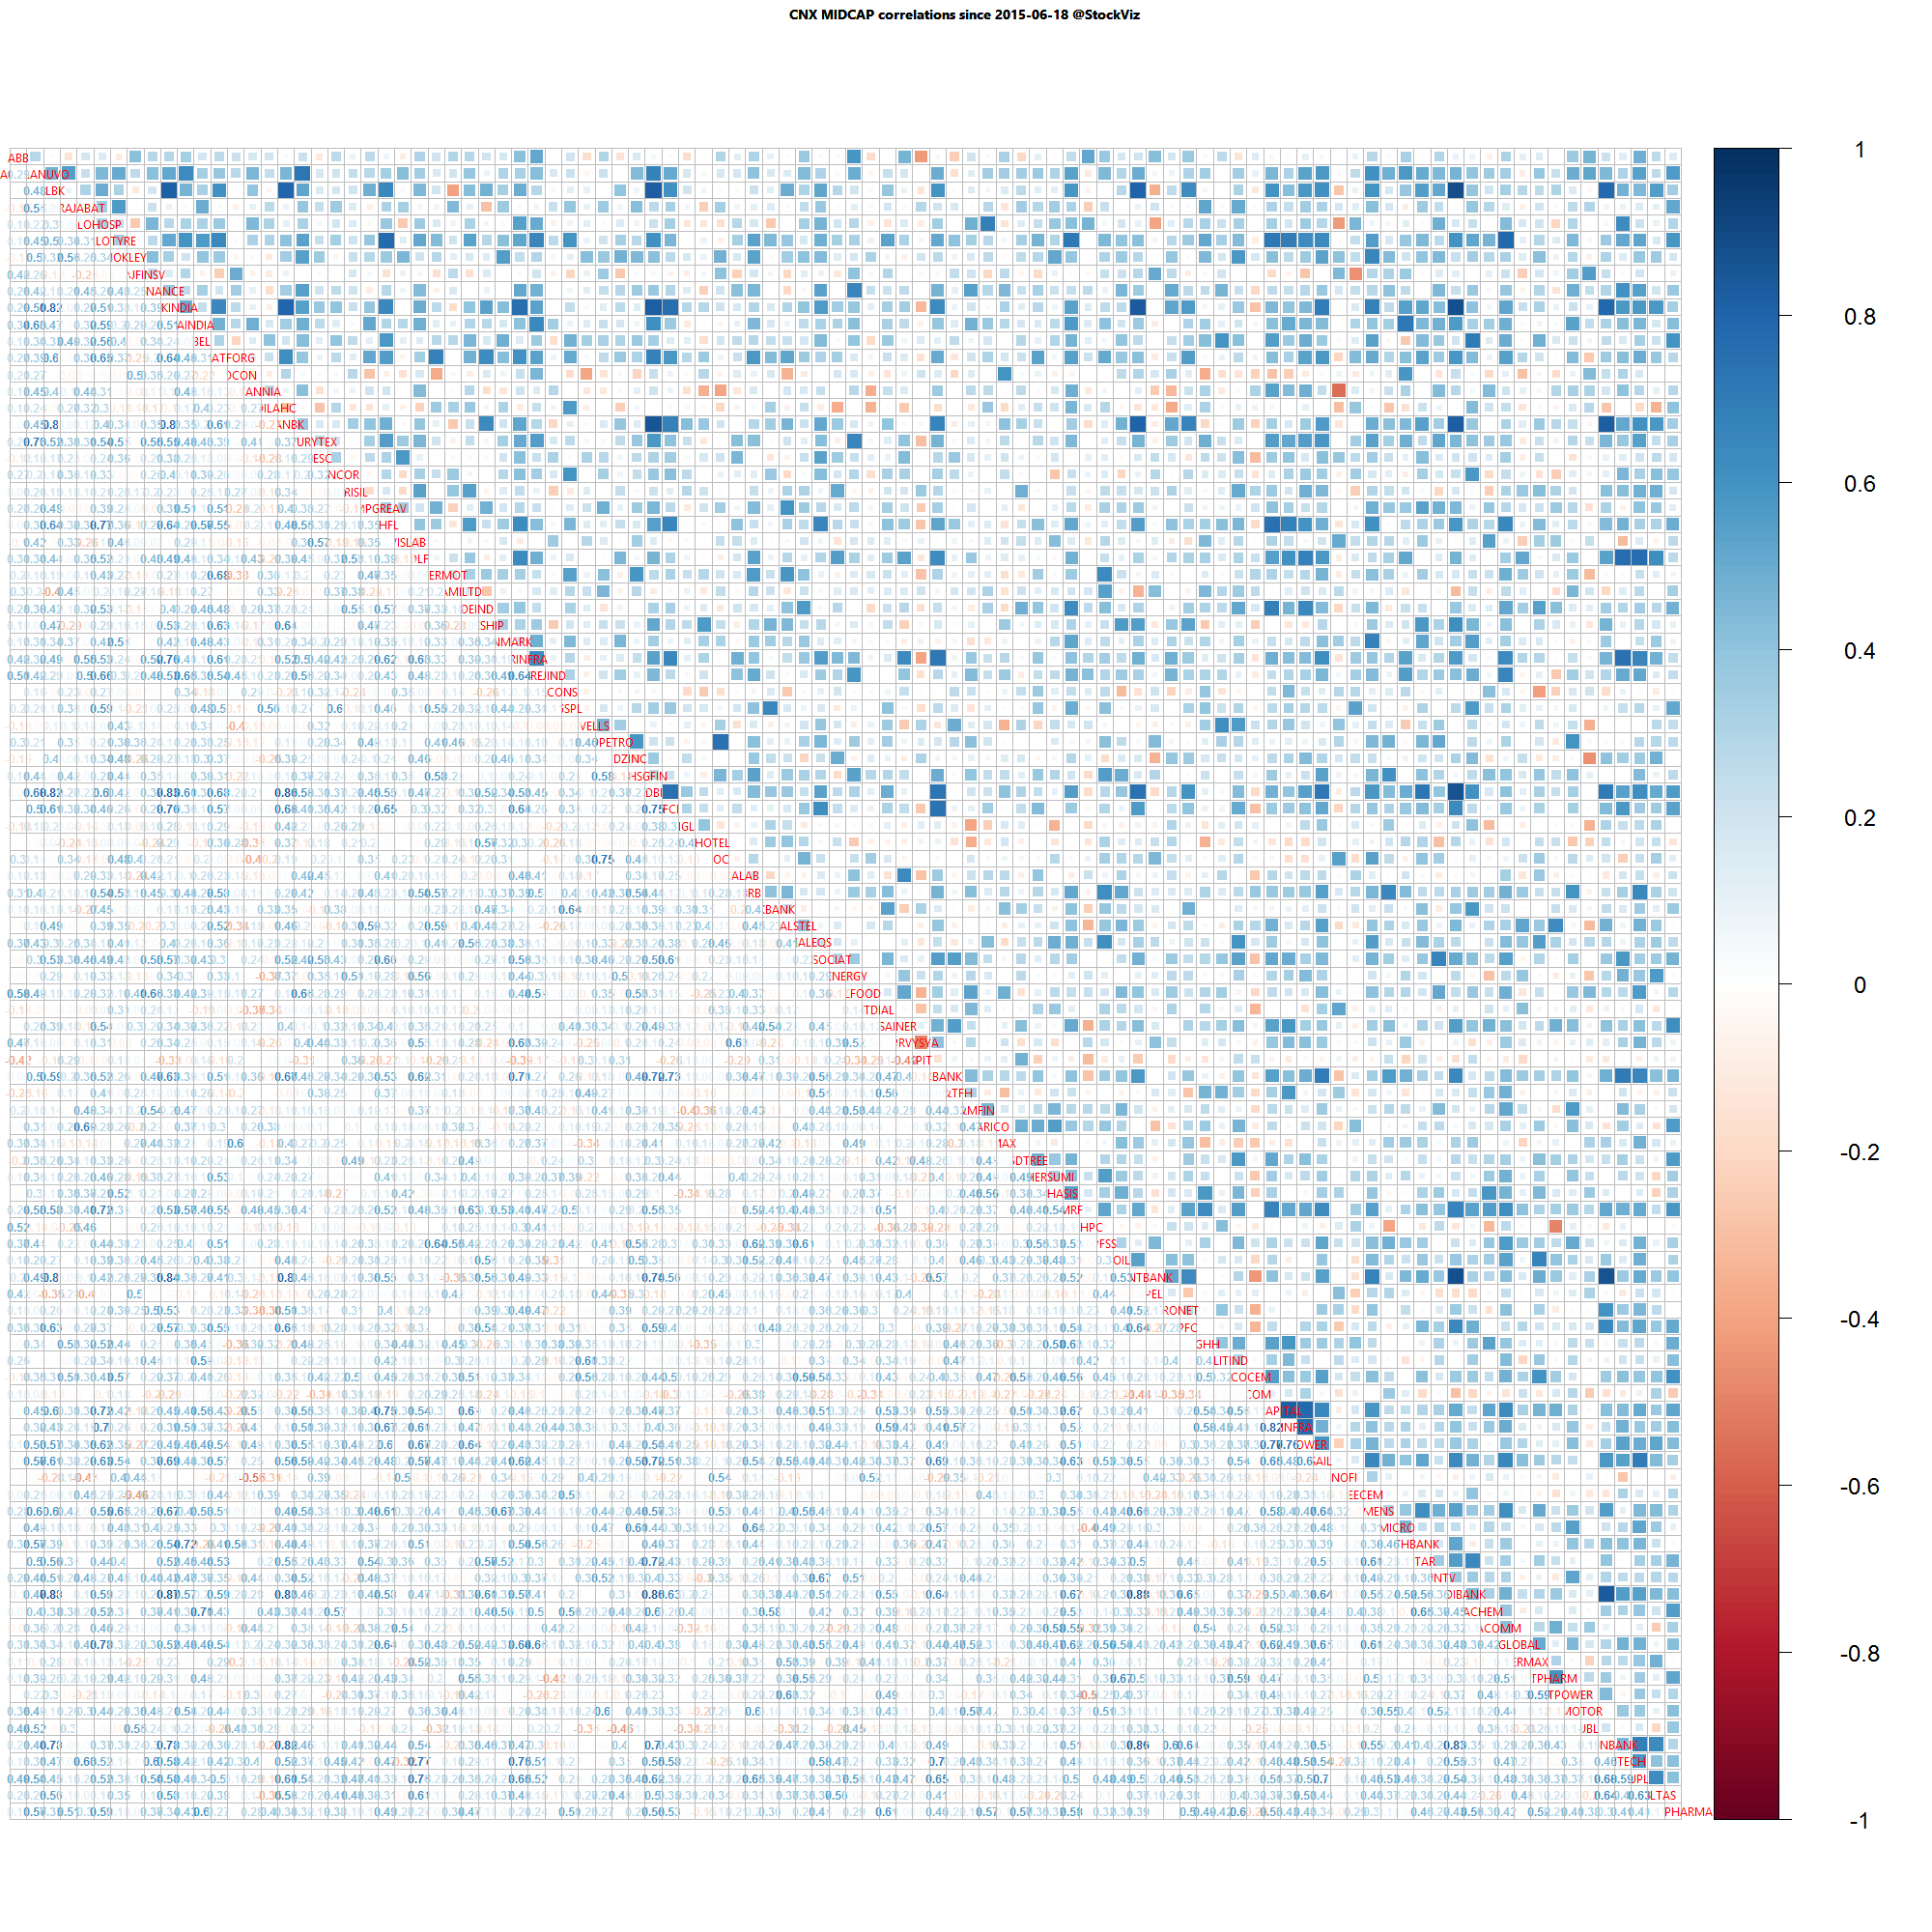
Large caps bled but midcaps seemed to buck the trend…
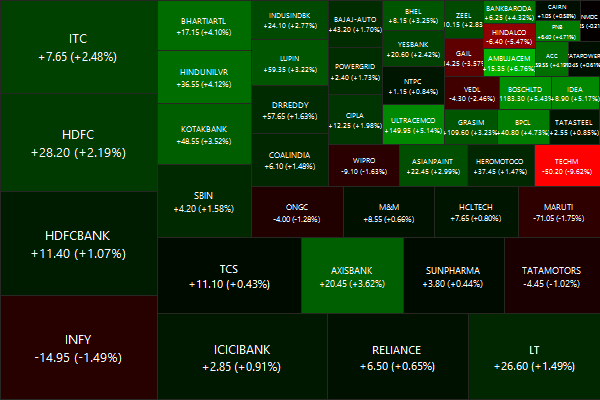
Top Winners and Losers
Tata Motors got pummelled by China worries.
ETF Performance
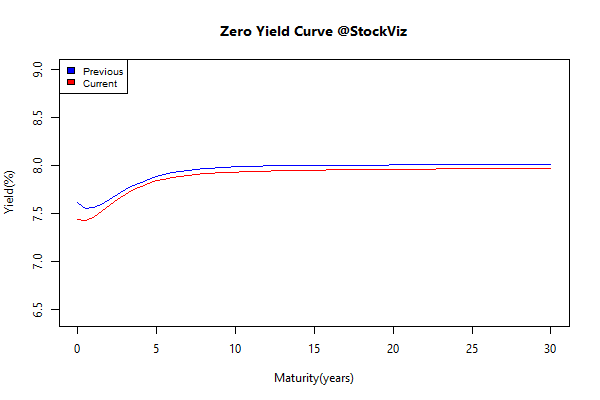
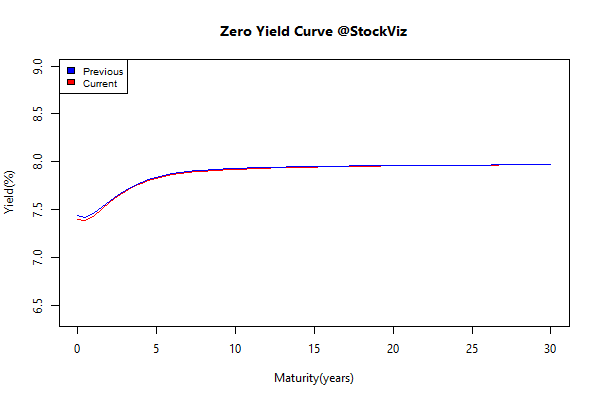
Yield Curve
Thought for the weekend
The absence of free markets leads to competition for the market, which leads to competition for political office, which leads to the corruption of politics. That’s the basic story of crony capitalism — a side-effect of socialism.
Source: Socialism, Competition and Politicians