Tag: weekly

Weekly Recap: Discipline > Motivation

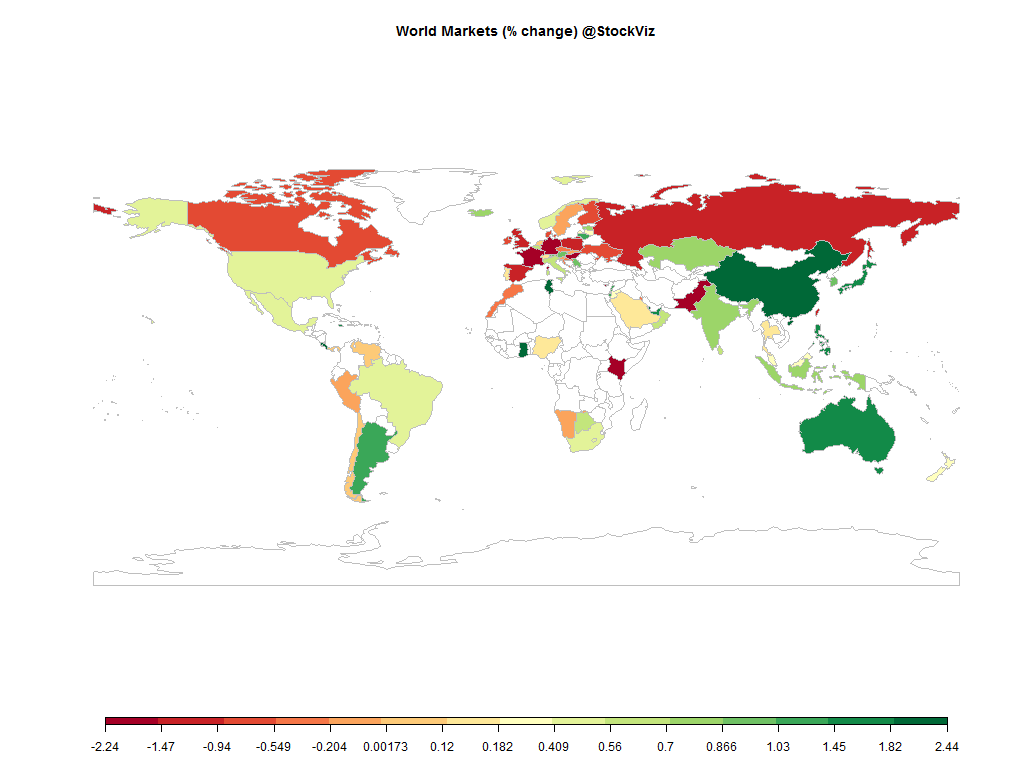
world.2015-05-08.2015-05-15

Equities

Major
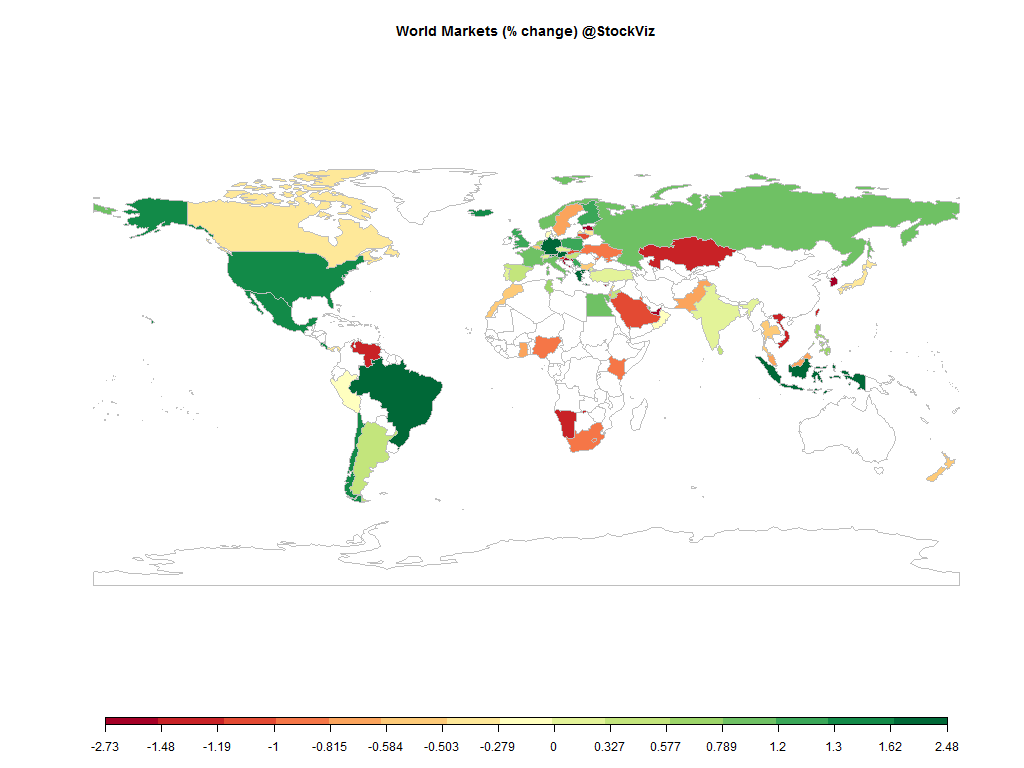
DAX(DEU) -2.24%
CAC(FRA) -1.90%
UKX(GBR) -1.23%
NKY(JPN) +1.83%
SPX(USA) +0.43%
MINTs
JCI(IDN) +0.87%
INMEX(MEX) +0.56%
NGSEINDX(NGA) +0.15%
XU030(TUR) +4.55%
BRICS
IBOV(BRA) +0.50%
SHCOMP(CHN) +2.44%
NIFTY(IND) +0.86%
INDEXCF(RUS) -1.00%
TOP40(ZAF) +0.46%

Commodities

Energy
Heating Oil +2.84%
Natural Gas +5.05%
Brent Crude Oil +2.55%
Ethanol +1.51%
RBOB Gasoline +3.42%
WTI Crude Oil +1.20%
Metals
Palladium -0.93%
Platinum +2.16%
Copper +0.68%
Gold 100oz +3.18%
Silver 5000oz +6.71%

Currencies

USDEUR:-2.16% USDJPY:-0.45%

MINTs
USDIDR(IDN) -0.28%
USDMXN(MEX) -0.89%
USDNGN(NGA) -0.82%
USDTRY(TUR) -4.46%
BRICS
USDBRL(BRA) +0.33%
USDCNY(CHN) -0.05%
USDINR(IND) -0.66%
USDRUB(RUS) -2.79%
USDZAR(ZAF) -1.12%
Agricultural
Feeder Cattle +1.40%
Lumber +1.75%
Soybean Meal -3.65%
Soybeans -3.18%
Sugar #11 -3.45%
Cattle +0.69%
Cocoa +4.19%
Coffee (Arabica) +4.51%
Coffee (Robusta) -0.82%
Corn +1.74%
Cotton +0.77%
Wheat +9.13%
White Sugar -3.70%
Lean Hogs +2.88%
Orange Juice -1.46%

Credit Indices

Index Change
Markit CDX EM +0.26%
Markit CDX NA HY +0.04%
Markit CDX NA IG -0.31%
Markit iTraxx Asia ex-Japan IG -1.75%
Markit iTraxx Australia -1.61%
Markit iTraxx Europe -0.96%
Markit iTraxx Europe Crossover +2.25%
Markit iTraxx Japan -1.42%
Markit iTraxx SovX Western Europe -0.36%
Markit LCDX (Loan CDS) -0.05%
Markit MCDX (Municipal CDS) +2.36%
The S&P 500 made new highs – probably because rate hikes are now getting pushed back to 2016 given the sorry state of the US economy.

However, bond yields elsewhere surged higher on increasing optimism about the prospects for global economic growth. And yields may keep climbing as easy foreign central bank policies raise expectations for growth and inflation. (Schwab)

Expect more volatility ahead.

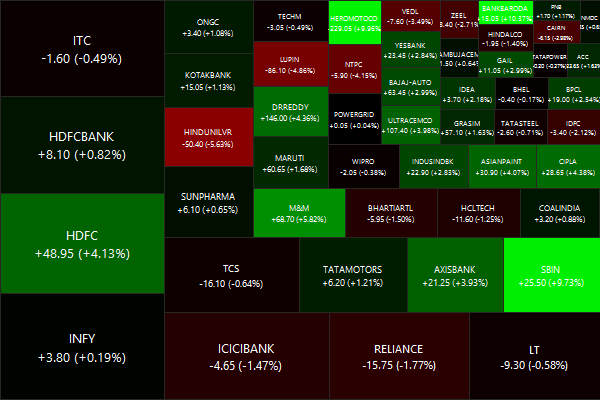
Nifty Heatmap

CNX NIFTY.2015-05-08.2015-05-15

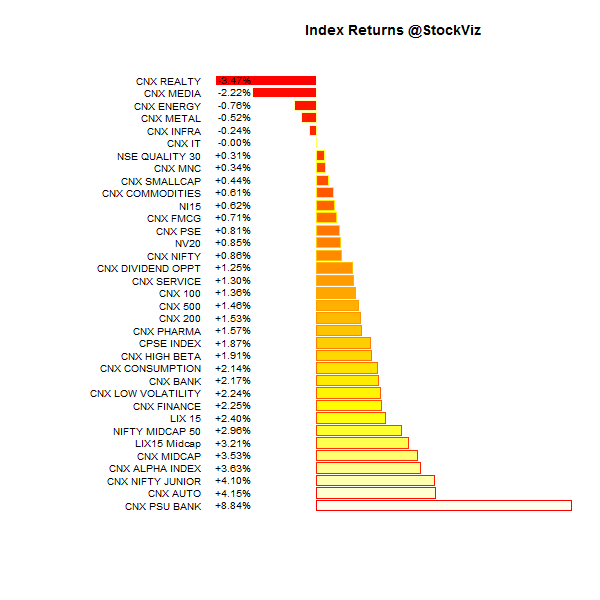
Index Returns

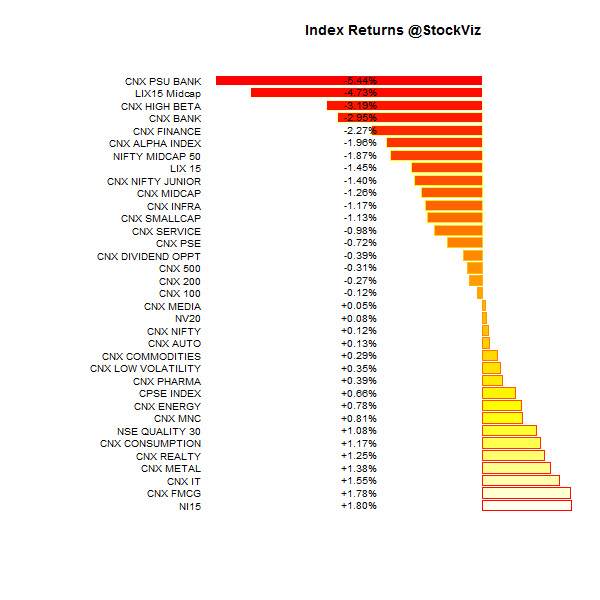
For a deeper dive into indices, check out our weekly Index Update.
index performance.2015-05-08.2015-05-15

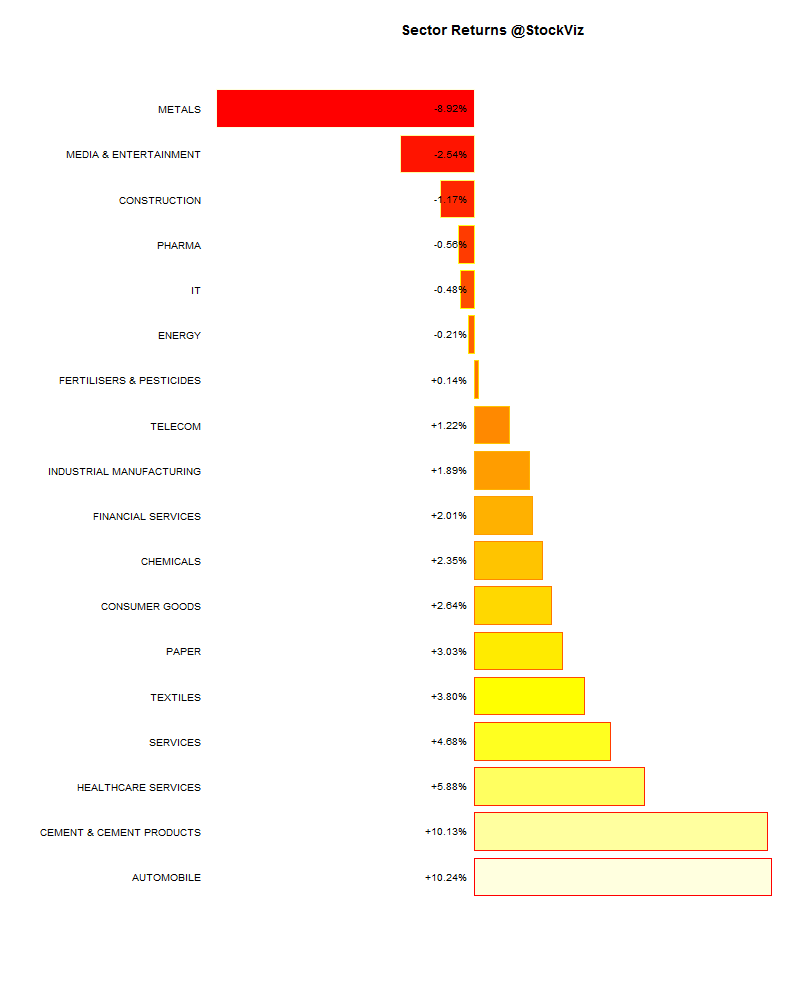
Sector Performance

sector performance.2015-05-08.2015-05-15

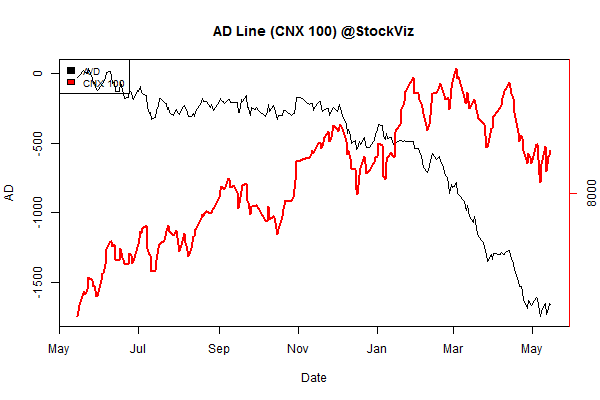
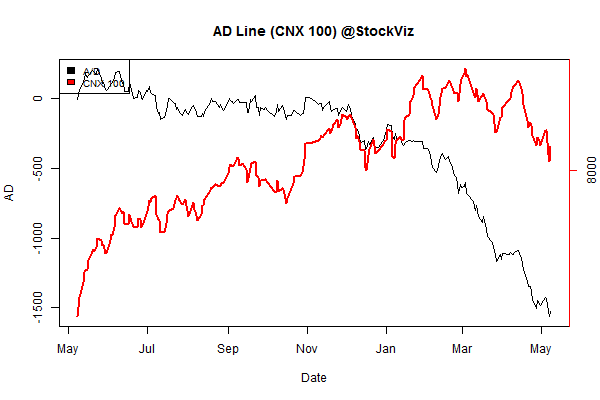
Advance Decline

advance.decline.line2.2015-05-08.2015-05-15

Market Cap Decile Performance

Decile Mkt. Cap. Adv/Decl
1 (micro) -3.11% 63/63
2 +2.40% 64/65
3 +3.08% 63/64
4 +3.44% 67/61
5 +4.35% 71/56
6 +3.88% 74/54
7 +2.57% 65/63
8 +2.44% 68/59
9 +3.13% 65/63
10 (mega) +3.67% 65/63
Green across the board. Hopefully this marks a turning point in the markets…

Top Winners and Losers

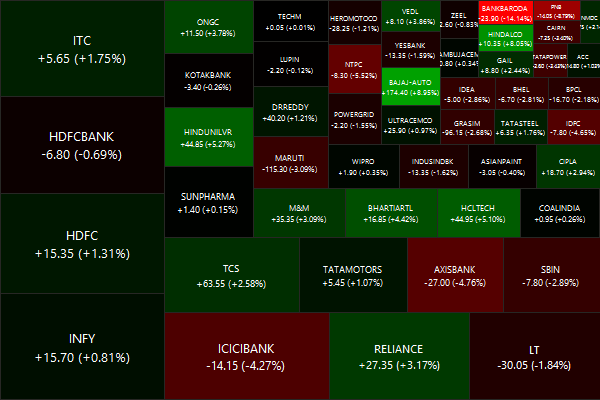
MCDOWELL-N +11.86%
EICHERMOT +18.64%
UNIONBANK +23.06%
HINDUNILVR -5.63%
LUPIN -4.86%
NTPC -4.15%
Eicher Motor reminded investors that it still had a whole clip of silver bullets left…

ETF Performance

PSUBNKBEES +7.07%
JUNIORBEES +4.43%
BANKBEES +2.76%
CPSEETF +2.14%
GOLDBEES +1.72%
NIFTYBEES +1.41%
INFRABEES +0.36%
PSU banks staged a surprise snap-back rally after being beaten to a pulp over the last couple of months. Will it sustain?

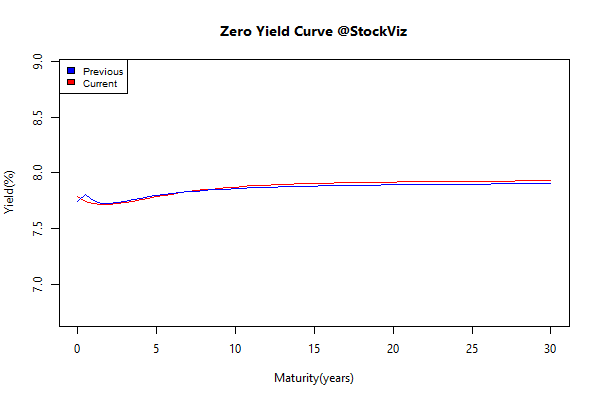
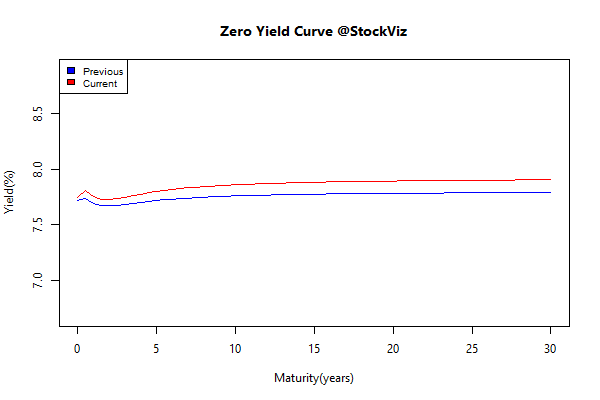
Yield Curve

yieldCurve.2015-05-08.2015-05-15

Bond Indices

Sub Index Change in YTM Total Return(%)
GSEC TB +1.23 -0.22%
GSEC SUB 1-3 +1.04 -1.65%
GSEC SUB 3-8 +0.61 -2.63%
GSEC SUB 8 +0.42 -3.37%
Indian bonds sold off, following the bond carnage in Europe…

Investment Theme Performance

Equity Mutual Funds

Bond Mutual Funds

Thought for the weekend

Motivation, broadly speaking, operates on the erroneous assumption that a particular mental or emotional state is necessary to complete a task.

Discipline, by contrast, separates outwards functioning from moods and feelings and thereby ironically circumvents the problem by consistently improving them.

You don’t wait until you’re in olympic form to start training. You train to get into olympic form.
Source: Screw motivation, what you need is discipline.

Index Update 16.05.2015

MOMENTUM

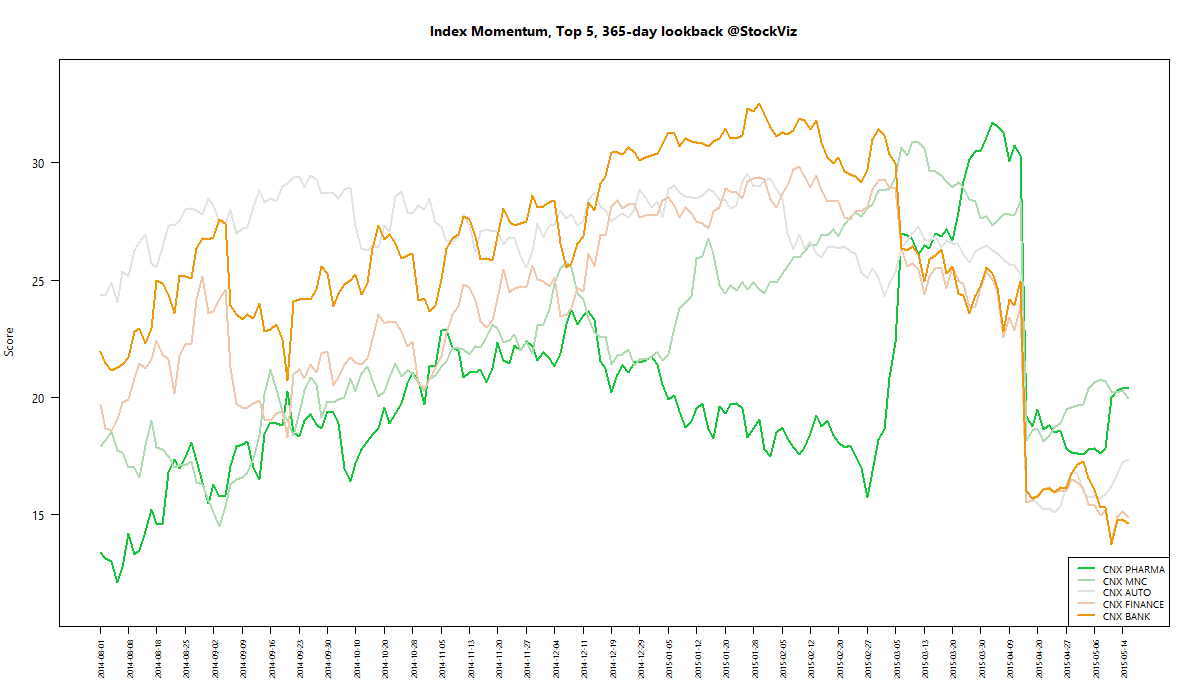
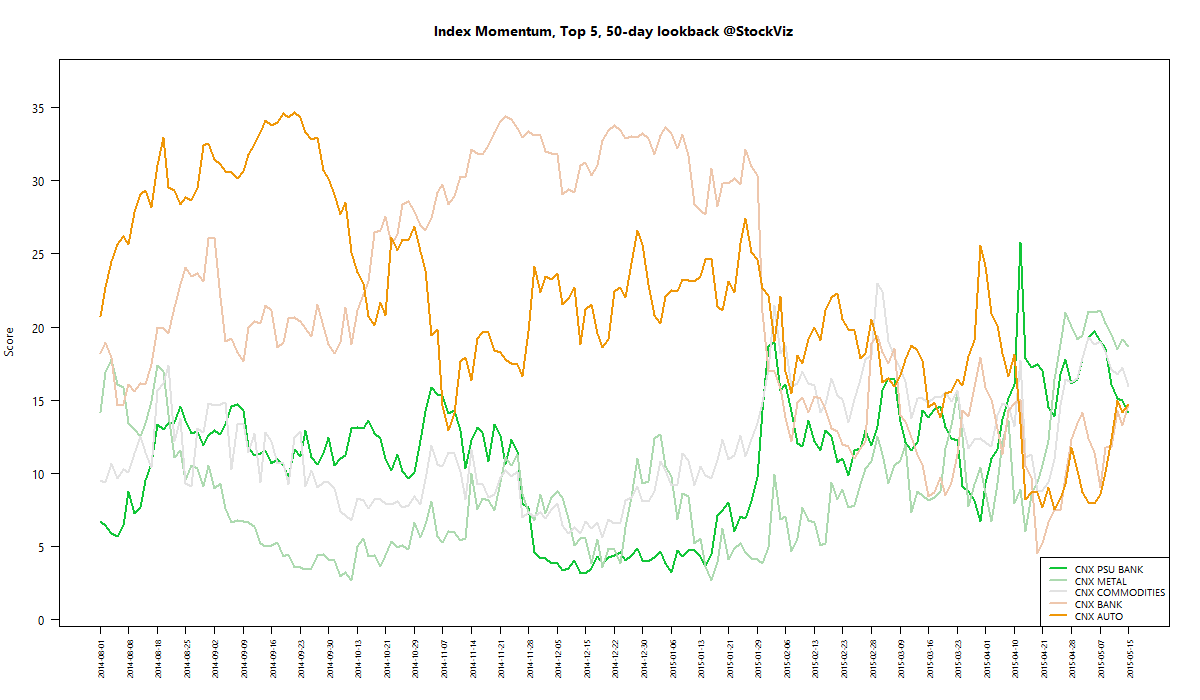
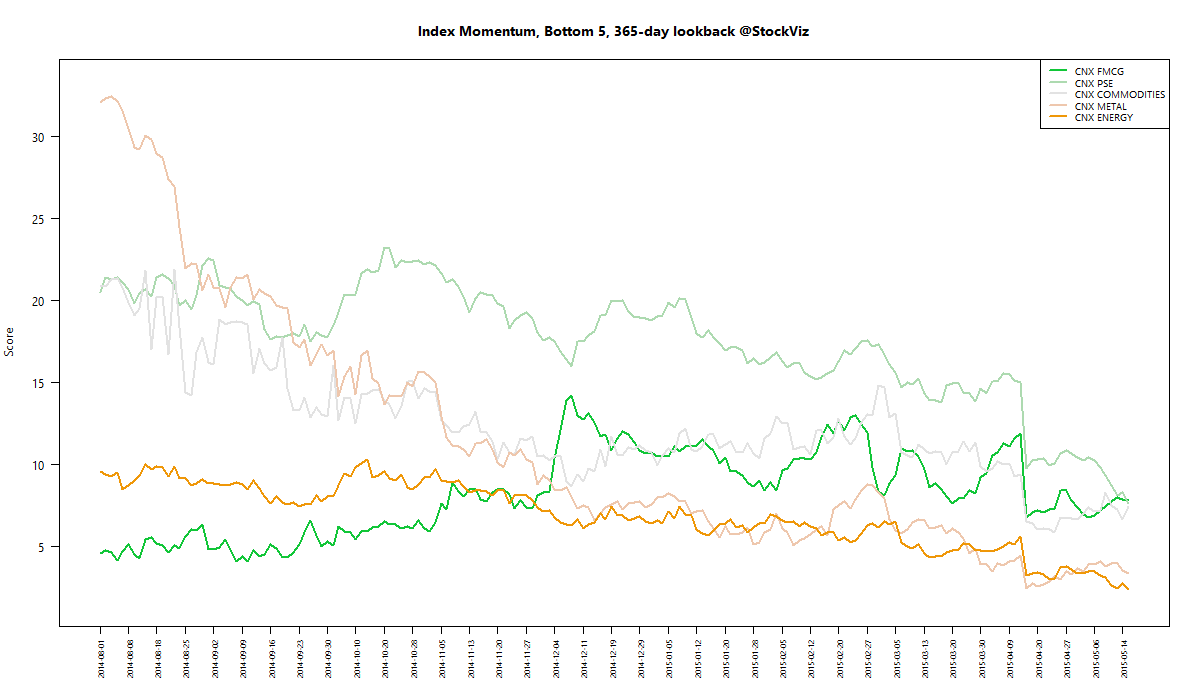
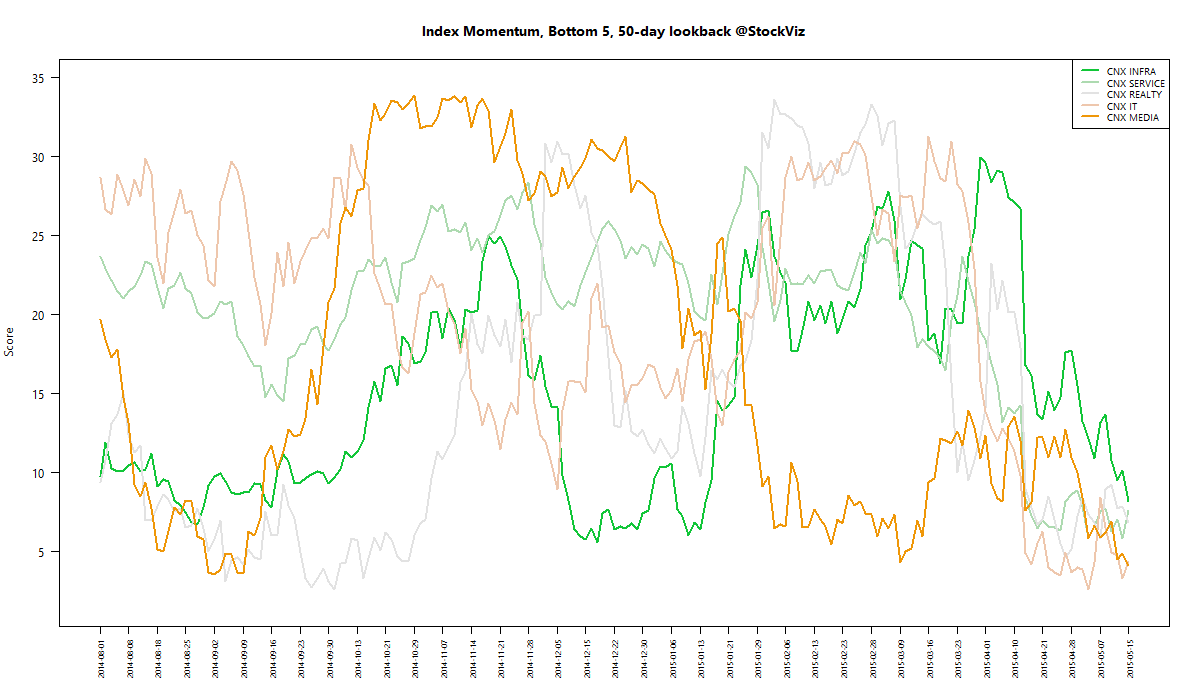
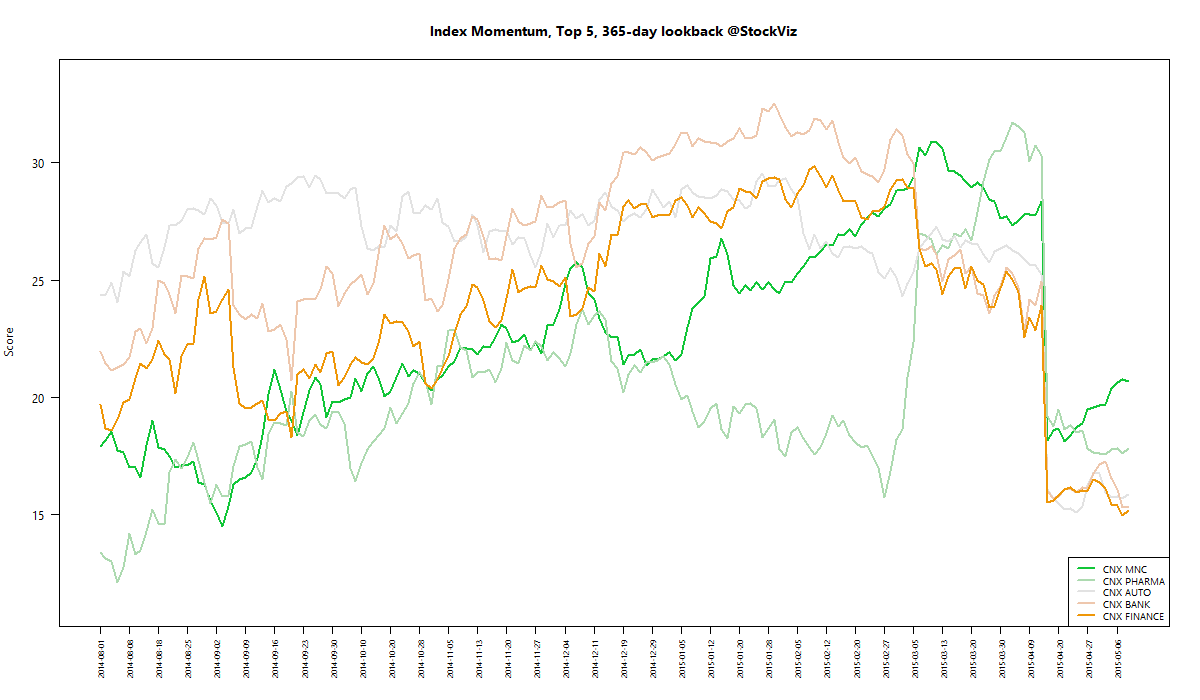
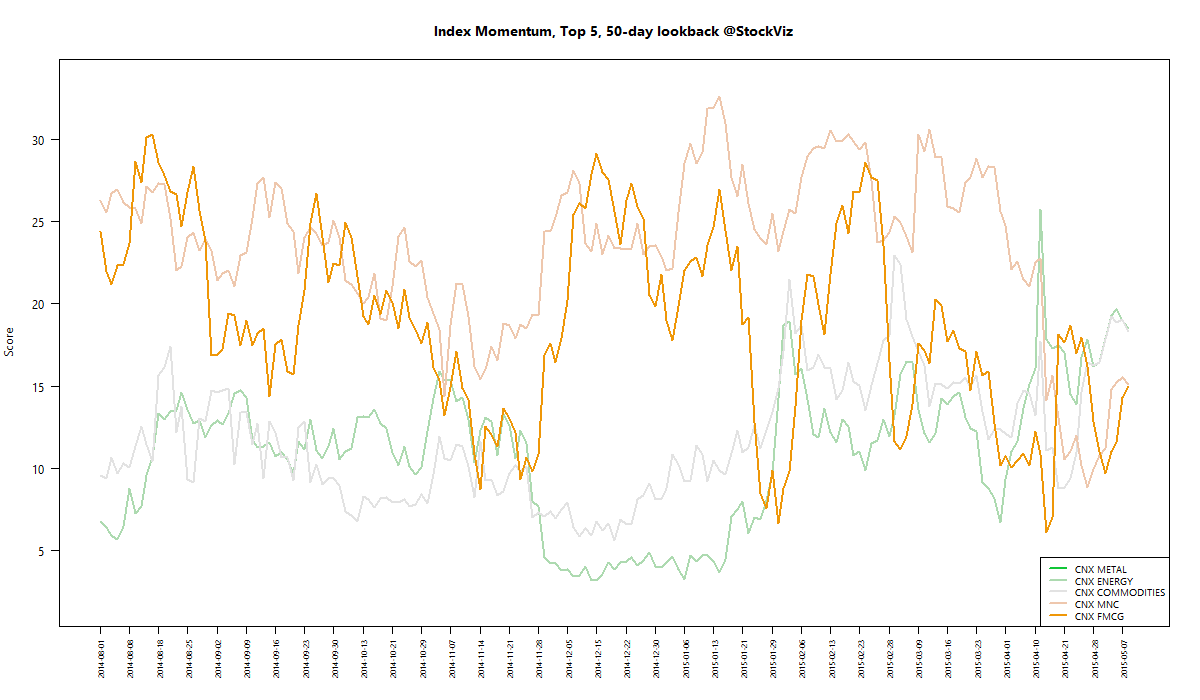
We run our proprietary momentum scoring algorithm on indices just like we do on stocks. You can use the momentum scores of sub-indices to get a sense for which sectors have the wind on their backs and those that are facing headwinds.

Traders can pick their longs in sectors with high short-term momentum and their shorts in sectors with low momentum. Investors can use the longer lookback scores to position themselves using our re-factored index Themes.

You can see how the momentum algorithm has performed on individual stocks here.

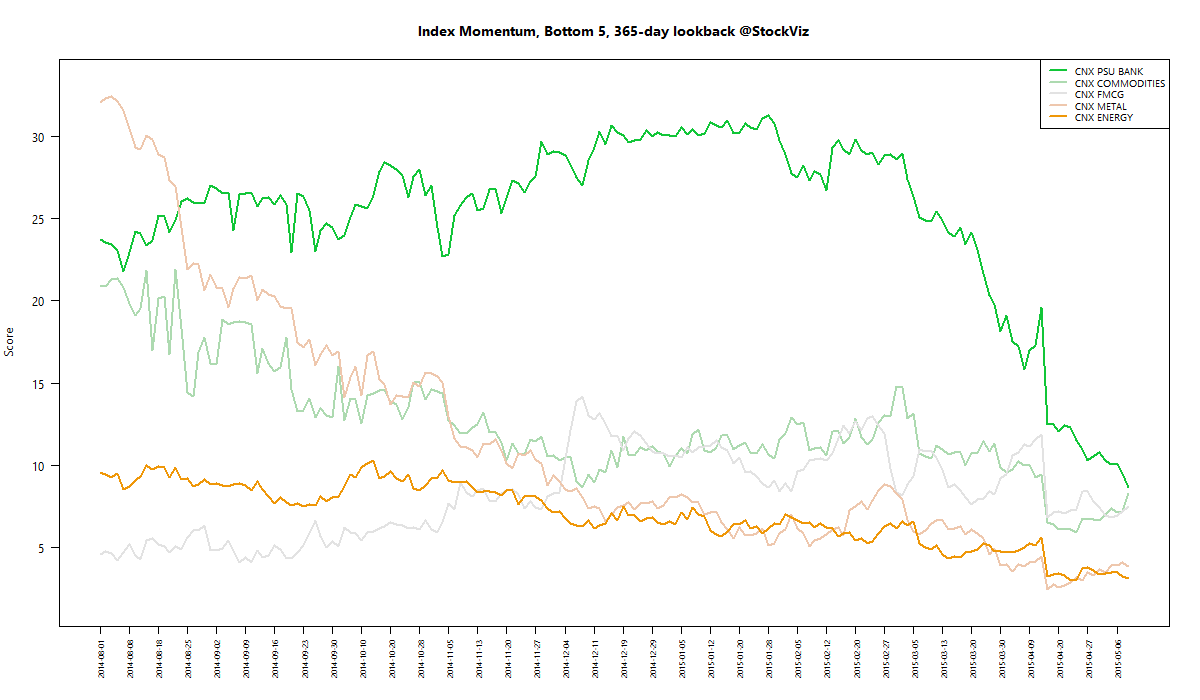
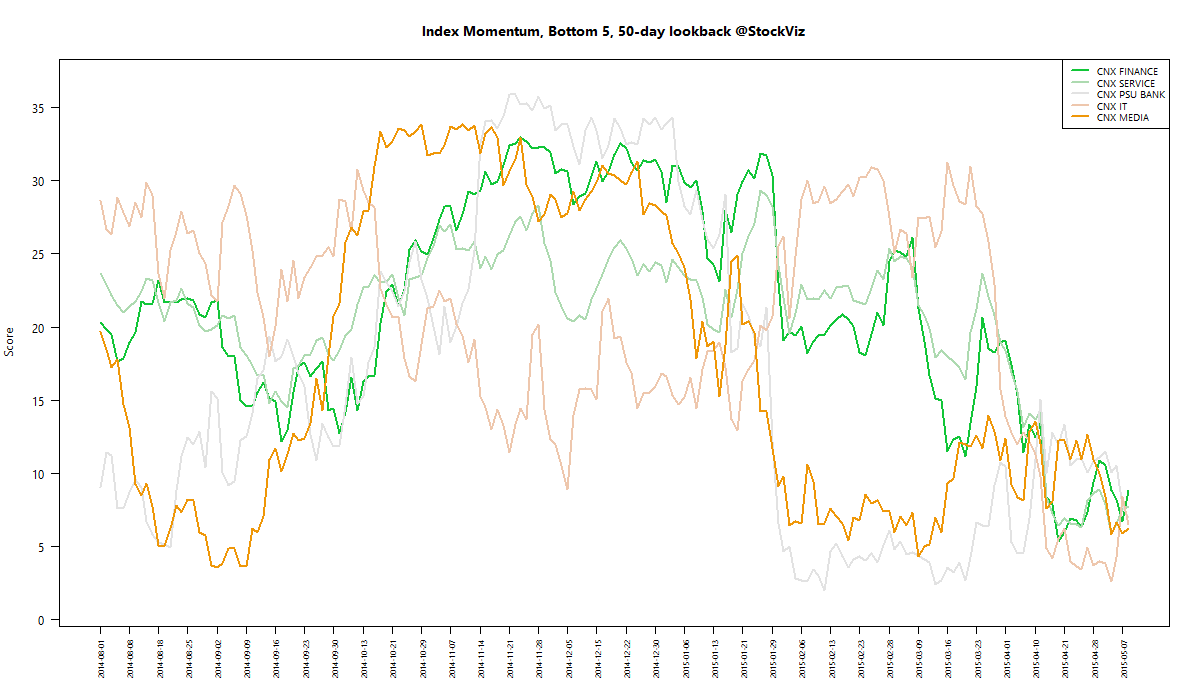
Here are the best and the worst sub-indices:

index momentum best 365 2015-05-15 png

index momentum best 50 2015-05-15 png

index momentum worst 365 2015-05-15 png

index momentum worst 50 2015-05-15 png

Refactored Index Performance

50-day performance, from March 02, 2015 through May 15, 2015:

Trend Model Summary

Index Signal % From Peak Day of Peak
CNX AUTO SHORT
6.15
2015-Jan-27
CNX BANK SHORT
11.54
2015-Jan-27
CNX ENERGY SHORT
30.63
2008-Jan-14
CNX FMCG SHORT
10.31
2015-Feb-25
CNX INFRA SHORT
50.32
2008-Jan-09
CNX IT SHORT
88.30
2000-Feb-21
CNX MEDIA SHORT
31.75
2008-Jan-04
CNX METAL SHORT
55.90
2008-Jan-04
CNX MNC SHORT
5.04
2015-Mar-12
CNX NIFTY SHORT
8.16
2015-Mar-03
CNX PHARMA SHORT
11.11
2015-Apr-08
CNX PSE SHORT
27.10
2008-Jan-04
CNX REALTY SHORT
89.34
2008-Jan-14
It looks like Autos and Pharma may be green-shooting. A rate cut would help autos and rupee depreciation can act as a tailwind for pharma.

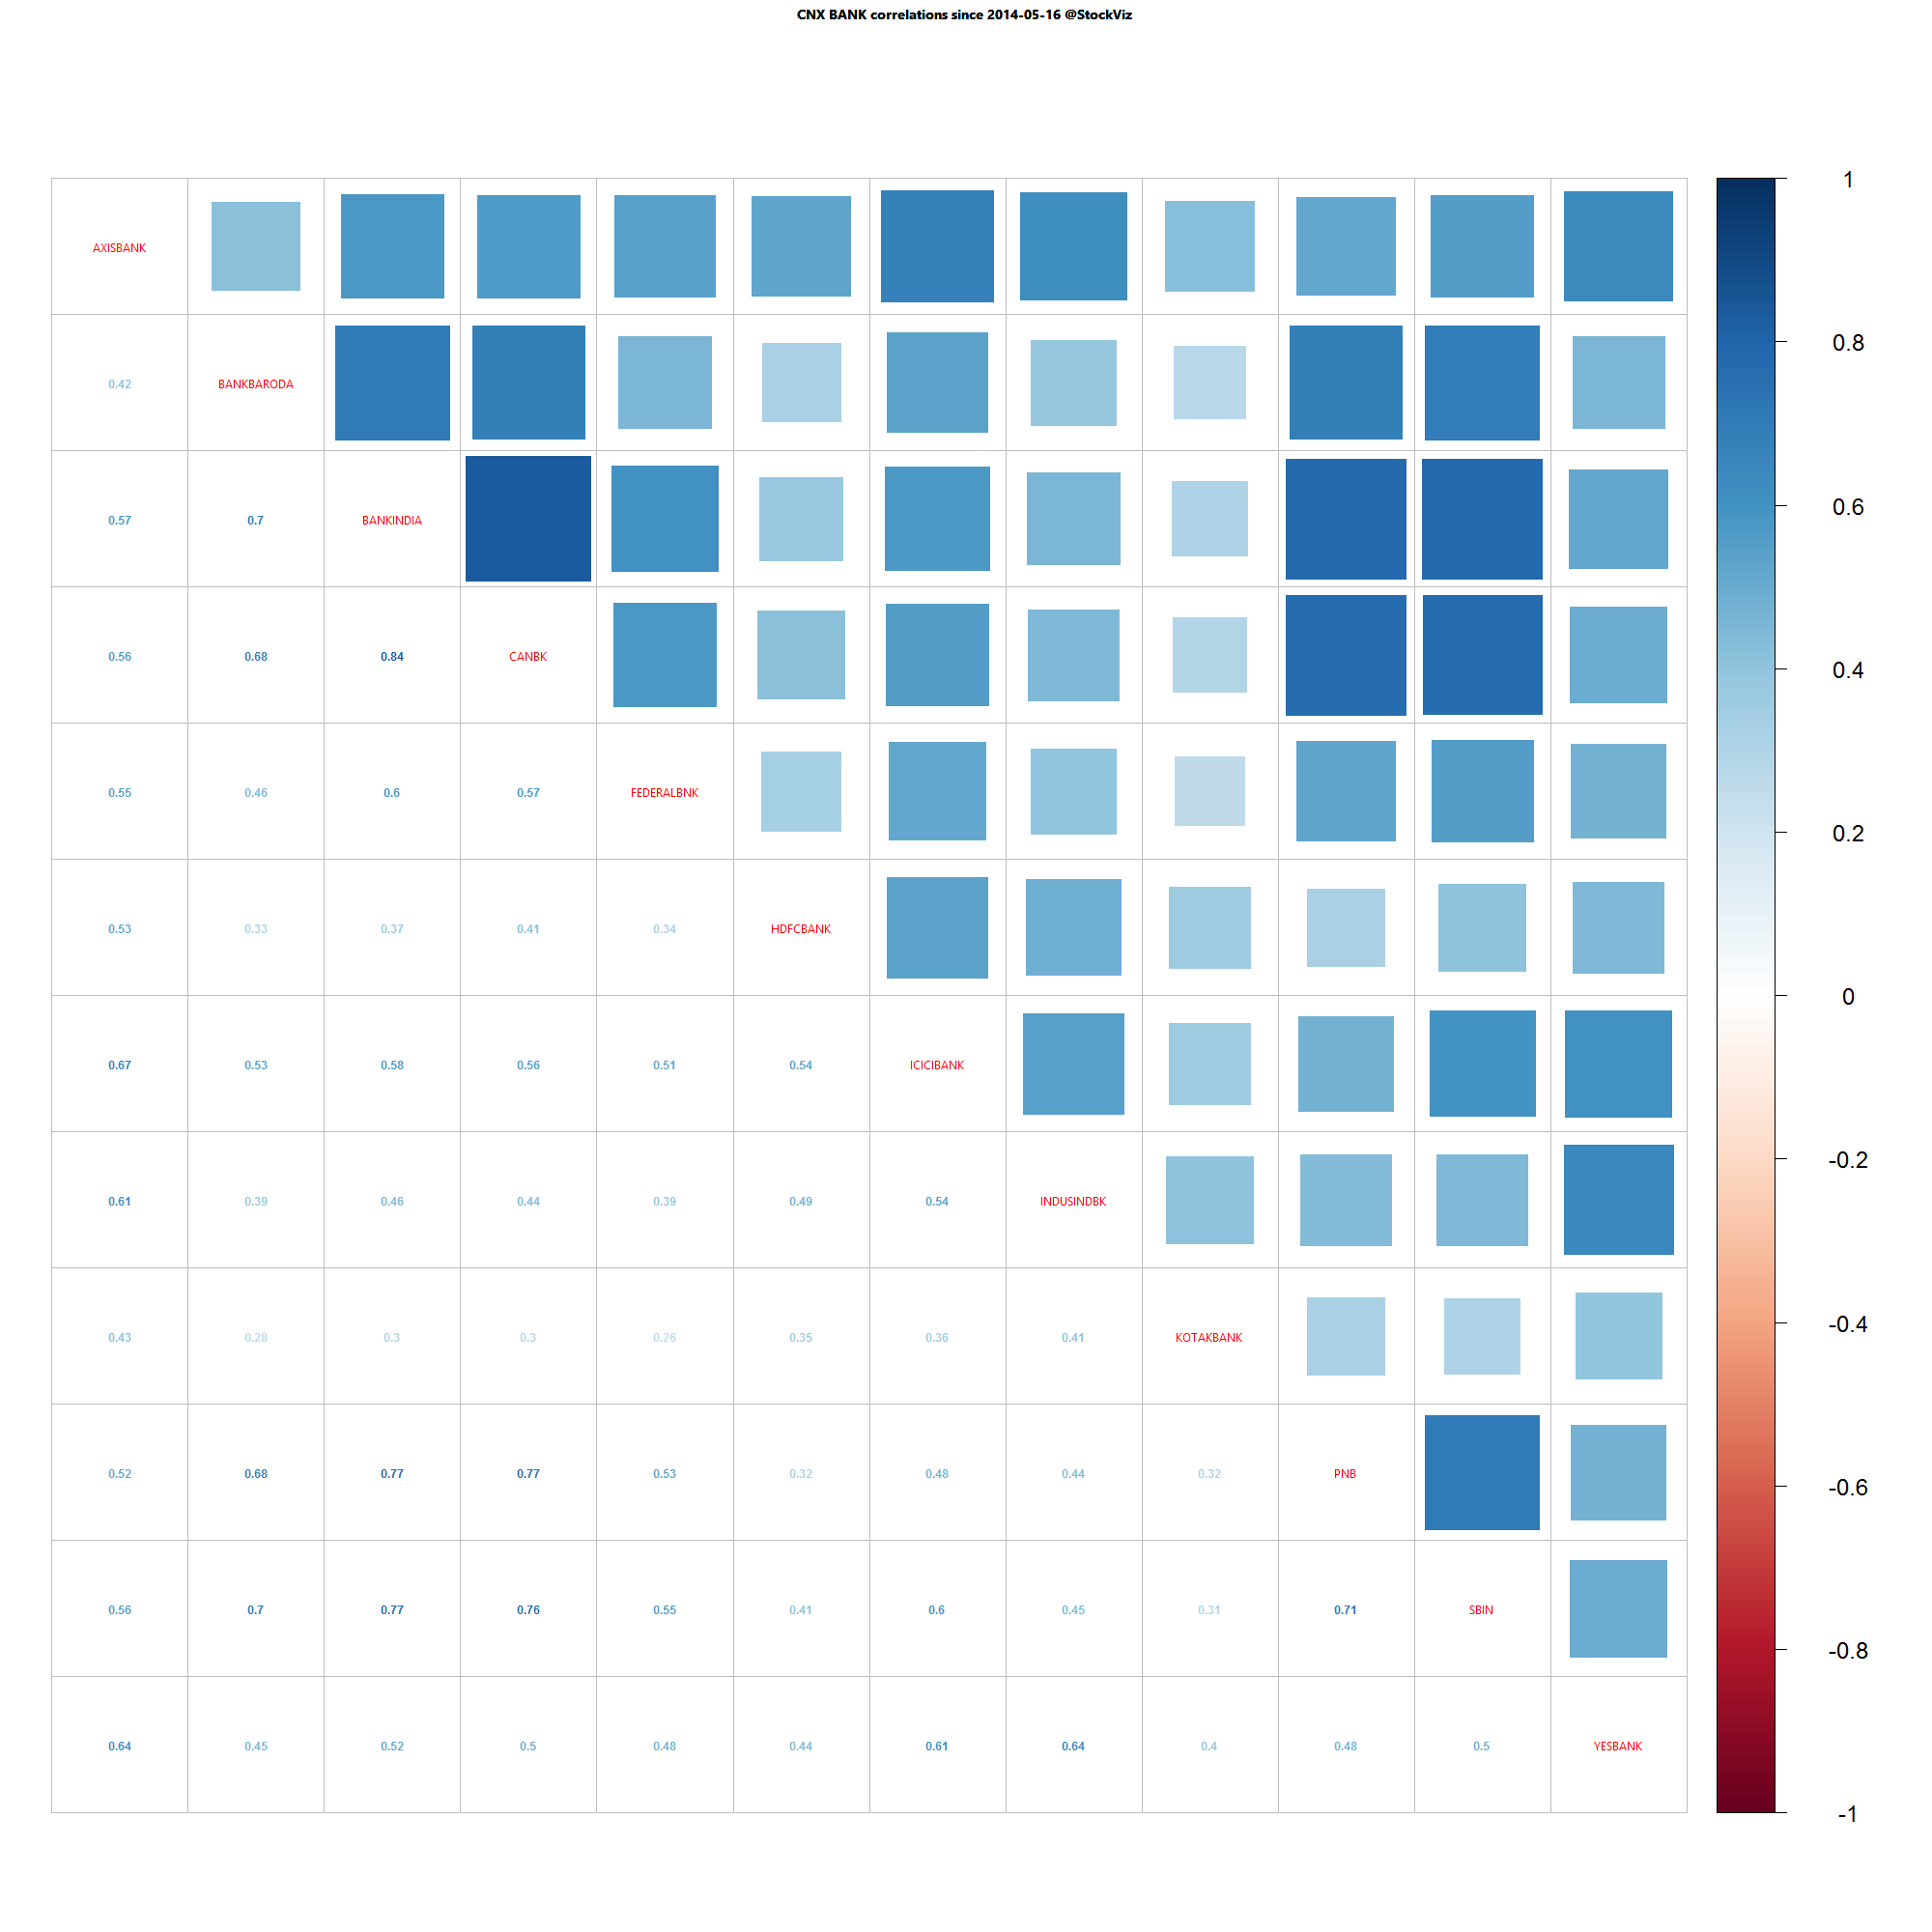
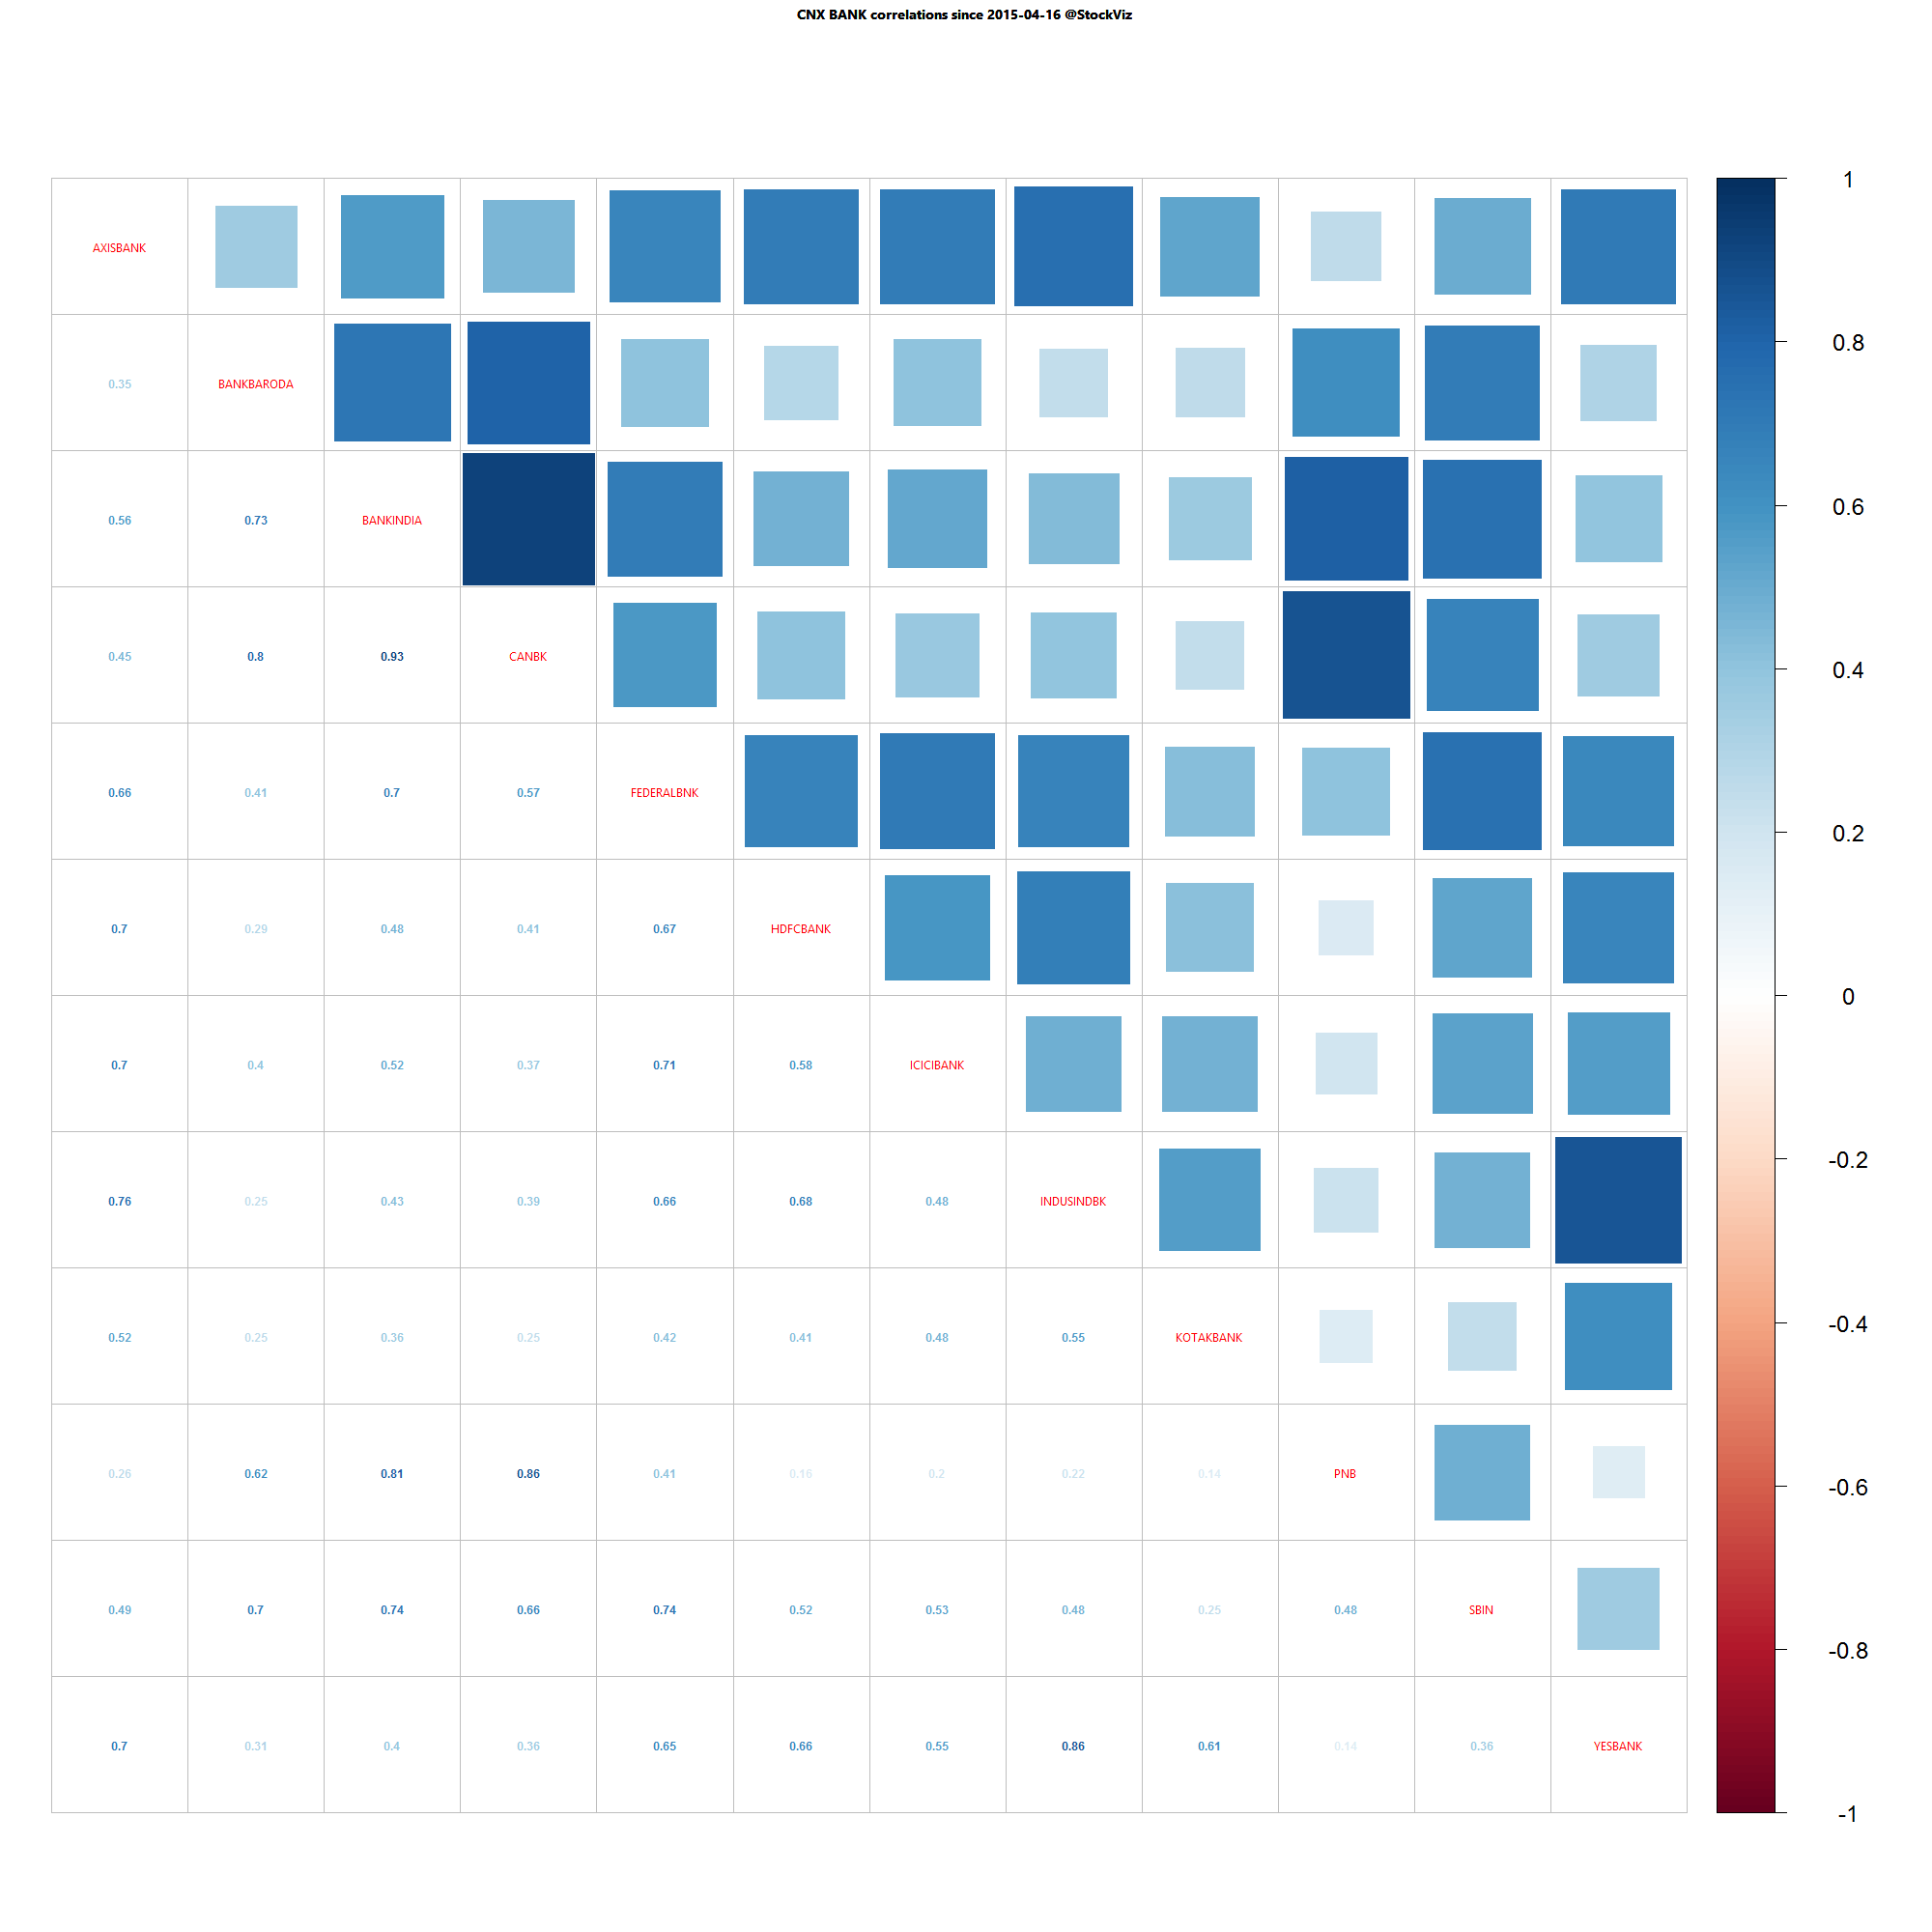
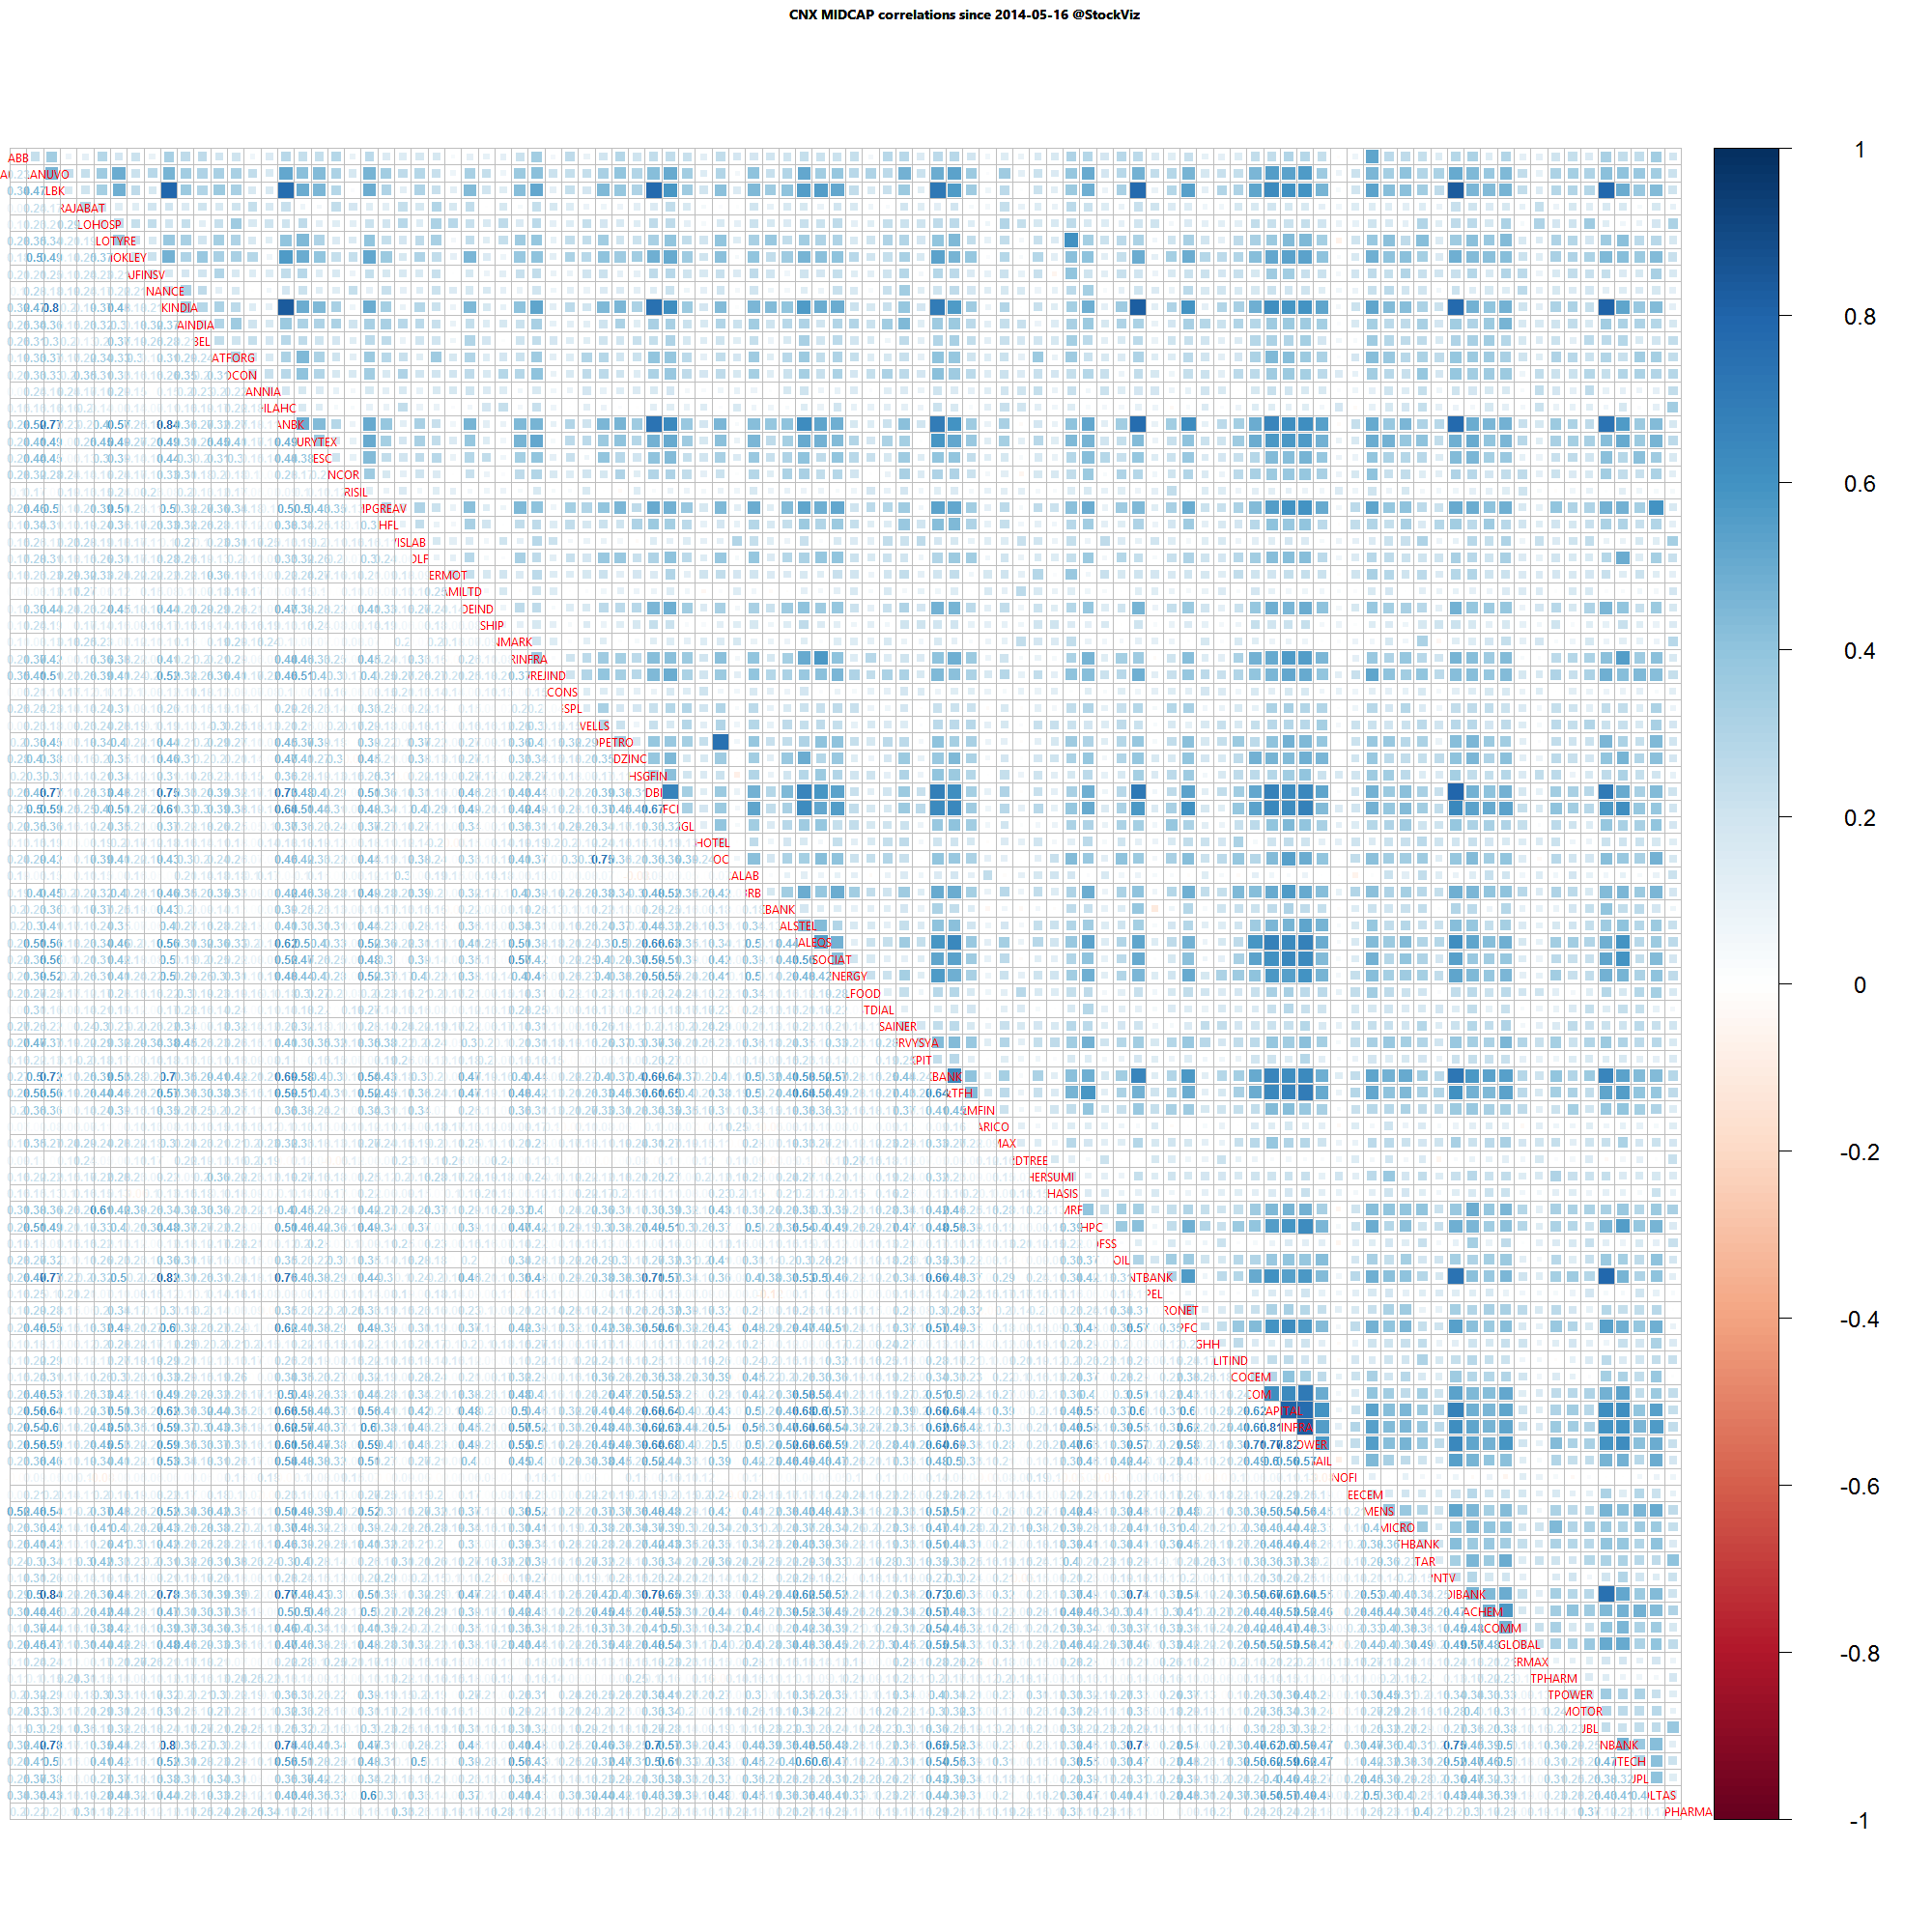
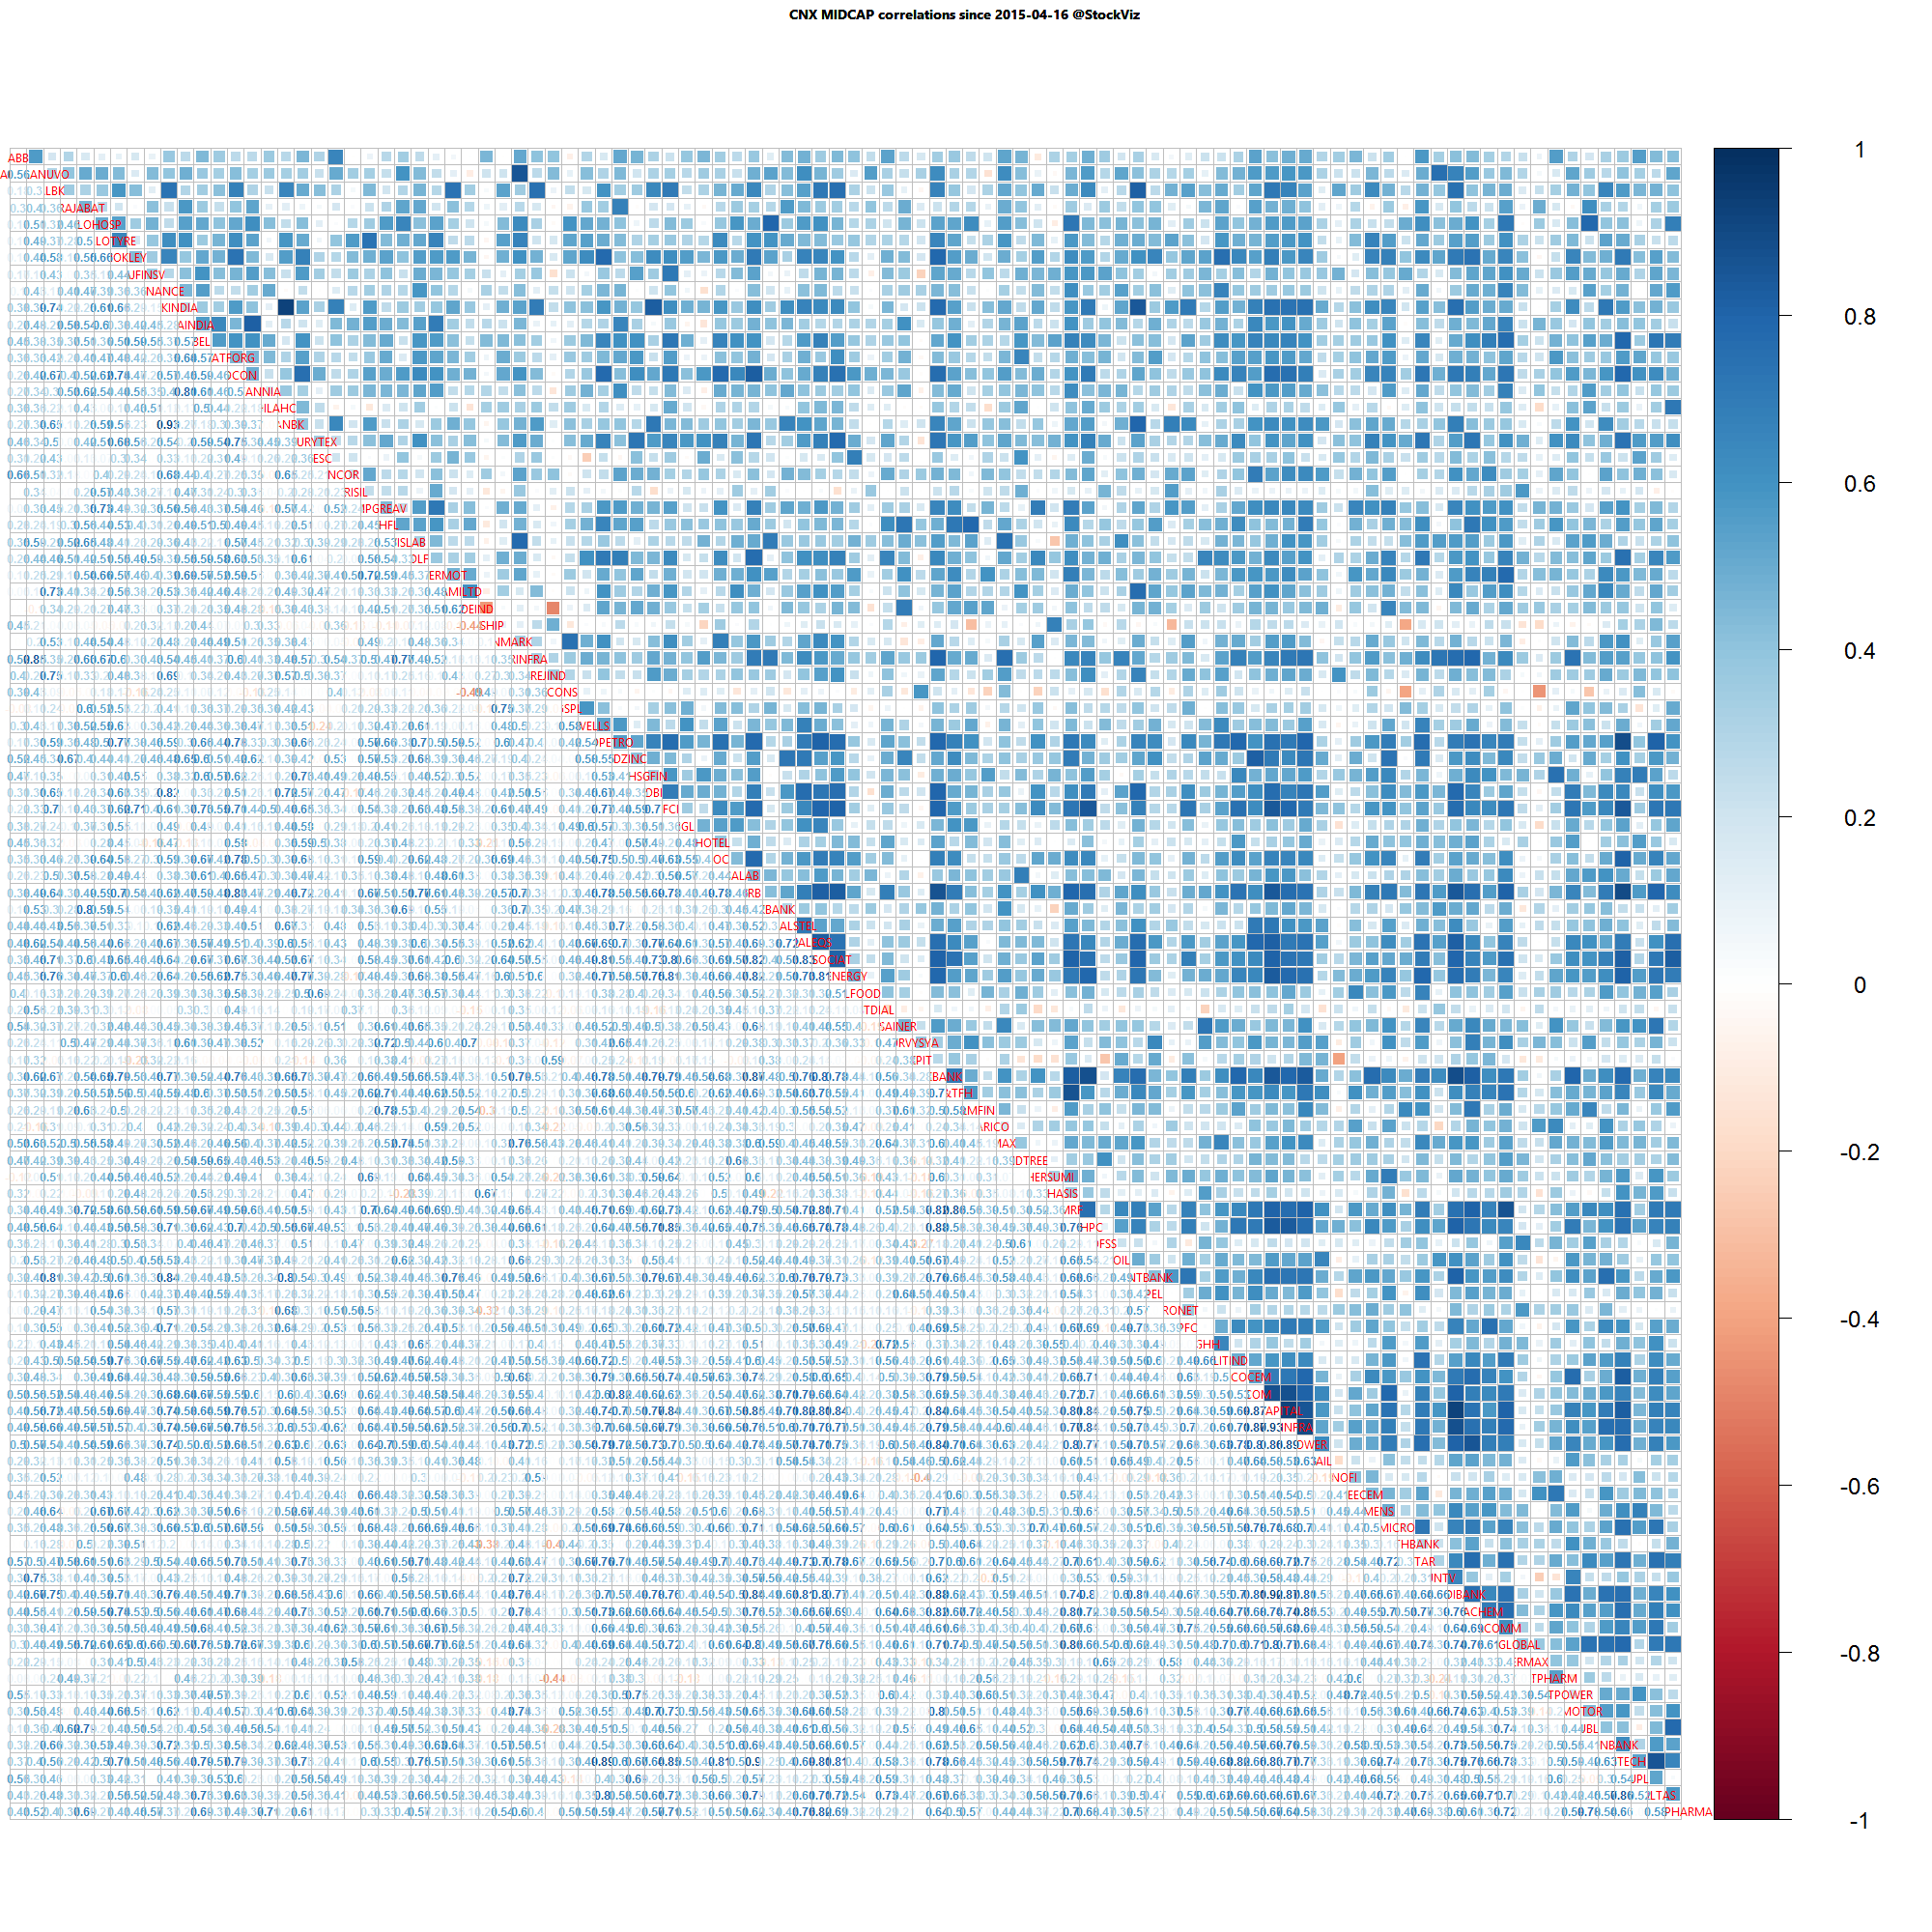
Correlation Update 16.05.2015

Nifty one year daily return correlations

Nifty one year daily return correlations

Nifty one month daily return correlations

Nifty one month daily return correlations

Bank Nifty one year daily return correlations

Bank Nifty one year daily return correlations

Bank Nifty one month daily return correlations

Bank Nifty one month daily return correlations

Midcap one year daily return correlations

Midcap one year daily return correlations

Midcap one month daily return correlations

Midcap one month daily return correlations

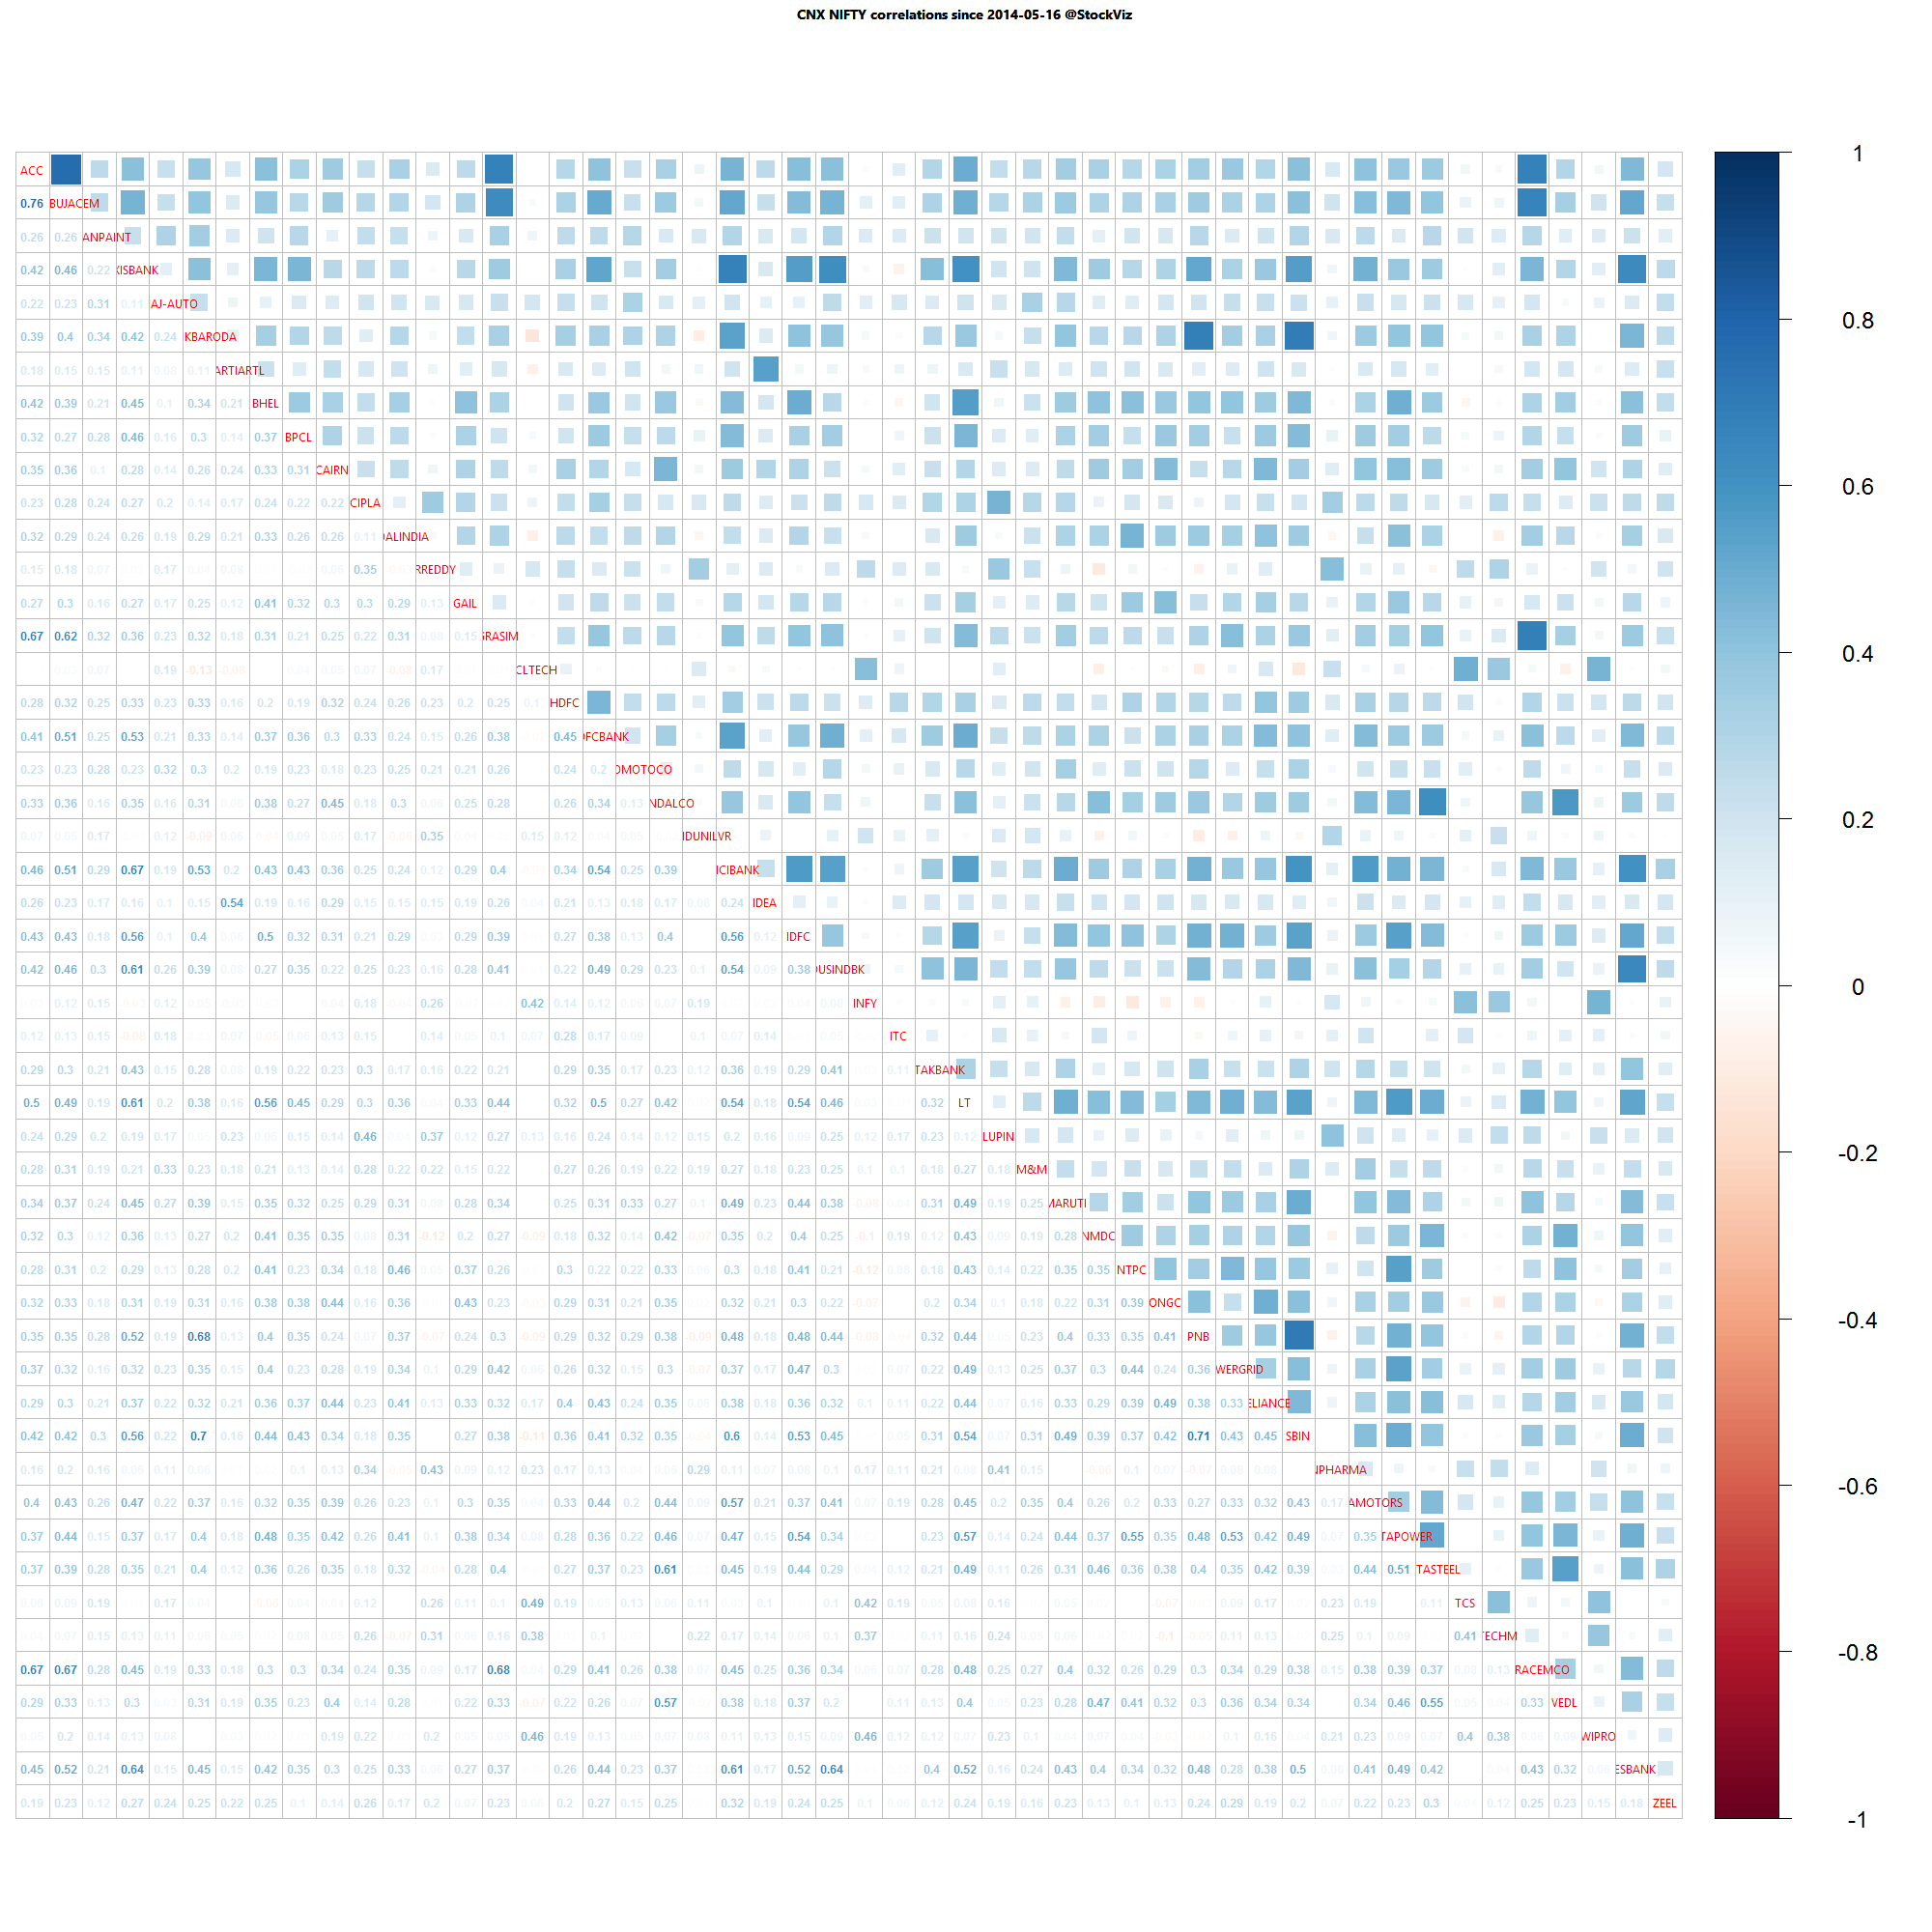
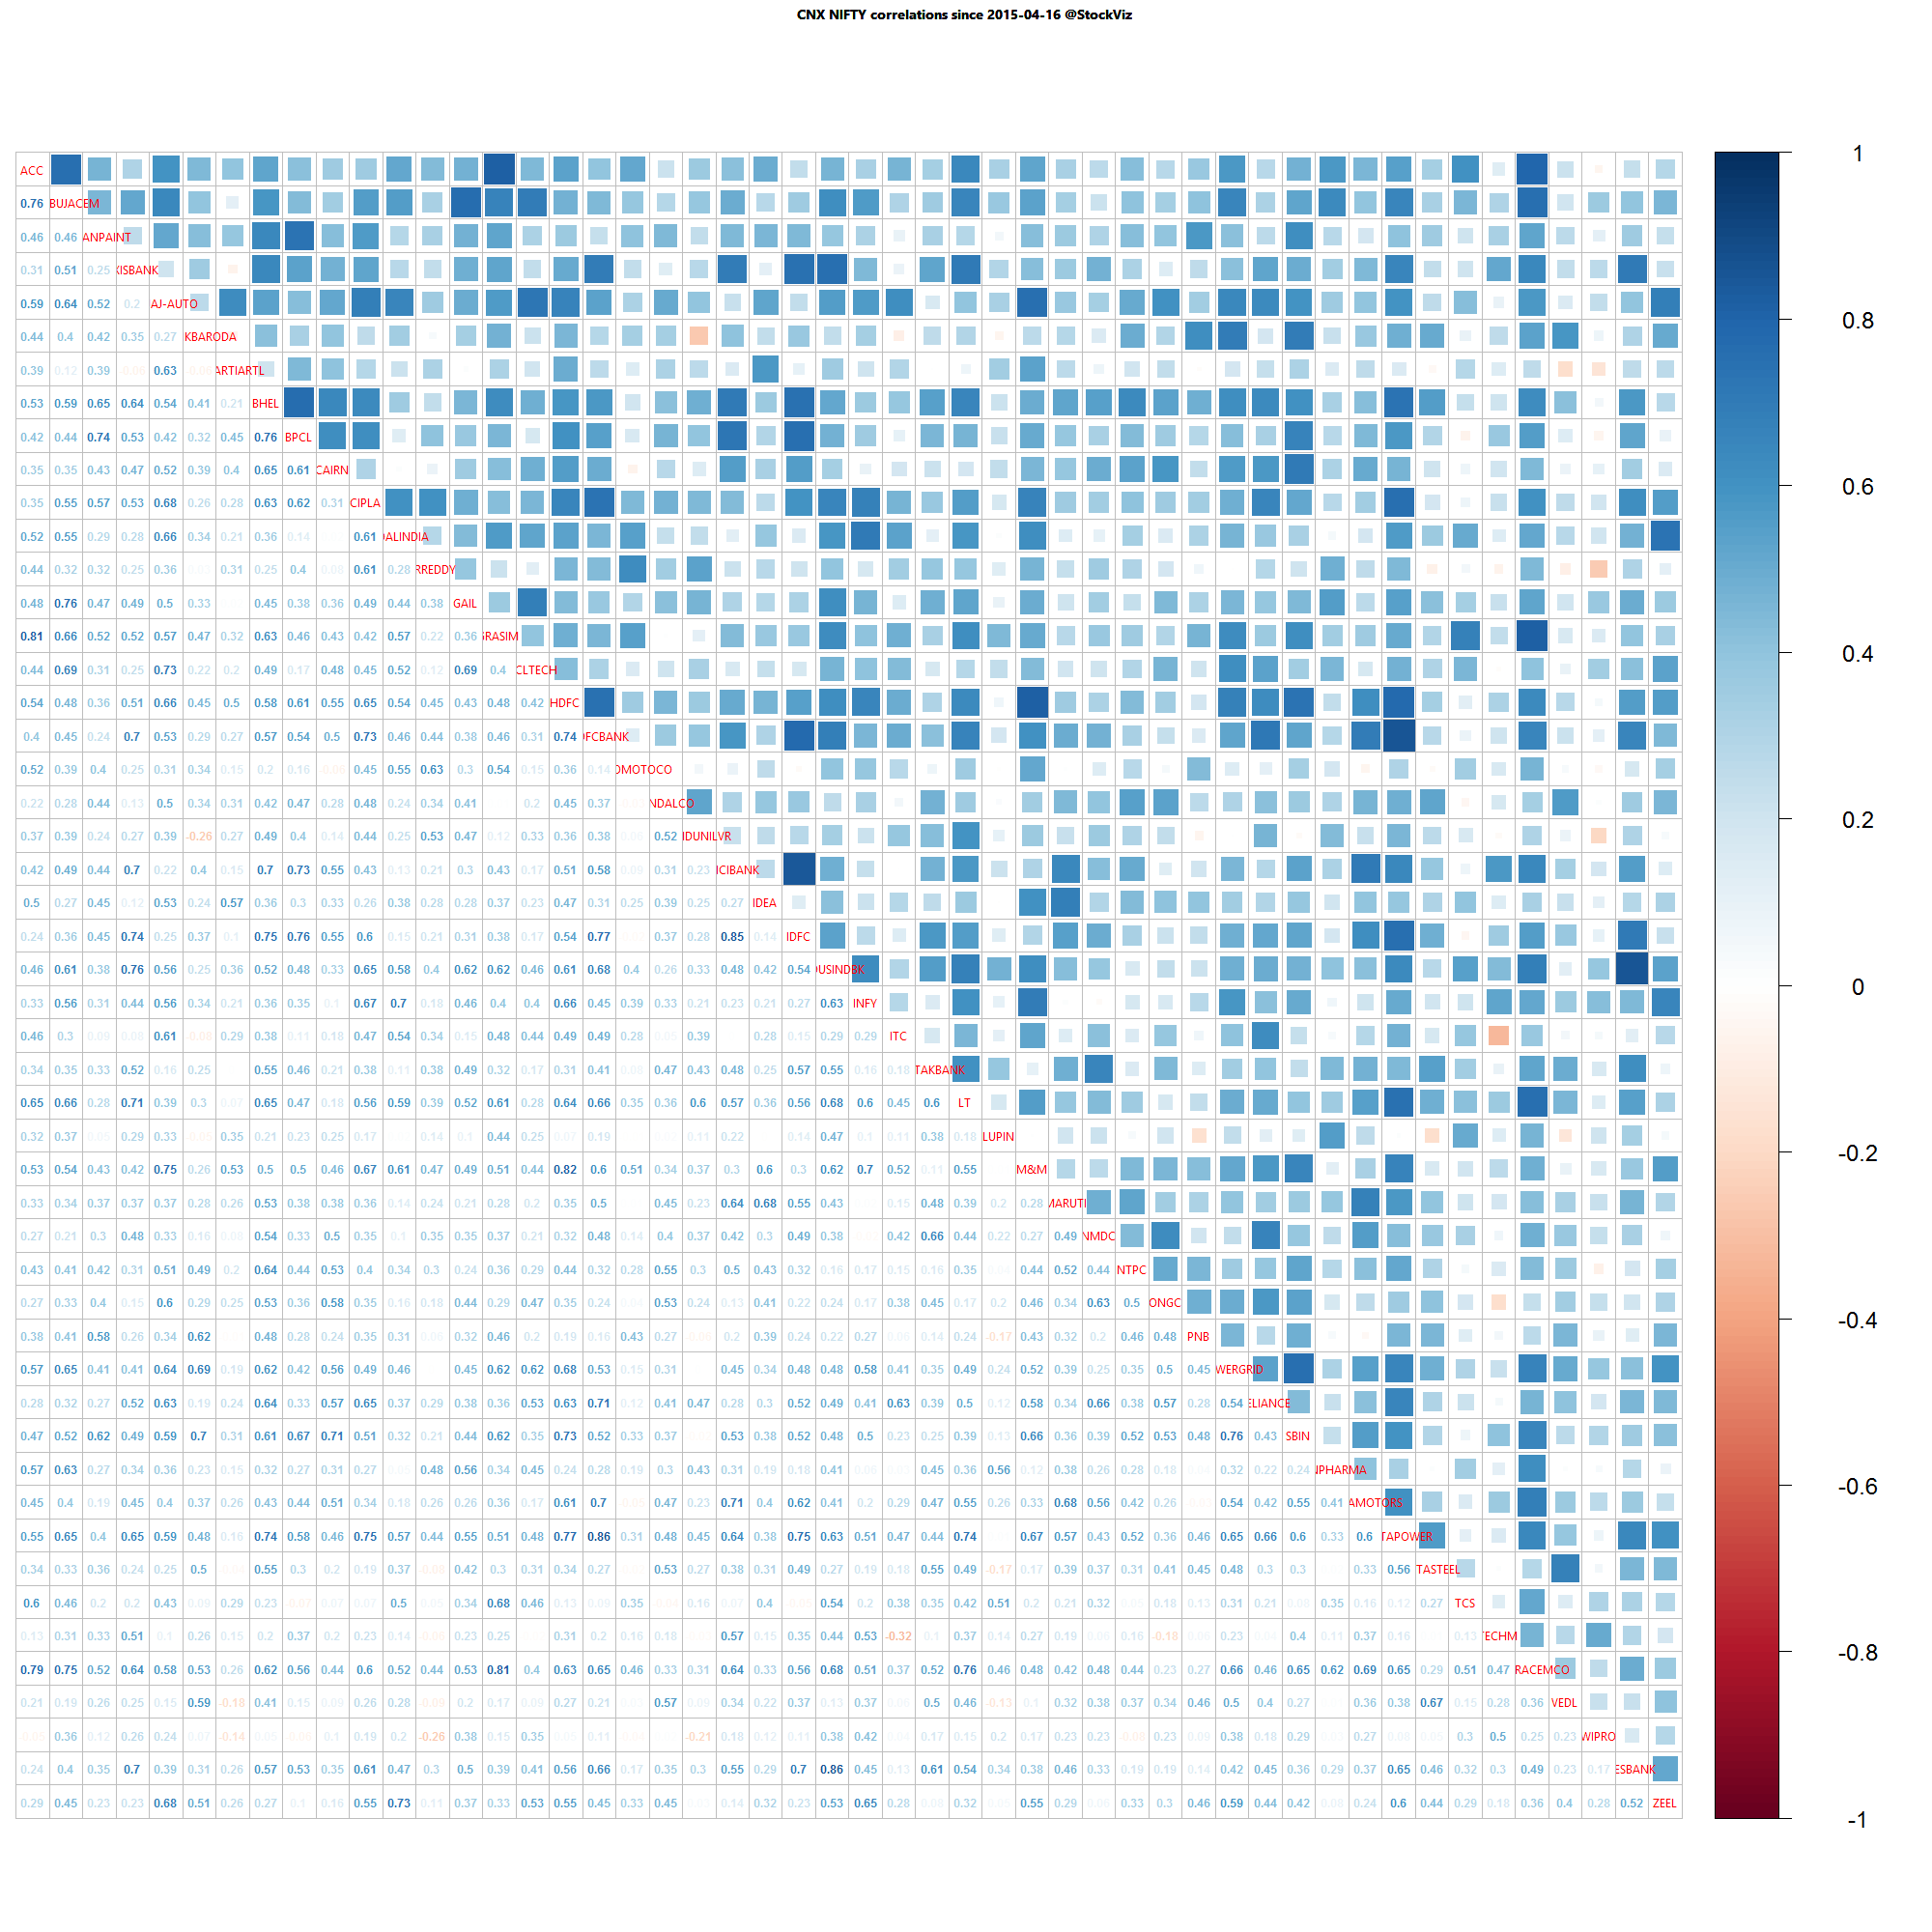
A lot of thick blue squares mean that positive correlations are high. Red squares mean negative correlations are high. Whites are the doldrums.

Weekly Recap: Holacracy

world.2015-04-30.2015-05-08

Equities

Major
DAX(DEU) +2.23%
CAC(FRA) +0.87%
UKX(GBR) +1.24%
NKY(JPN) -0.39%
SPX(USA) +1.47%
MINTs
JCI(IDN) +1.88%
INMEX(MEX) +1.62%
NGSEINDX(NGA) -0.92%
XU030(TUR) +0.33%
BRICS
IBOV(BRA) +1.64%
SHCOMP(CHN) -5.31%
NIFTY(IND) +0.12%
INDEXCF(RUS) +1.20%
TOP40(ZAF) -0.99%

Commodities

Energy
Heating Oil -0.83%
Natural Gas +5.22%
Brent Crude Oil -1.76%
WTI Crude Oil -0.18%
Ethanol +1.91%
RBOB Gasoline -2.24%
Metals
Platinum -0.08%
Copper +1.04%
Palladium +2.72%
Gold 100oz +0.38%
Silver 5000oz +1.86%

Currencies

USDEUR:+0.01% USDJPY:+0.13%

MINTs
USDIDR(IDN) +1.15%
USDMXN(MEX) -1.55%
USDNGN(NGA) +0.16%
USDTRY(TUR) +0.78%
BRICS
USDBRL(BRA) -1.32%
USDCNY(CHN) +0.10%
USDINR(IND) +0.81%
USDRUB(RUS) -1.29%
USDZAR(ZAF) +0.10%
Agricultural
White Sugar +1.17%
Coffee (Robusta) -2.17%
Corn -0.83%
Feeder Cattle -0.72%
Soybean Meal -1.53%
Soybeans +0.36%
Sugar #11 +1.22%
Wheat -0.21%
Cattle -5.08%
Cotton -2.85%
Lean Hogs +5.52%
Lumber -7.84%
Orange Juice +1.21%
Cocoa -0.45%
Coffee (Arabica) -3.79%

Credit Indices

Index Change
Markit CDX EM -0.03%
Markit CDX NA HY -0.59%
Markit CDX NA IG +2.67%
Markit iTraxx Asia ex-Japan IG -0.22%
Markit iTraxx Australia +0.48%
Markit iTraxx Europe +1.76%
Markit iTraxx Europe Crossover +10.94%
Markit iTraxx Japan +2.28%
Markit iTraxx SovX Western Europe -0.21%
Markit LCDX (Loan CDS) +0.00%
Markit MCDX (Municipal CDS) +0.35%
Can you believe that after all the drama, the NIFTY actually ended this week in the green?

Nifty Heatmap

CNX NIFTY.2015-04-30.2015-05-08

Index Returns

For a deeper dive into indices, check out our weekly Index Update.
index performance.2015-04-30.2015-05-08

Sector Performance

sector performance.2015-04-30.2015-05-08

Advance Decline

advance.decline.line2.2015-04-30.2015-05-08

Market Cap Decile Performance

Decile Mkt. Cap. Adv/Decl
1 (micro) -3.91% 60/69
2 -6.40% 64/64
3 -3.74% 63/65
4 -2.57% 58/70
5 -3.22% 55/73
6 -3.93% 54/74
7 -3.29% 56/72
8 -2.15% 64/63
9 -3.23% 57/71
10 (mega) -2.96% 66/63
Outside the NIFTY, things looked bad across the board…

Top Winners and Losers

HINDALCO +8.05%
BAJAJ-AUTO +8.95%
ABIRLANUVO +19.35%
SRTRANSFIN -18.54%
BANKBARODA -14.14%
EXIDEIND -10.61%
Nuvo rallied on retail merger plans…

ETF Performance

CPSEETF +0.42%
NIFTYBEES -0.14%
GOLDBEES -0.81%
INFRABEES -1.51%
JUNIORBEES -2.32%
BANKBEES -3.84%
PSUBNKBEES -4.45%
PSU banks got shellacked…

Yield Curve

yield Curve.2015-04-30.2015-05-08

Bond Indices

Sub Index Change in YTM Total Return(%)
GSEC TB -1.07 +0.50%
GSEC SUB 1-3 -0.77 +1.81%
GSEC SUB 3-8 -0.63 +2.30%
GSEC SUB 8 -0.28 +2.63%
Coupons kept the dream alive…

Investment Theme Performance

Equity Mutual Funds

Bond Mutual Funds

Thought for the weekend

Zappos, an online shoe retailer, announced that the company was eliminating managers and attempting to make Zappos “a fully self-organized, self-managed organization by combining a variety of different tools and processes.” The move to self organize involves the adoption of Holacracy, a system of governance that emphasizes the distribution of authority.

Subsequently, about 14% of the company’s workforce, or 210 out of 1,503 employees, quit.

Source: Zappos Watches 210 Employees Self-Manage Themselves Out The Door

Index Update 09.05.2015

MOMENTUM

We run our proprietary momentum scoring algorithm on indices just like we do on stocks. You can use the momentum scores of sub-indices to get a sense for which sectors have the wind on their backs and those that are facing headwinds.

Traders can pick their longs in sectors with high short-term momentum and their shorts in sectors with low momentum. Investors can use the longer lookback scores to position themselves using our re-factored index Themes.

You can see how the momentum algorithm has performed on individual stocks here.

Here are the best and the worst sub-indices:

index momentum best 365 2015-05-08 png

index momentum best 50 2015-05-08 png

index momentum worst 365 2015-05-08 png

index momentum worst 50 2015-05-08 png

Refactored Index Performance

50-day performance, from February 24, 2015 through May 08, 2015:

Trend Model Summary

Index Signal % From Peak Day of Peak
CNX AUTO SHORT
9.89
2015-Jan-27
CNX BANK SHORT
13.42
2015-Jan-27
CNX ENERGY SHORT
30.10
2008-Jan-14
CNX FMCG SHORT
10.93
2015-Feb-25
CNX INFRA SHORT
50.20
2008-Jan-09
CNX IT SHORT
88.30
2000-Feb-21
CNX MEDIA SHORT
30.20
2008-Jan-04
CNX METAL SHORT
55.67
2008-Jan-04
CNX MNC SHORT
5.36
2015-Mar-12
CNX NIFTY SHORT
8.95
2015-Mar-03
CNX PHARMA SHORT
12.48
2015-Apr-08
CNX PSE SHORT
27.69
2008-Jan-04
CNX REALTY SHORT
88.96
2008-Jan-14
The MNC index should be real “blue-chip” index – lowest draw-down of the whole bunch.