Tag: returns

Benchmarking against a Momentum Index

When we first launched our momentum strategy in India back in 2013, we were one of the few to openly talk about momentum as a systematic strategy. Even the thematic indices that were later launched by the NSE focused on value and beta. This resulted in momentum strategies being forced to inappropriately benchmark against market-cap weighted indices. Thankfully, that is not the case anymore.

S&P BSE Momentum Index

The BSE came out with a Momentum Index last year which can now be used to benchmark momentum strategies. An obvious flaw in this index is that it is rebalanced only once in 6 months whereas most academic research on momentum assume a monthly rebalance. However, if you look past that, it is a better alternative.

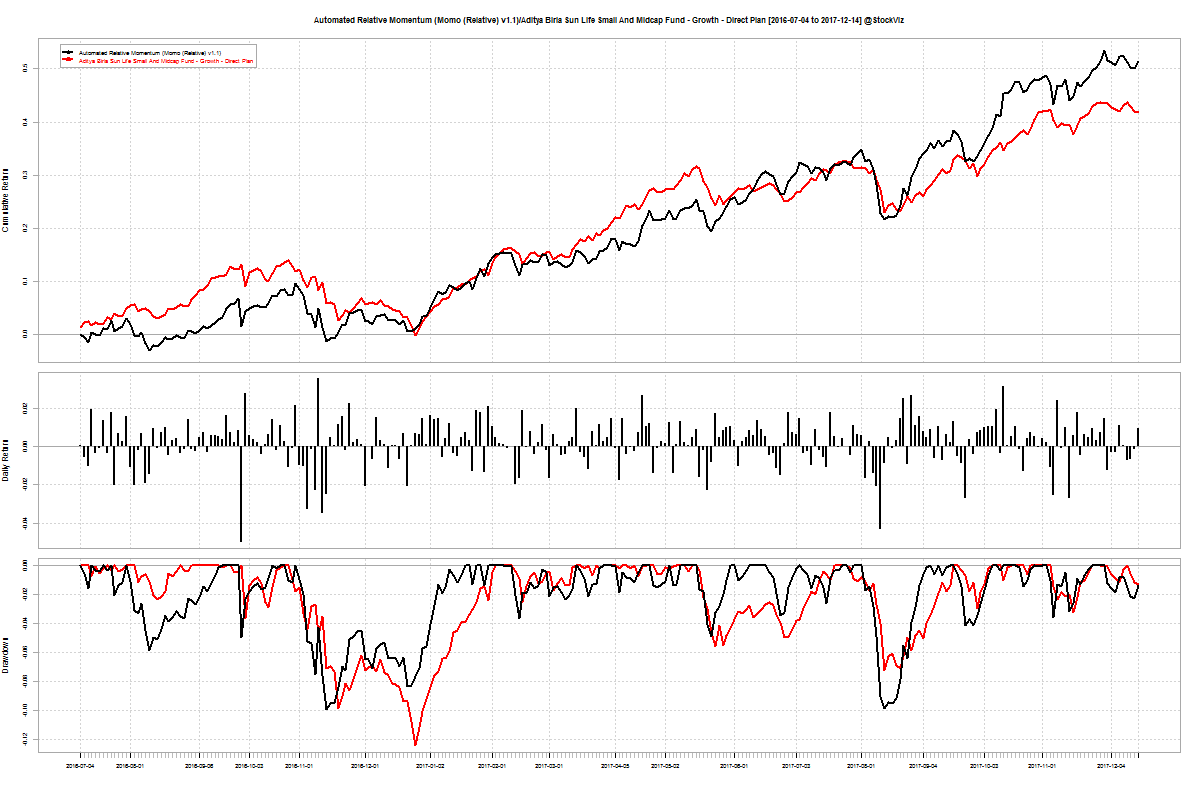
Here is how our Momo Relative Momentum strategy compares against the index:

Our risk-managed momentum strategy has out-performed the momentum index even after transaction costs.

Portfolio Management vs. Stock Selection

Retail investors and their media diet tend to focus too much on what stocks to buy and which IPOs to subscribe rather than portfolio construction and maintenance. Some of these aspects were touched upon here and here. Below are some portfolio level questions that investors should answer before they dive into stock selection:

  1. Is cash allowed? If enough number of stocks cannot be found to fit the investment thesis, or if the market is “bad,” is the portfolio allowed to hold cash? Remember that cash in the brokerage account earns zero.
  2. What is the maximum number of positions? How much time is to be spent everyday on surviellance?
  3. How much of each stock is to be purchased? Is it going to be equal-weight, cap-weight (free-float or full-float) or factor-weight?
  4. Will there be hard position and sector limits?
  5. How will IPO subscriptions where the target allocation is not filled be handled?
  6. What will be covered in daily surveillance? Things to consider: M&A, management, regulations, competitor profile, government interference, etc.
  7. How will costs be controlled? Direct investing is an extremely expensive proposition in India. What are net portfolio returns after: STT, brokerage, exchange fees, SEBI fees, stamp duty, GST/IGST, demat fees, demat transaction charges, short-term gains tax, long-term gains, etc?
  8. Will the portfolio be bench-marked? Should the appropriate benchmark be a basket of mutual funds that could have otherwise been invested into?
  9. What about risk management? Is it going to be a long-only balls-to-the-wall portfolio or are there going to be hedges, stop-losses, etc.?
  10. What is the re-balancing strategy? Will the whole portfolio be recomputed or will only those positions that strayed too far away from the thesis be looked at? How often will this exercise be undertaken?

Unless investors can think through these questions, stock selection is irrelevant.

Transaction Cost Analysis of a Momentum Strategy

Momentum strategies have been on a tear over the last few years and have generally out-performed pure-value strategies. When we compare momentum returns with mutual funds, the most common criticism we encounter is that mutual fund returns are after transaction costs whereas our “Theme” returns are before transaction costs.

Momo (Relative) v1.1 vs ABSL S&M Fund (Annualized returns are 85.50% and 35.12%, respectively.)

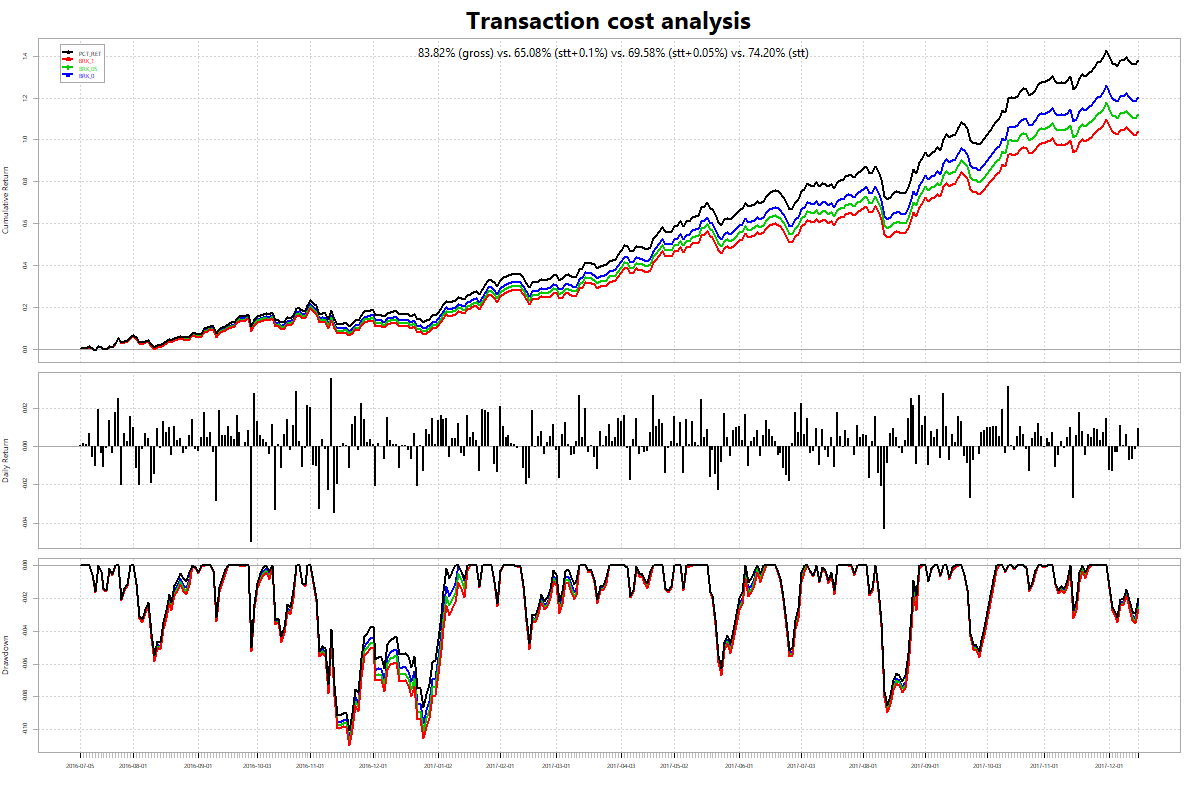
The challenge we face in showing post-cost returns is that we offer different brokerage slabs to different types of clients, making a one-cost-fits-all analysis impossible. However, we can show how different brokerage slabs impact returns.

A gross return of 83.82% translates to returns of 74.20%, 69.58% and 65.08% for brokerage slabs of 0.1%, 0.05% and 0% respectively (STT of 0.1% was assumed.) Momentum out-performs even after transactions costs.

An Equity, Bond and Gold Portfolio

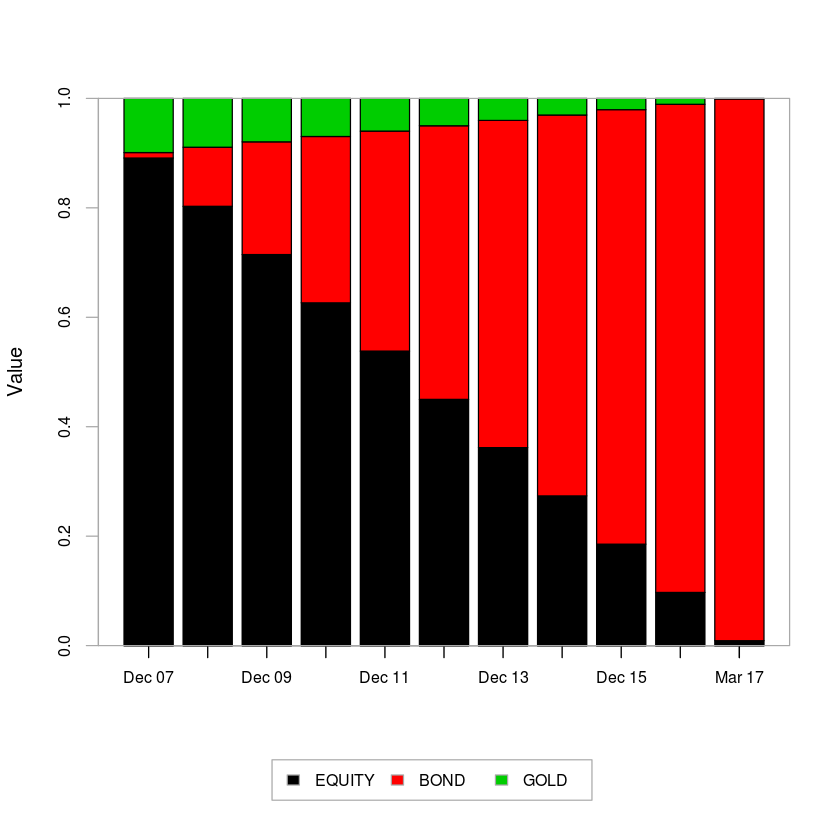
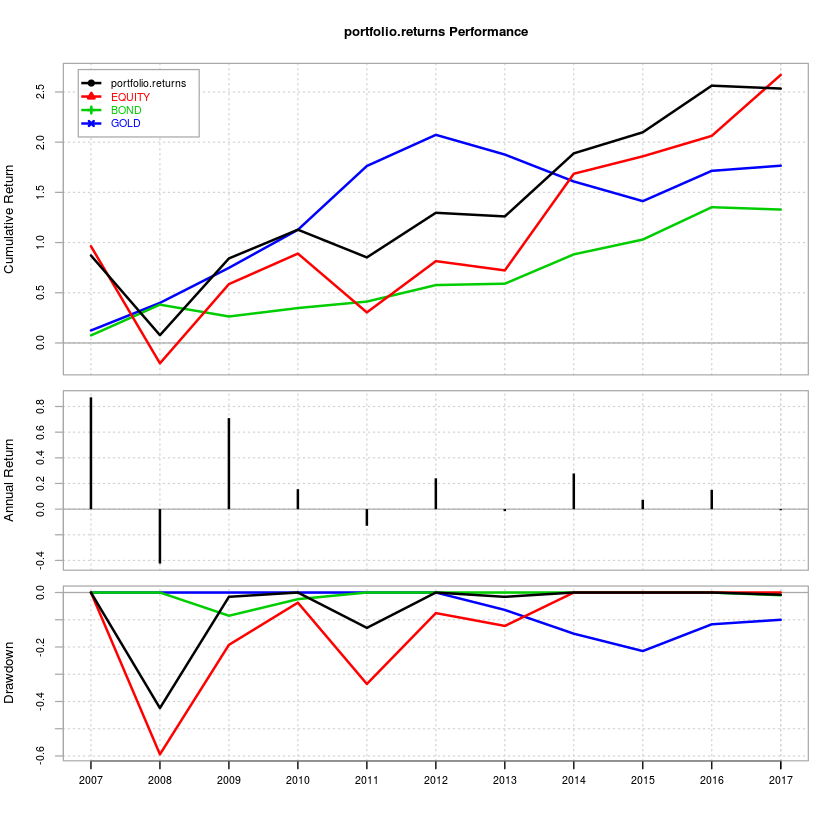
How did diversification across Midcap equity, bonds and gold work out for Indian investors over the last 10 years? Not too shabby, as it turns out:

Combined portfolio – Annualized: 12.16%; Max drawdown: -42.42%
Gold only portfolio – Annualized: 9.69%; Max drawdown: -21.49%
Equity only portfolio – Annualized: 12.55%; Max drawdown: -59.39%
Bond only portfolio – Annualized: 7.99%; Max drawdown: -8.52%
*Not including transaction charges/taxes.

The Setup

  • Annual rebalance.
  • Bonds start at 1%, the rest is divided between Gold (10%) and Equities.
  • The total return index for the 5-10 year tenure published by CCIL is used as a proxy for Bonds.
  • The MID100 FREE index is used as a proxy for Equities.
  • The GOLDBEES ETF is used as a proxy for Gold.
  • Period under observation: 2007-04-01 through 2017-03-31.

The idea is that you start with mostly Equity and Gold in the portfolio and rebalance at the end of every year so that at the end of 10 years, you end up with mostly Bonds.

Returns

Notice the drawdown of the equity vs. that of the portfolio. You end up with similar returns but with lower volatility.

If you remove Gold from the equation and go with only Equity and Bonds:

Combined portfolio – Annualized: 11.38%; Max drawdown: -49.90%
Equity only portfolio – Annualized: 12.55%; Max drawdown: -59.39%
Bond only portfolio – Annualized: 7.99%; Max drawdown: -8.52%

Even though a diversified, rebalanced portfolio makes sense on the surface, the tax treatment on Gold and Bonds make an annual rebalance an expensive affair.

Code and detailed results are on Github.

Fund Alpha Over ETF Baskets

A fund’s alpha – returns over a benchmark – is often quoted and widely misunderstood. The root of the misunderstanding comes from investors assuming that alpha is a constant – which it is not – and the funds using benchmarks that the investors cannot actually invest in. Even if an investor decides to go “passive,” there is still an active choice that needs to be made regarding the basket of ETFs he needs to invest in. Let’s answer the first question: What exactly is the active manager’s value add?

Alpha over a basket of ETFs

We select three ETFs, NIFTYBEES, JUNIORBEES and M100, since they are popular and span a fairly decent spectrum of traded stocks in the market. Then, we do a rolling (window of 200) linear regression of returns over 200 days of a few midcap funds (selected at random.) The intercept is the alpha of the fund vs. the ETFs. Here’s how the alpha varies over a period of time:
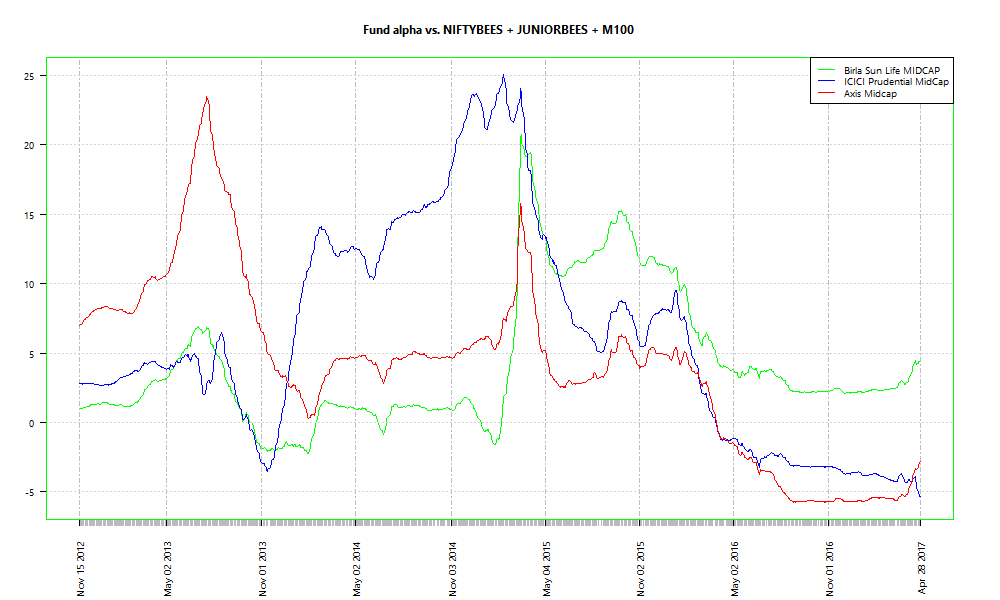
Two out of the three funds have negative alpha over the ETF basket right now. However, that doesn’t mean that they will stay there.

As an investor, you can use the betas obtained by the regression over the ETFs to “replicate” the fund at a point in time. For example, if you set the start date as the date at which each of the funds had peak alpha and just held onto the basket, here’s how the relative performances look:
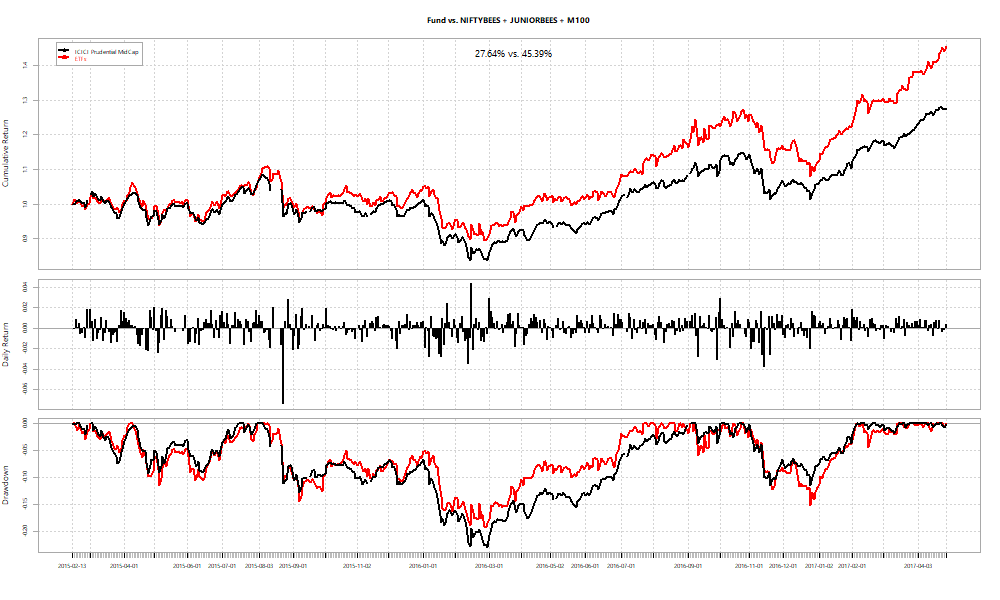
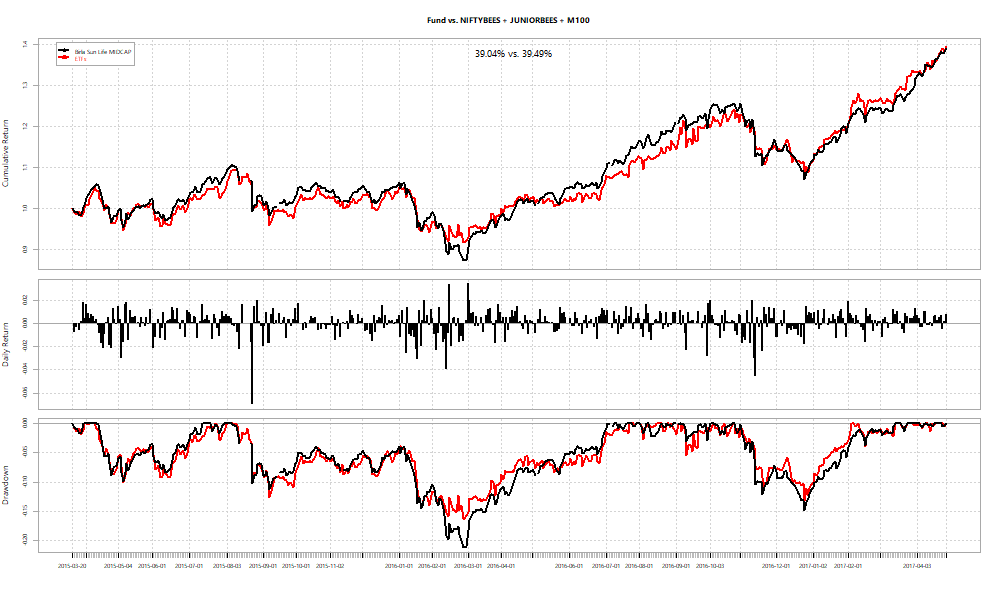
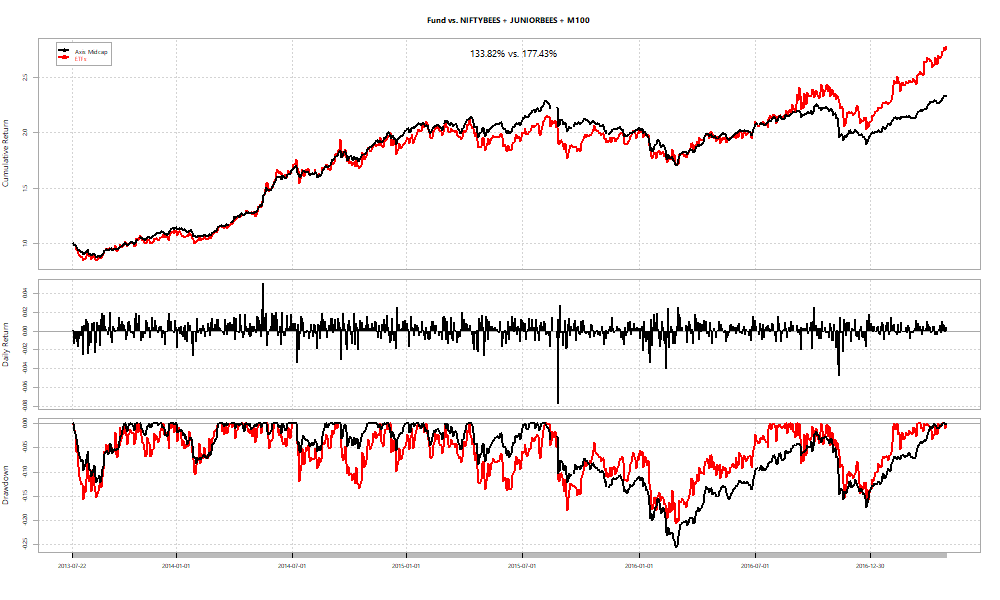
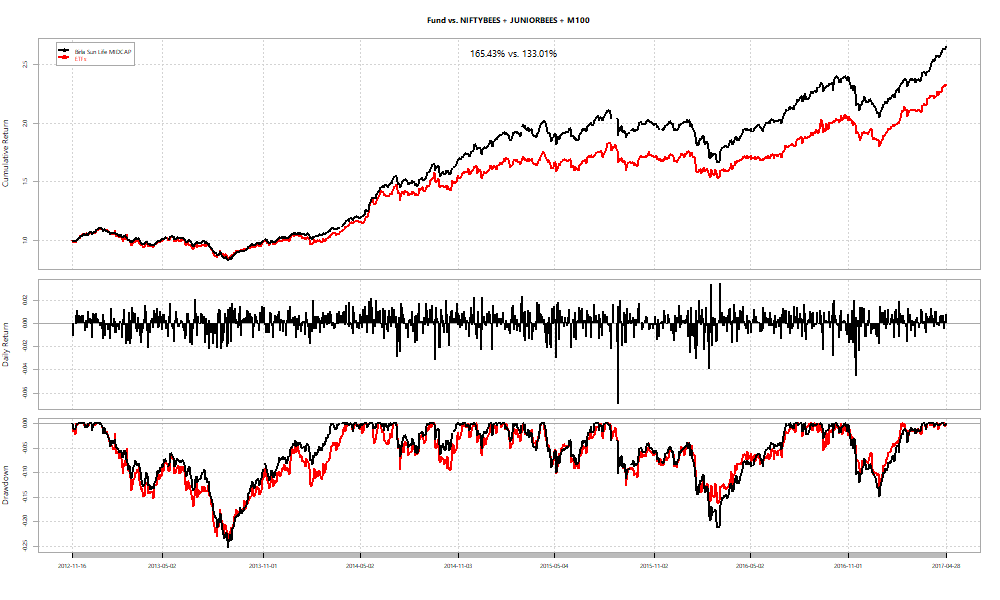
In all cases the basket fixed at the peak performs at par or better than the fund. However, you never really know what the “peak” is when you are living through it. What if you fix the basket right at the beginning?
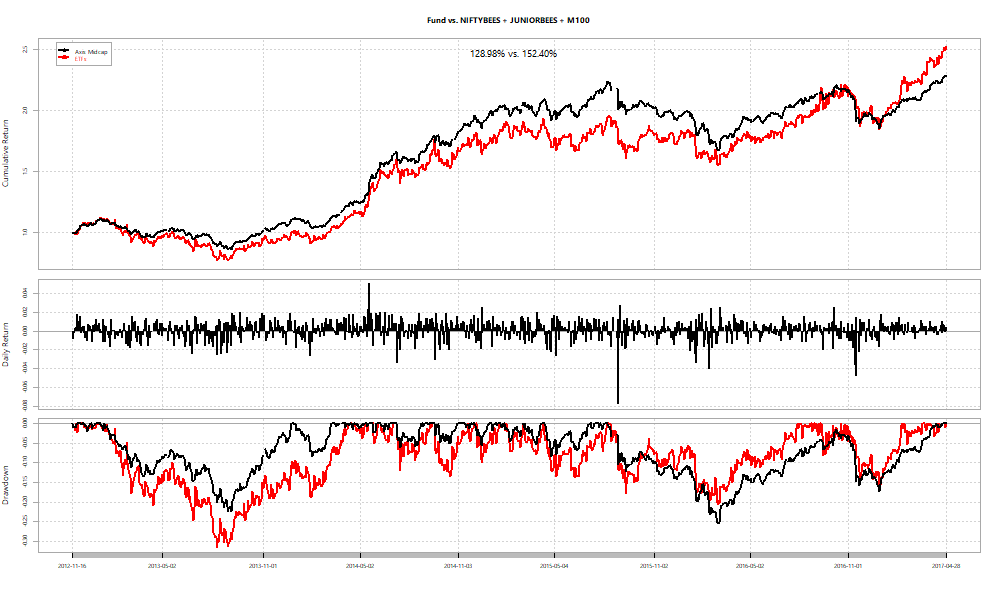
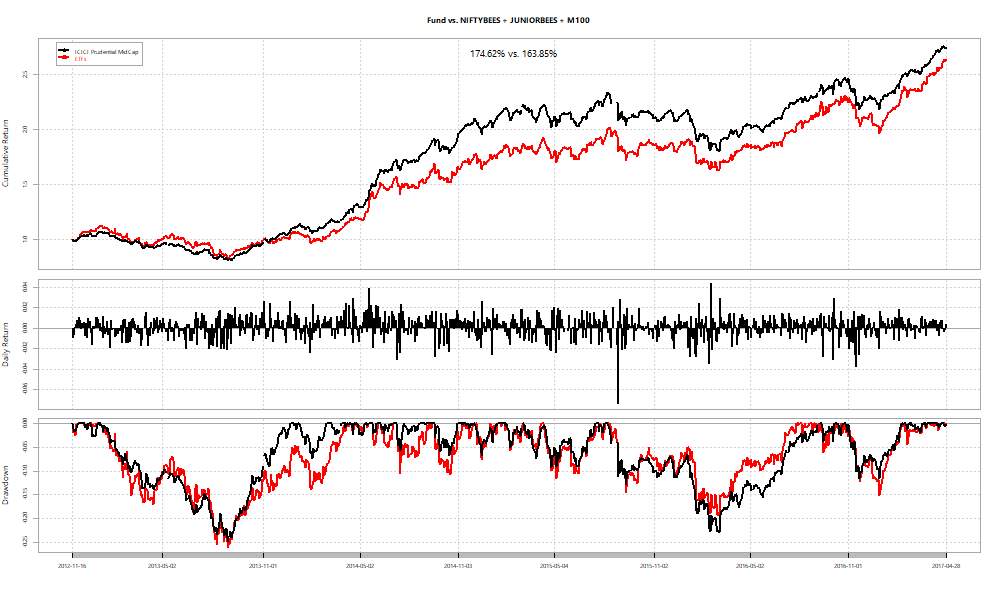
In two out of three cases, we see funds beat ETF baskets.

Summary

  • We use linear regression to measure a fund’s alpha over a basket of ETFs.
  • Alpha varies over time. Out/under performance is sensitive to begin and end dates.
  • If a fund’s peak alpha can be pegged, then a basket of ETFs with those betas will outperform the fund.