Tag: returns

Definition: Drawdown

Drawdown, of an investment, is the peak-to-trough decline during a specific period.

It is not uncommon for stock indices to drawdown 30% in a year. Here’s how we see it.
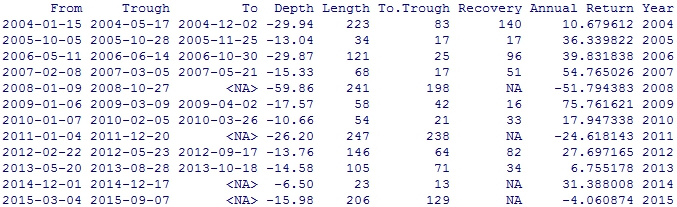
Nifty 50 Drawdowns

drawdowns.nifty50

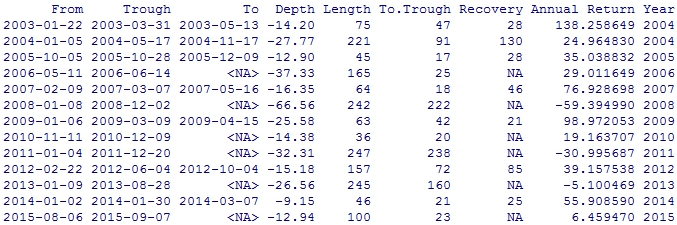
Nifty Midcap 100 Drawdowns

drawdowns.midcap100

Explainer

Drawdowns take their time to form and can be identified into three distinct points:

  1. The day from which the investment started going down. ‘From’ in the above images.
  2. The day on which the investment stopped going down. ‘Trough’ in the above images.
  3. The day on which the investment recouped all its losses from (1). ‘To’ in the above images.

The number of days the whole processes took is the ‘Length’ of the drawdown. ‘Recovery’ shows the number of days it took to get back to it initial value.

Path dependency

The yearly breakup shown above doesn’t give the real picture of how the investment actually performed during the entire stretch of time. For example, here’s NIFTY 50 vs. MIDCAP 100:

Between 2004-01-01 and 2016-01-20, NIFTY 50 has returned a cumulative 282.24% with an IRR of 11.76% vs. NIFTY MIDCAP 100's cumulative return of 394.05% and an IRR of 14.16%.

Depending on where your starting point is, you end up with different drawdown and return profiles. You can fool around with that here: svz.bz

Take-away

Returns go hand-in-hand with drawdowns. Seasoned investors wait for it (in bond funds) to enter, most long-term investors learn to ignore them and continue their dollar cost averaging (aka SIP.)

Relative Returns of Midcap Funds

midcap mutual fund relative returns

Relative Returns

We wanted to see how different mutual funds compared to the CNX MIDCAP index. We took the annual returns of a dozen funds and subtracted the annual returns of the CNX MIDCAP index. This gives us an idea of how well the fund was managed.

The above result is a bit surprising. Other than the ICICI Prudential Value Discovery Fund, no other fund consistently beat the CNX MIDCAP index. Of course, returns are only half the story, these numbers don’t tell us the risks that were taken to achieve them.

Besides, none of the top funds in a year hold that position over the next (see this.)

Related: Mutual Fund Performance in Bear Markets

Leaders and Laggards

Lagged correlations

Excess winter snow-fall in the Himalayas lead to floods in Bangladesh during spring. If we know that that there was excess snow-fall in the Himalayas this season, we can be better prepared to handle the floods four-months from now. This is the idea behind studying lagged correlations.

If we took a pair of sector indices and lagged their returns, can we find an index that “leads” an other and profit from it?

CNX BANK.CNX CONSUMPTION.monthly.lag

The chart above is called the cross-correlation plot. It shows that there are two lags, 5 and 9, where CNX BANK lags CONSUMPTION. A scatter plot shows how monthly-returns are correlated to each other across different lags and confirms the relationship:

CNX BANK.CNX CONSUMPTION.monthly.scatter

Finding

We found a number of index pairs that lead/follow one another. In addition to the CNX BANK and CNX CONSUMPTION indices above, CNX INFRA and CNX CONSUMPTION, CNX IT and CNX FINANCE, CNX CONSUMPTION and AUTO display this dynamic.

CNX INFRA.CNX CONSUMPTION.monthly.lag

CNX IT.CNX FINANCE.monthly.lag

CNX CONSUMPTION.AUTO.monthly.lag

Data mining warning

We cannot draw any conclusion from this “finding.” We mined 20 indices over 5 years to dig these nuggets out. The result is spurious. From a statistical point of view, there is no index that consistently leads or lags another.

Related: Should you care about monthly returns of the Nifty?

Multinationals Listed in India

Multinational companies (MNCs) listed in India, like Bosch, Colgate, etc, are generally considered to be well managed, cash-rich businesses. Lets take a look at their past performance and some actively managed funds that focus on them. It may be worth your while to add some MNC goodness to your portfolio.

MNCs vs. Top 100

Our first stop is first check if MNCs indeed outperform the market. For this, lets compare the CNX MNC index to the CNX 100 index.

Between 2005-01-03 and 2015-02-02, CNX MNC has returned a cumulative 453.68% with an IRR of 18.49% vs. CNX 100’s cumulative return of 318.85% and an IRR of 15.26%. (permalink) Apart from a brief period of under-performance between 2007 and 2008, MNCs have generally done better than the rest of the market.

MNCs vs. Midcaps

Between 2010-01-04 and 2015-02-02, CNX MNC has returned a cumulative 108.14% with an IRR of 15.31% vs. BSE MID CAP’s cumulative return of 58.41% and an IRR of 9.47%. (permalink) #winning

MNC funds

There are a couple of funds, one from UTI and the other from Birla Sun Life that focus purely on MNCs. Here’s how the UTI fund has performed:

Between 2006-04-03 and 2015-02-02, UTI – MNC Fund has returned a cumulative 283.13% with an IRR of 16.41% vs. CNX MNC’s cumulative return of 182.80% and an IRR of 12.10%. (permalink)

Between the two of them, UTI’s fund’s IRR of 37.12% is eclipsed by BSL’s 41.52% between 2013-01-02 and 2015-02-02 (a shorter time-period of comparison.) (permalink)

But irrespective of which fund you choose, the excess returns cannot be ignored. And of course, past-performance is not indicative of the future.