Tag: returns

Why Diversify?

One of the main benefits of diversification is that if you invest in a group of assets with low correlations to one another, then you are likely to get the highest return for a given level of risk. But has it really worked that way for Indian investors? Here’s what we found while we crunched some numbers using CNX 100 and GSec 8+ year total return index since 2003.

Correlation

Yes, correlations are low: 0.0624. And we have a scatter-plot to prove it:

CNX 100-GSEC_SUB_8-2003

Returns

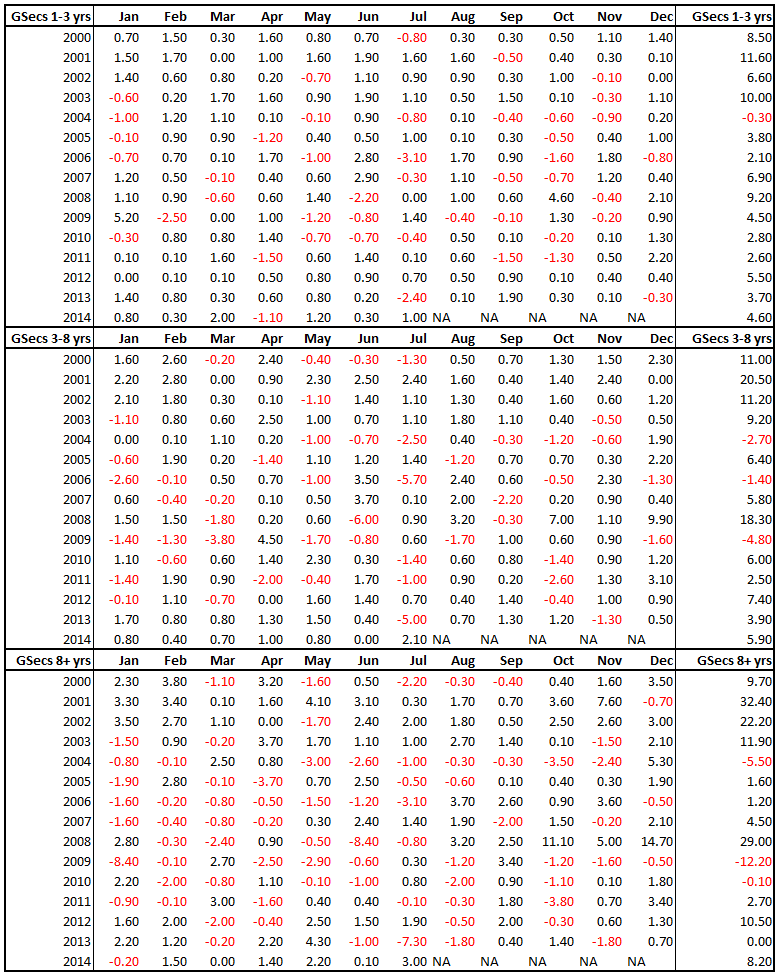
Here’s how the yearly returns look like (%):

stocks.vs.bond.returns

An 80:20 stocks:bonds portfolio would have had an average return of 21.43% vs 25.81% of a stock-only portfolio – a give up of 4.38% in returns – with lower volatility.

The question is, is it worth the trade off if you can stomach the volatility?

Related: BOND ≠ BORING

Bonds, Rates and USDINR Update

The Yield Curve

Lets put the current zero-coupon yield curve in context.

Jan 2011 vs. Now

yieldCurve.2011-01-18.2014-07-25

Jan 2012 vs. Now

yieldCurve.2012-01-02.2014-07-25

Jan 2013 vs. Now

yieldCurve.2013-01-01.2014-07-25

Indian 10 yrs vs. US

After the initial Modi euphoria, the spread between Indian 10 yrs and US 10 yrs started to revert back to its mean:

ust-ind-10yr-spread.2011-01-18

Total Return Indices

Investors in the long bond are yet to recover from the July 2013 draw-down but this year is looking good. Long-bond might just be the place to be as the RBI is widely expected to get into easing mode later this year/early next year.

Cumulative Returns Since 2000

Short
short bond total return

Intermediate
intermediate bond total return

Long
long bond total return

Cumulative Returns Since 2010

Short
short bond returns since 2010

Intermediate
intermediate bond returns since 2010

Long
long bond returns since 2010

Bond ≠ Boring

Returns have been volatile for bond investors.

gsec monthly returns

Can’t really sell “stability” here.

USDINR

A new normal past the euphoria and the hangover?

USDINR.2013

USDINR.2010

In closing

With inflation somewhat stabilizing and the NDA-II government wanting to kick start growth, bonds are getting interesting again. And when rates start moving, currencies cannot be far behind.

Stay updated on the latest news related to Indian interest rates here. Its curated.

Investment Theme Performance Roundup

WHAT IS A “THEME”?

A StockViz Investment Theme is a portfolio of stocks that follows a particular strategy. It is a convenient way for you to:

  1. stick to a strategy
  2. follow a preset rebalancing schedule
  3. think in terms of your portfolio strategy rather than individual stocks
  4. avoid common behavioral pitfalls
  5. systematically track your P&L and strategy performance

WHAT IS AN INVESTMENT STRATEGY?

An investment strategy is a specific way of going about the process of investing. It identifies specific variables that define a stock. Variables can be anything: risk, style, sector, balance-sheet items, etc..

By mapping specific Themes to your account, you ensure that you stay pure to your strategy allocation. And that there is no “flying by the seat of your pants” investing.

HOW HAVE YOUR THEMES PERFORMED?

Theme Commencement Performance NIFTYBEES Performance JUNIORBEES Performance
Market Fliers
2013-Oct-28
64.79%
24.5%
35.1%
Magic Formula Investing
2013-Aug-19
68.67%
39.89%
48.38%
Enterprise Yield
2013-Sep-16
49.51%
30.24%
46.46%
Pharma 10
2013-Jul-17
8.36%
27.88%
35.85%
Pharma Growth
2013-Jul-17
13.01%
27.88%
35.85%
Private Banks
2013-Jul-15
28.82%
26.61%
33.45%
Quality to Price
2013-Aug-28
132.47%
43.5%
54.91%
Gold and Jewellery
2013-Jul-15
-0.34%
26.61%
33.45%
Alcohol and Tobacco
2013-Jul-25
8.84%
29.05%
38.35%
Industrial Value
2014-Jun-02
13.57%
4.27%
1.36%
Market Elephants
2013-Sep-02
28.51%
37.15%
49.96%
Balance-sheet Strength
2013-Sep-11
93%
28.88%
45.66%
For-Profit Education
2013-Jul-25
81.33%
29.05%
38.35%
Momentum 200
2013-Aug-19
42.34%
39.89%
48.38%
Financial Strength Value
2013-Sep-13
56.54%
30.06%
45.69%

Detail of draw-downs can be found here.

Performance Charts

Gold and Jewellery.2013-07-15.2014-06-17

Private Banks.2013-07-15.2014-06-17

Quality to Price.2013-08-28.2014-06-17

Enterprise Yield.2013-09-16.2014-06-17

Magic Formula Investing.2013-08-19.2014-06-17

Pharma 10.2013-07-17.2014-06-17

Pharma Growth.2013-07-17.2014-06-17

Market Fliers.2013-10-28.2014-06-17

Financial Strength Value.2013-09-13.2014-06-17

Momentum 200.2013-08-19.2014-06-17

Balance-sheet Strength.2013-09-11.2014-06-17

For-Profit Education.2013-07-25.2014-06-17

Industrial Value.2014-06-02.2014-06-17

Market Elephants.2013-09-02.2014-06-17

Alcohol and Tobacco.2013-07-25.2014-06-17

WHAT SHOULD I DO NEXT?

You should open a demat account with StockViz and invest through our Themes.

Public Sector vs. MNCs

On the NSE, you can find two indices: CNX PSE and CNX MNC. They have been around since Jan-1995 – providing a quantifiable glimpse into how badly Nehruvian socialism has fared in modern India.

Cumulative Returns

CNX PSE: +247.69%
CNX MNC: +619.05%

CNX PSE-returns

CNX MNC-returns

Value traps

There has been a lot of talk recently about reforming PSEs. The SEBI wants the 25% public shareholding rule to apply to all public sector companies as well. The earlier (UPA-2) government, finding no takers for PSE stock, got Goldman to form an ETF to put some lipstick on the sector. The Rajiv Gandhi Equity Savings Scheme gave out tax sops to get retail investors into “Maharatna, Navratna, or Miniratna” stocks.

As much as I would like to believe that things are going to be different this time, you can’t dismiss the fact that PSEs have only lost money for investors. Once the crutches come off, these firms will anyway have to go through gut-wrenching transformations to compete in the real world. That would be a better trigger to enter these stocks (if and when they happen) rather than now when all we have are promises.

Public Sector Banks: Is this time different?

A tale of three indices

The NSE has three financial indices listed that provides a rare window into how different parts of the financial sector has performed over the years.

Index Inception Date
CNX PSU BANK 2004-01-01
CNX FINANCE 2004-01-01
CNX BANK 2000-01-01

Return profiles

Returns in the financial sector comes with some very fat tails. If one could consult an oracle on the timing of these big swings, there’s a pretty packet for them.

CNX FINANCE-returns-histogram

CNX BANK-returns-histogram

CNX PSU BANK-returns-histogram

Cumulative returns

If you had stayed invested since 2004-01-01, here’s how much you would have made:

Index Cumulative returns
CNX FINANCE 495%
CNX BANK 455%
CNX PSU BANK 265%

Note: These are cumulative numbers, not annualized returns

CNX FINANCE-returns

CNX BANK-returns

CNX PSU BANK-returns

If you notice, PSU banks are yet to recover from the draw-down that occurred August-2013.

Investors have been on a PSB binge ever since the Modi effect took shape. Will this time be different for investors?

[stockquote]PSUBNKBEES[/stockquote] [stockquote]BANKBEES[/stockquote]