Tag: quant

Investing in Micro-caps

The Size Factor

All things being equal, micro-caps outperform mega-caps in the long-run — investors are compensated for the higher systematic (business cycle) risk that they take when they invest in micro-cap stocks. One way to boost relative performance vs. a market-cap weighted index is to invest in an equal-weighted basket of stocks that are in the index. Alternately, investors can add a basket of micro-cap stocks to their portfolio to juice overall returns.

Market-cap Deciles

We had discussed how we can divide the universe of listed stocks in deciles based on their free-float market cap here. Given our ability to automate systematic investment strategies, we created an auto-rebalanced Theme each for every decile.

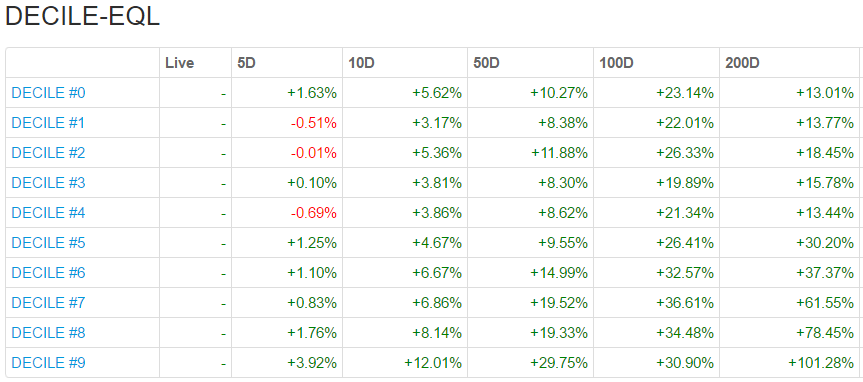
Investors can now gain exposure to an equal-weight portfolio of micro caps by investing in the Decile 9 Theme and mega-caps by investing in the Decile 0 Theme. Returns and risk go down as you climb up the market-cap ladder. Our Market Dashboard gives an idea of how returns have been distributed across the deciles:

decile returns

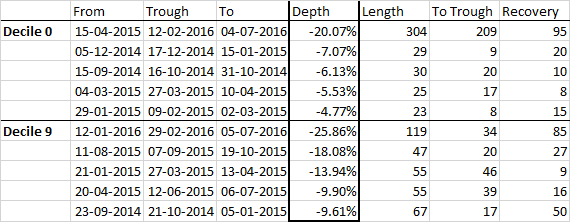
Notice how the drawdowns are deeper with micro-caps:
decile drawdown

Investors who whethered the steeper drawdowns of micro-caps have experienced returns an order of magnitude larger than mega-cap investors. Check out the ‘Size Factor’ in our Investment Themes page for other Market-cap based Themes.

Internal Bar Strength

Definition

Internal Bar Strength (IBS) is based on the position of the day’s close in relation to the day’s range: it takes a value of 0 if the closing price is the lowest price of the day, and 1 if the closing price is the highest price of the day. The IBS effect may be related to intraday over-reactions to news or market movements, which are then “corrected” the next day.

IBS = (Close – Low)/(High – Low)

It is a mean-reversion strategy.

Back test

The paper from Alexander Soffronow Pagonidis claims that low IBS values are associated with high returns, while high IBS values are associated with low returns. Average returns when IBS is below 0.20 are .35% while average returns when IBS is above 0.80 are -0.13%.

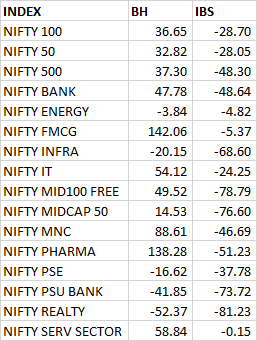
We put this to the test on 16 NSE indices. Calculating IBS and trading at the close. To keep things simple, we assumed that we can trade at closing prices. Buy at the close if IBS is below 0.2, and sell at the close if IBS exceeds 0.8, exit the position at the following market close. If a back test on indices proved promising, we figured we would try this out on individual stocks next. However, IBS returns trailed buy-and-hold by a significant margin.
ibs

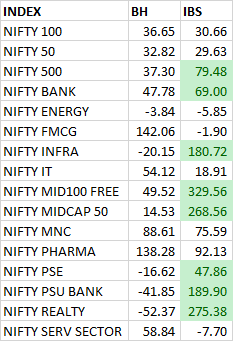
Using IBS to trade mean reversion, as the author intended, is a losing proposition. What if we do the reverse?
ibs_inverse

It “works” for about half the indices – could be pure luck.

Conclusion

It looks like IBS either doesn’t hold for Indian markets or for the indices we tested.

Source: The IBS Effect: Mean Reversion in Equity ETFs (pdf)

Equity curves: IBS Mean Reversion (pdf)
Trading turnover throughout the day

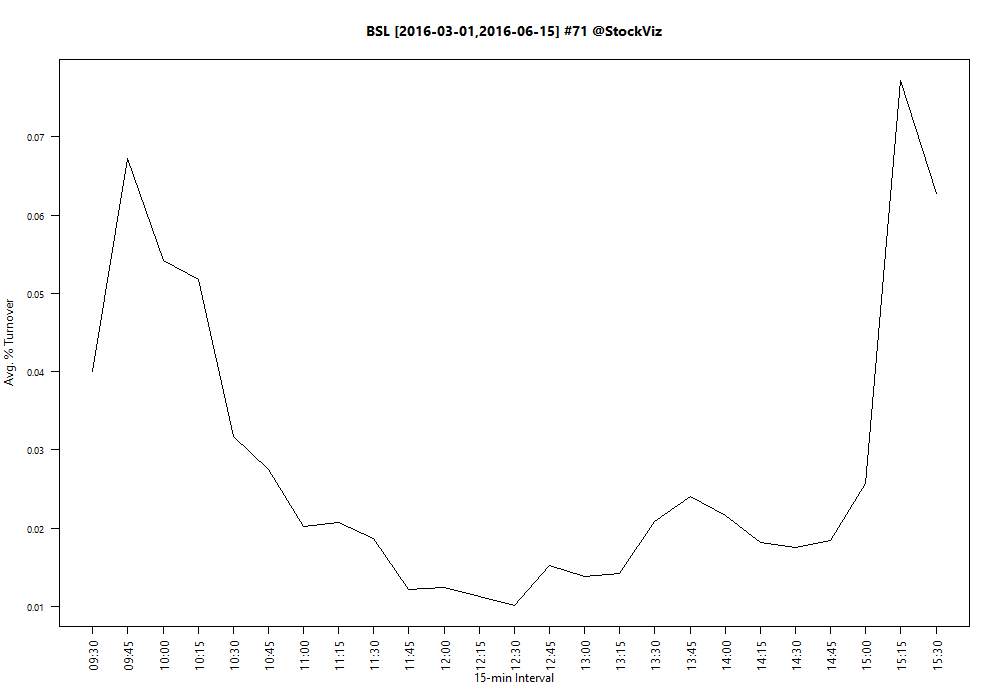
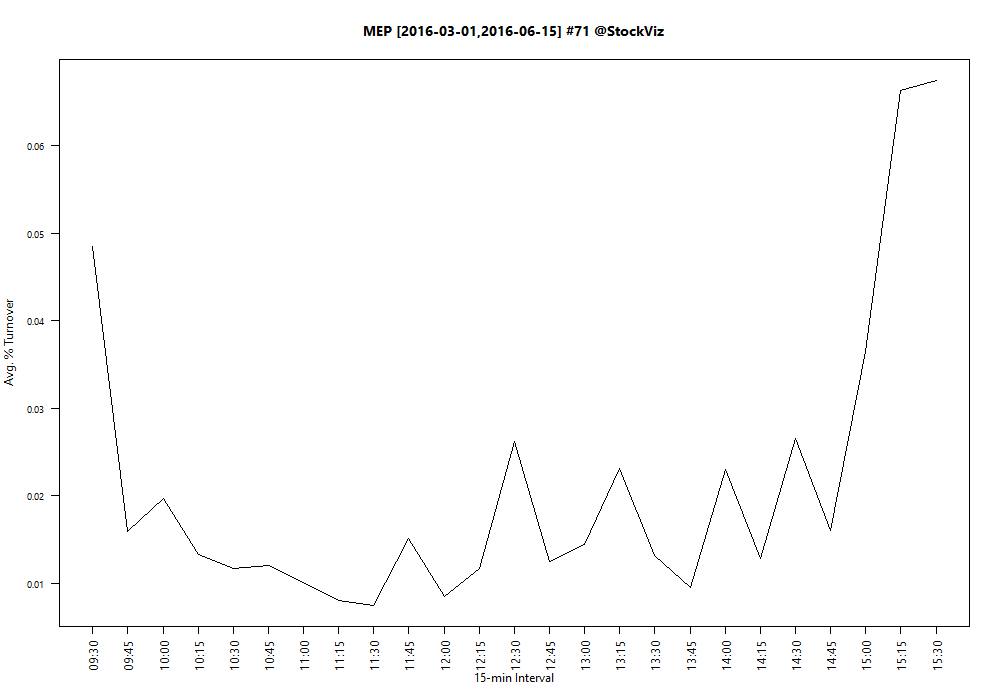
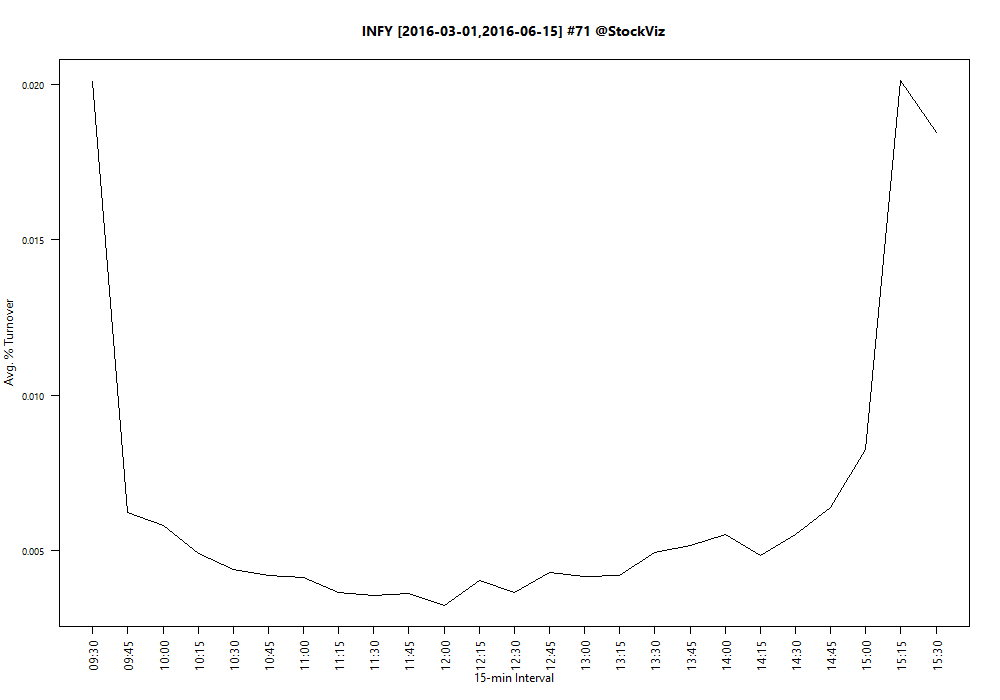
Turnover, defined as volume over total number of shares outstanding, is not constant throughout the day. If you plot turnover over a trading day, it typically traces a ‘U’ shaped plot.

turnover.BSL

turnover.MEP

turnover.INFY

Notice how turnover is the highest in the first half-hour and the last-half hour of trading? Turns out, it is a global phenomena. It follows that if you want liquidity, then it is enough if you show up for the last half-hour of trading.

Related:
Trading Day of Month Returns
Equity Returns at the Turn of the Month
Improving VWAP Strategies: A Dynamic Volume Approach

Trading Day of Month Returns

An analysis of daily returns of the NIFTY 50 index between 1998 and 2015 shows that:

  1. The first few and the last few trading days of a month are the best days to be long.
  2. Middle of the month returns are more volatile and, on an average, negative.
  3. Cumulative returns of a strategy that is long on the first 5 and the last 5 days of the month and short the others is 1,112.154% vs. 636.1821% of a buy and hold strategy.

day-of-month

Further reading: An Anatomy of Calendar Effects (SSRN)

A Brief Note on Monte Carlo

When we back-test a strategy against the historical prices of an instrument, say, the NIFTY 50 index, we have to keep in mind that historical values are just one path of the many paths that the instrument could have taken.

For example, 10 tosses of a fair coin can result in TTTTTFFFFF and TFTFTFTFTF with equal probability. If your strategy is path dependent (as most strategies are,) then just because it was successful in one trial (historical prices) doesn’t mean that it would have been successful in all (or majority) of them.

The simple thing to do after a successful back-test against historical prices is to run a Monte Carlo simulation to check if the strategy comes out ahead in most of them. This can be setup by assuming returns are normally distributed and running a simulation using the mean and standard deviation of the sample.

For instance, in the recent past, daily NIFTY 50 returns have exhibited a mean of -0.0003742873 and std. dev. of 0.01079387. When you run a simulation and plot the results over the actual closing prices of the index, you get the resulting chart:

monte-carlo.NIFTY

How many of these paths will result in a total equity wipeout of the back-tested strategy?