Tag: mutual funds

Comparison: Top 100 Funds

Large-cap stocks

Large-cap stocks are less volatile, ceterus paribus, compared to mid-cap and small-cap stocks. For most first-time investors, the set of Top 100 Funds offers a straight-forward way of adding equity exposure.

Fund/Scheme IRR (2014) Expense
Birla Sun Life Top 100 Fund -Growth Option 48.27% 2.82%
ICICI Prudential Top 100 Fund – Regular Plan – Growth 37.71% 2.77%
IDBI India Top 100 Equity Fund Growth 40.05% 2.87%
UTI – TOP 100 Fund- Growth Option 40.68% 2.43%

Picking the right scheme

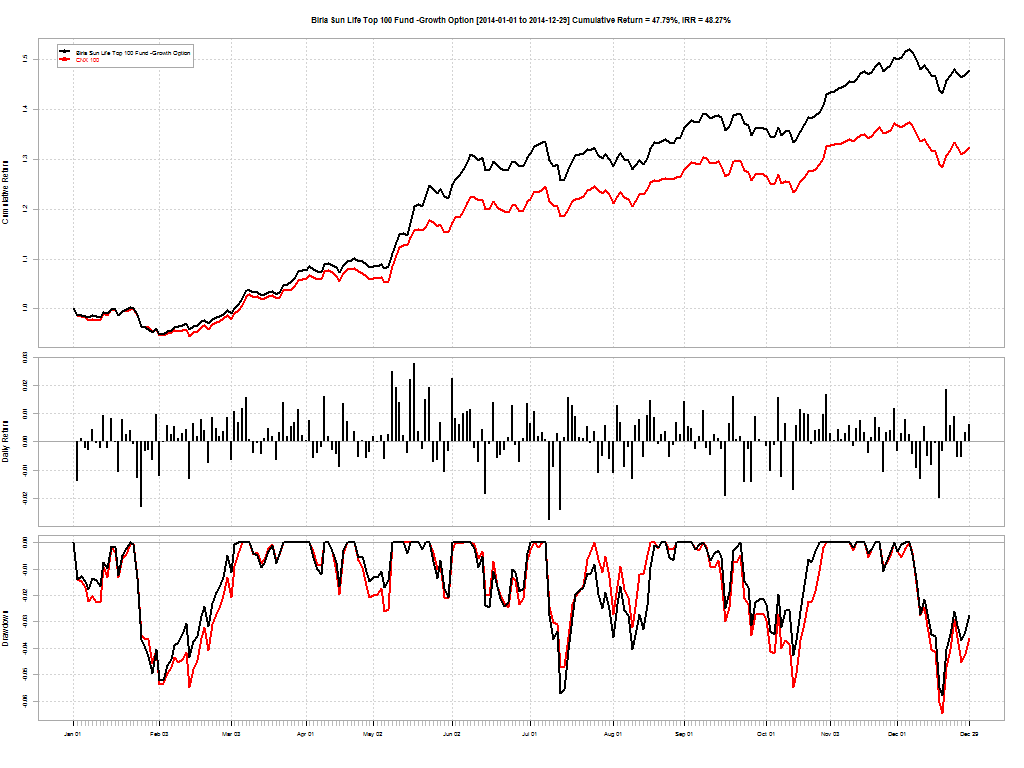
Birla Sun Life Top 100 Fund -Growth Option.performance

As an investor, you should care about two things: risk-adjusted returns and expenses. While the Birla fund gave better returns, it charged a higher fee compared to UTI. But are those higher returns sustainable? Investors should be willing to pay more for more. This is where the FundCompare tool can help.

Birla vs. UTI

Birla vs. UTI Top 100

Between 2009-07-01 and 2014-12-29, Birla Sun Life Top 100 Fund (Growth Option) has returned a cumulative 155.00% with an IRR of 18.56% vs. UTI TOP 100 Fund (Growth Option)’s cumulative return of 108.35% and an IRR of 14.28%.

On the face of it, Birla’s higher fees seems worth it. But it looks like higher returns came at the expense of higher risk. Birla’s beta (vs. CNX 100) is 0.90761 vs. UTI’s 0.83478 and the latter had deeper drawdowns as well. However, the Sortino Ratio tilts the scale towards Birla’s fund: 0.10762 vs. UTI’s 0.09043.

Conclusion

If you are looking for large-cap exposure then go for Birla Sun Life Top 100 Fund.
FundCompare: Pruning your Mutual Fund portfolio

The dilemma

Ownership of a diversified, un-correlated set of assets remains the touchstone of a well crafted portfolio. We had discussed how adding bonds to your equity portfolio reduces volatility before. However, comparing correlations between funds within the same asset class is a challenge.

For example, say you already have the Reliance Equity Opportunities Fund in your portfolio and your agent is pitching the Sundaram Select Midcap fund, how do you figure out whether to add to your existing holding of the Reliance fund, add an extra line item or switch to Sundaram?

Comparative returns

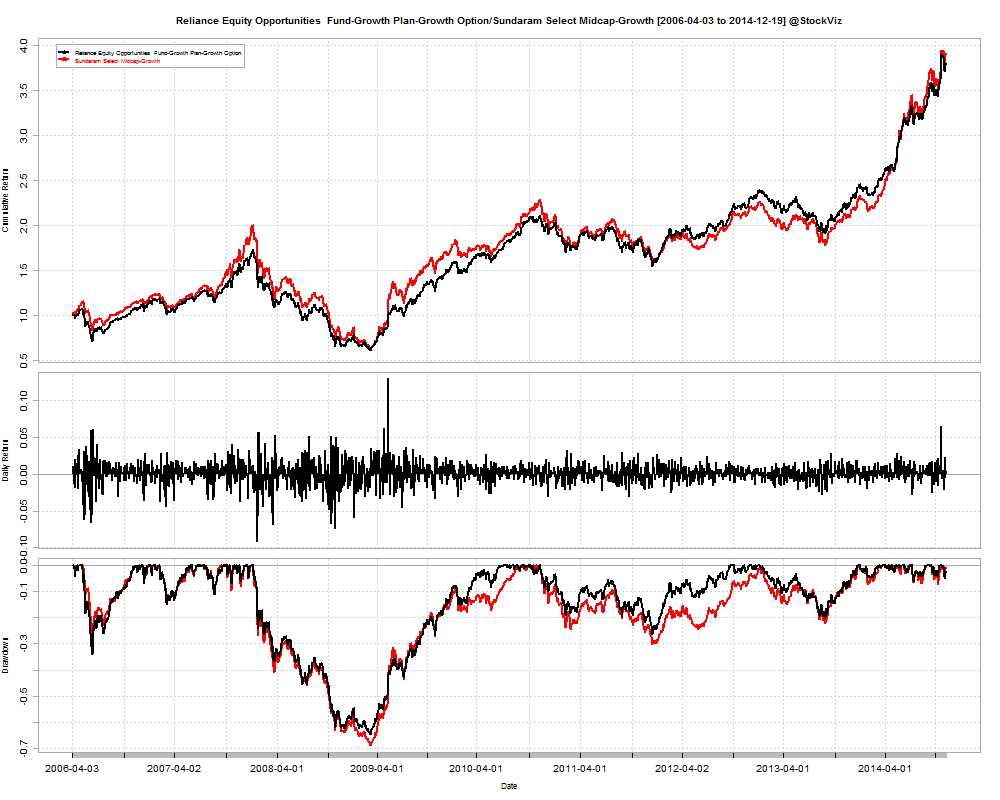
reliance_sund_returns

Between 2006-04-03 and 2014-12-19, Reliance’s Fund returned a cumulative 280.08% with an IRR of 16.55% vs. Sundaram’s cumulative return of 290.44% and an IRR of 16.91%.

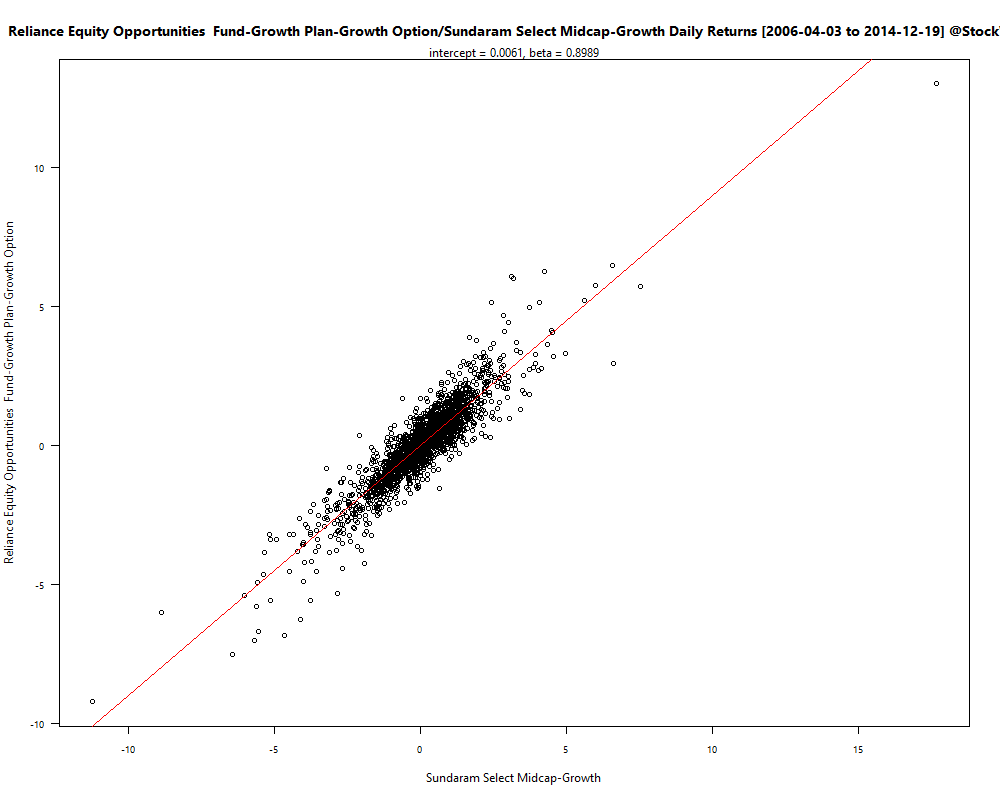
As you can see, the wealth charts are almost on top of each other. The correlation chart confirms it:

reliance sund cor

Except for a few outliers, they are almost the same fund packaged differently.

Histogram of returns

The FundCompare tool also gives you the histogram of fund returns and the associated skewness. In this case, the Reliance Fund has a skew of -0.15 vs. Sundaram’s +0.22. Given that the average returns are more-or-less the same, this means that Sundaram’s Fund is better. Besides, it also appears that Sundaram’s Fund has a better Sharpe ratio.

Given that Reliance’s Fund has an expense ratio of 2.29% vs. Sundaram’s 2.26%, I would say “switch.”

Compare Your Funds

Before pulling the trigger based on what your fund broker/adviser tells you, get a free quantitative analysis of your options on our FundCompare tool.

Are we setup up for a bond rally?

ICICI came out with an interesting note on why they expects Indian bonds to rally. They outline 5 factors:

  1. Improving current account balance
  2. Falling inflation
  3. Fiscal consolidation
  4. Rising savings rate
  5. Substantial FII inflows

Related: Long-term Gilt Funds, where we layout the same thesis.


You can run our comparison tool here: FundCompare


Please get in touch with Shyam for advice on investing in mutual funds.
You can either WhatsApp him or call him at 080-2665-0232.
He is an AMFI registered IFA who can advice you on IDBI, Mirae, HDFC, ICICI Pru, UTI and Birla Sun Life funds.

Broken Funds

Cycles usually turn and the most hated sectors end up bouncing back and out-performing the broader markets. Does the same apply to actively managed mutual funds? Should you bet on the asset manager’s luck turning and getting off to the races? Here are some “broken” funds that maybe of interest.

Escorts Infrastructure Fund

Since 2007-09-21, Escorts Infrastructure Fund has returned a cumulative -38.19% vs. CNX 500’s +58.39%. This fund should get a bad-timing award, having launched in 26-Jul-2007, if MorningStar is to be believed (factsheet.) If you are bullish on Indian infrastructure, you may be better off buying the INFRABEES ETF. [stockquote]INFRABEES[/stockquote]

JM Equity Fund

I wonder what the holdings of this fund were in 2008? It lost -71.81% (CNX 500: -64.26%) in value during the crash and is yet to recover. Seeing how well it tracked the broader market, it might make sense to just hold a CNX 500 index fund instead of paying this manager to actively run your investment to the ground.

JM Basic Fund

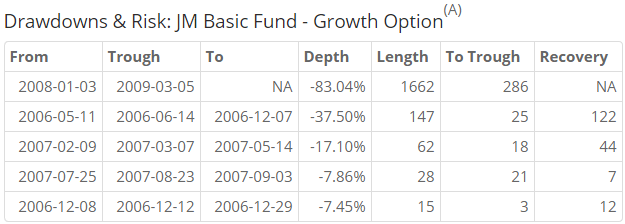
Since 2006-04-03, JM Basic Fund has returned a cumulative 4.72% vs. CNX 500’s cumulative return of 117.04%.

jm basic fund

Looks like the fund blew up pretty much every year of its existence.

HSBC Progressive Themes Fund

Something happened in Oct-2010 that permanently changed the course of this fund.

Since 2006-04-03, HSBC Progressive Themes Fund has returned a cumulative 36.18% vs. CNX 500’s cumulative return of 117.04%. And since 2013-01-01, the number is 25.73% vs. 31.98%.

Progressively losing client’s money.

Taurus Bonanza Fund

This fund was a bonanza for the asset manager who continues to charge 2.83% on Rs. 250.8M of assets (MorningStar.) Since 2006-04-03, Taurus Bonanza Fund has returned a cumulative 51.66% vs. CNX 500’s cumulative return of 117.04%.

It is yet to recover from the 2008 crash and you are probably better off buying a CNX 100 or CNX 500 index fund instead of chasing this bonanza.

Conclusion

It is said that there is a lot you can learn from studying failure. By looking at the track records of these broken funds, I think the key take-away here is that buy-and-hold only works if you (a) understand what it is that you are holding, and (b) stick to a strict re-balance frequency. Moreover, betting on reversion to mean might only work if you are betting that an out-performing manager will fall back to mediocrity. The other direction is a tough ask.

You can run the comparison tool here: FundCompare


Please get in touch with Shyam for advice on investing in mutual funds.
You can either WhatsApp him or call him at 080-2665-0232.
He is an AMFI registered IFA who can advice you on Mirae, HDFC, ICICI Pru, UTI and Birla Sun Life funds.

Risk, Volatility and Returns

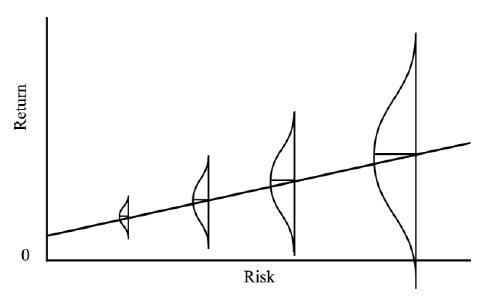
Many investors believe that more risk implies more returns. However, that is an over-simplification: more risk implies a higher probability of more returns (and a higher probability of loss, as well.) Higher risk also implies higher volatility. This graphic is probably the best illustration of the relationship between risk, volatility and returns.

risk-return

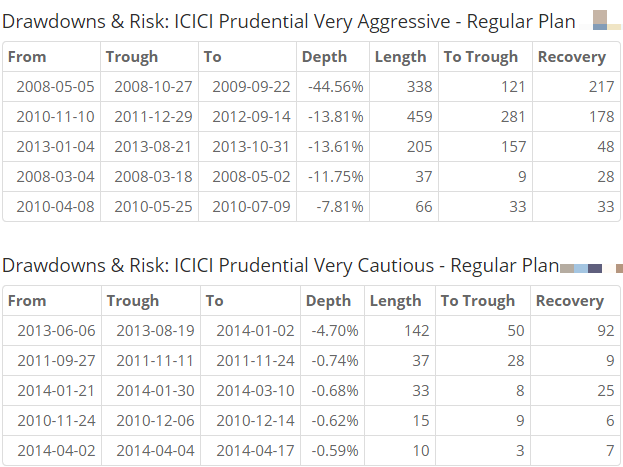
As mutual fund investors, you may have come across the ICICI Prudential “Very Aggressive” and the “Very Cautious” funds. Lets compare their relative performance across different time horizons to further understand the relationship between risk, volatility and returns.

Since March 2008

Since 2008-03-03, ICICI Prudential Very Aggressive fund has returned a cumulative 56.24% vs. ICICI Prudential Very Cautious fund’s cumulative return of 53.30%. The 3% out-performance came with significant stomach-ulcer causing volatility.

icici 2008

It would require someone to have some serious testicular fortitude to hang-on to their investments after a 45% drawdown. It took the “Very Aggressive” fund more than a year to claw itself out of the hole. And many investors would have abandoned the fund during that period.

Here’s wealth chart:

Since March 2009

Boom!

Since 2009-03-02, “Very Aggressive” returned a cumulative 169.40% vs. the “Very Cautious” cumulative return of 41.37%. Max Drawdown: -13.81% vs. -4.70%.

Peace of mind came with a very high performance penalty.

Since March 2010

Since 2010-03-02, “Very Aggressive”: 50.02%, “Very Cautious”: 35.48%.

And This Year

Since 2010-03-02, “Very Aggressive”: 17.58%, “Very Cautious”: 7.54%.

Conclusion

The real risk, if you are investing for retirement, is the inability to maintain a certain lifestyle post-retirement due to inadequate savings. Ideally, your investments should be risk-seeking when you are young and risk-avoiding as you near retirement. You can use a set of funds to reflect this attitude towards risk. And there is almost never a “one-size-fits-all-5-star-gold-plated” fund that you can remain invested forever.

You can run our very own comparison tool: FundCompare to see how different funds performed over different time frames, indices and other funds.


Please get in touch with Shyam for advice on investing in mutual funds.
You can either WhatsApp him or call him at 080-2665-0232.
He is an AMFI registered IFA who can advice you on Mirae, HDFC, ICICI Pru, UTI and Birla Sun Life funds.