Tag: mutual funds

Comparing: ICICI Prudential Corporate Bond Fund

We ran the Fund Comparison tool to get an idea of how the ICICI Corporate Bond fund stood relative to its peers. Here are some quick takes.

Outperformed GSecs

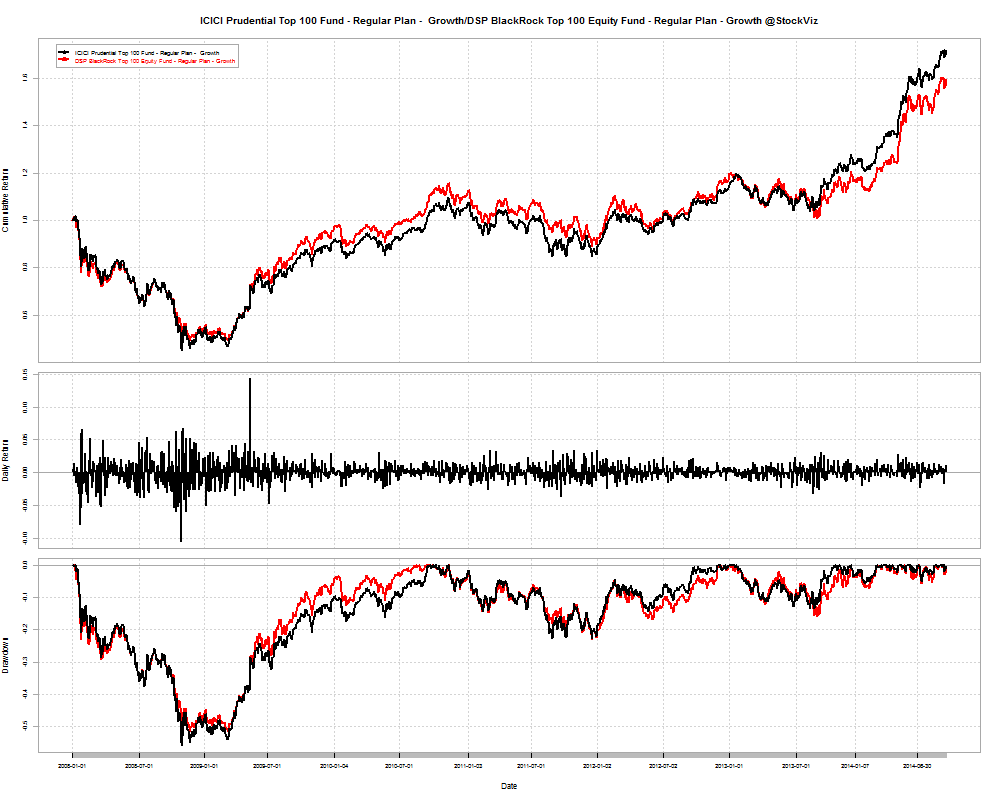
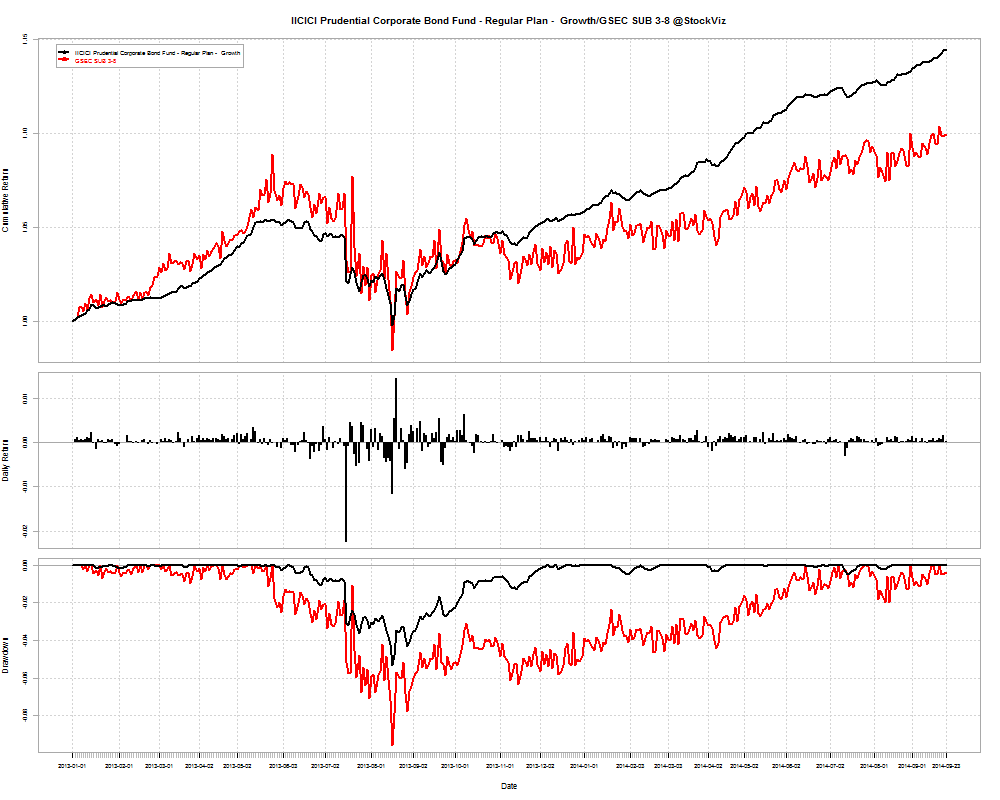
Since 2013-01-01, IICICI Prudential Corporate Bond Fund has returned a cumulative 14.51% vs. GSEC SUB 3-8’s cumulative return of 10.21%.

ICICI Prudential Corporate Bond Fund vs GSEC SUB 3-8

Outperformed Principal Debt Opportunities Fund

Since 2012-01-02, ICICI Prudential Corporate Bond Fund has returned a cumulative 25.68% vs. Principal Debt Opportunities Fund’s cumulative return of 24.74%. But ICICI had a deeper drawdown in 2013.

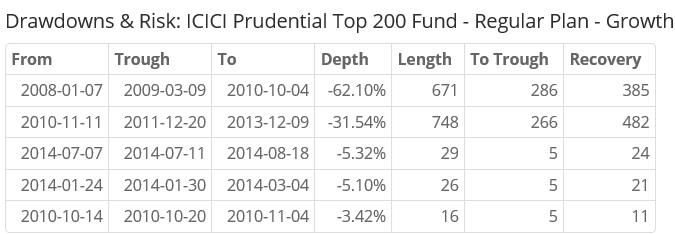
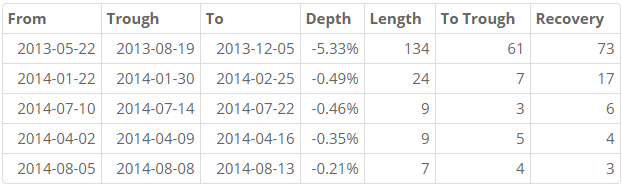
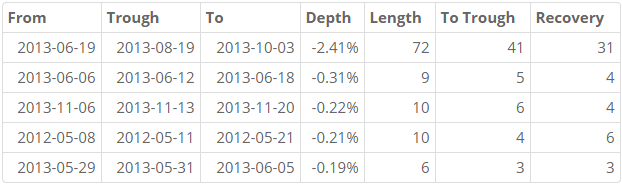
ICICI Prudential Corporate Bond Fund Drawdowns:

icici drawdown

Principal Debt Opportunities Fund Drawdowns:

principal drawdown

Outperformed UTI Gilt Advantage Fund

Since 2013-01-01, ICICI Prudential Corporate Bond Fund has returned a cumulative 14.51% vs. UTI – GILT ADVANTAGE-LONG TERM’s cumulative return of 12.88% while having a shallower drawdown in 2013: -5.33% vs. -8.18%

Conclusion

The ICICI Prudential Corporate Bond Fund could be attractive to investors looking to benefit from corporate credit improving on the back of a recovering economy and riding the RBI’s expected rate cuts coming down the pike.

You can run the comparison tool here: FundCompare


Please don’t treat the information here as investment advice.
However, if you want advice on investing in mutual funds, please get in touch with Shyam.
You can either WhatsApp him or call him at 080-2665-0232.
He is an AMFI registered IFA who can advice you on ICICI Pru, UTI and Birla Sun Life funds.

Quantitative Comparison of Mutual Funds

How do you compare two Mutual Funds and what should be the basis for such a comparison? There is the question of returns, obviously. But higher returns can be achieved by taking on more risk. And then there’s the question of draw-downs. What were the periods of bad performance and how long did it take the asset manager to make up for those losses? How do you compare risk-adjusted returns of two funds? What if you want to compare returns to whatever benchmark index you wanted?

Mutual Fund Comparison Tool

You can compare over 800 funds to each other and any benchmark index you choose. For example, are you confused between ICICI Top 100 and DSP BlackRock Top 100? Punch it in and hit compare.

Since 2008-01-01, ICICI’s Top 100 Fund has returned a cumulative 71.64% vs. BlackRock’s Top 100’s 59.49%.

And as you can see from the wealth chart below, BlackRock’s under-performance has been recent.

icici dsp top 100

However, during the depths of the 2008 crisis, BlackRock managed to go down 51.73% vs. ICICI’s 55.66% and spent 632 days in the red vs. ICICI’s 656 days.

Now, how about comparing ICICI’s Top 100 vs. their own Top 200?

Since 2008-01-01, ICICI Top 100 has returned a cumulative 71.64% vs. Top 200’s cumulative return of 48.57%. And the Top 200 fund really shit the bed during 2008.

icici 200

Confused between value funds and midcap index funds? Do famous managers live up to their reputations?

Since 2010-01-04, PPFAS Long Term Value Fund has returned a cumulative 50.62% vs. BSE MID CAP’s cumulative return of 44.71%. And the fund’s worst period was between 2013-08-28 and 2013-10-11, where it lost -5.84%.

Go ahead, check out the tool: FundCompare


Please don’t treat the information here as investment advice.
However, if you do want advice on investing in mutual funds, please get in touch with Shyam.
You can either WhatsApp him or call him at 080-2665-0232.
He is an AMFI registered IFA who can advice you on ICICI Pru, UTI and Birla Sun Life funds.

Mutual Fund League Tables

AMFI puts out AUM statistics of mutual funds once a quarter. Here are some key take aways.

The Top 5 Dominate

Between 2009 and 2014, the top 5 players have remained the same: HDFC, ICICI, Birla Sun Life and Reliance. And their share has remained more-or-less the same: 56.96% in 2009 and 54.6% now.

32 out of a total of 46 funds have less than 2% share, 29 have less than 1%

mutual-fund-aum-share

There are way too many schemes

There are 1066 equity schemes (all permutations and combinations.) The top 2 schemes (both from HDFC) have more than 10% of AUM and the top 10 have about 30%. The rest of them fight for scraps.

equity-scheme-aum-share

Direct plans even the playing field

… a bit.

PPFAS has a 5% share of all direct plans.

direct-scheme-aum-share

However, Direct plans are yet to make a dent

Equity AUM under direct plans have doubled since last year. This ought to be giving distributors sleepless nights…

direct-regular-scheme-aum-share

Mutual fund positioning: Feb 2014

We are trying to figure out if tracking mutual fund purchase and sell decisions can help us be better investors. What fund managers do, vs. what they say, can provide insights into their decision making process. Here are their biggest moves in February this year:

Five month aggregates

mf removed

Reversals: Reliance(+), Bank of Baroda(), Petronet(+)

mf added

Reversals: TCS(+), State Bank of India(+), Titan(+), Cadila Healthcare(+)
 
 
NOTE:

  • Only open ended funds that were in the “accumulation” phase were considered
  • Funds named “growth” and with the “direct” option alone were considered

Institutional Investing Trends

Last year has been a wonderful year to go elephant hunting. Banks were hurting and buried under bad debt, FIIs were selling Indian debt on the back of a collapsing Rupee, this pretty much made domestic bond funds the lender of last resort. Supply, combined with the fact that commissions on selling debt funds are way more lucrative than those on equity, lead to a DII (Domestic Institutional Investor) debt binge.

DII Fund Flows (Cash)

dii cash

FII Fund flows (Cash)

FIIs were in full on panic mode in June, July and August last year. But haven’t really participated in the equity markets this year.

fii cash

DII Fund Flows (Derivatives)

After being short net short in December and Jan, are we seeing a change of heart?

dii derivative

FII Fund Flows (Derivatives)

FII participation remains low. Waiting for elections?

fii derivative

FII Favorites

J&KBANK +26.43%
TATAMTRDVR +19.96%
TECHM +18.30%
DEN +17.51%
NHPC +17.26%
UPL +13.05%
HDIL -36.60%
HEXAWARE -23.00%
AMTEKAUTO -19.25%
SINTEX -12.81%
IVRCLINFRA -12.65%
WELCORP -12.1%

Mutual fund trends

Equity mutual funds’ actions over the last 4 months:

Note:

  • All figures in Rs. crores
  • Data from SEBI, fund portfolio disclosures and corporate filings
  • Only open ended funds that were in the “accumulation” phase were considered
  • Funds named “growth” and with the “direct” option alone were considered
Related