Introduction
Mutual fund investors are faced with a zillion choices in the marketplace. At last count, there were more than 5300 different schemes that an investor could choose from. When confronted with such a large number of choices, investors either spiral into an “analysis paralysis” mode and end up doing nothing or blindly invest in whatever their broker recommends – both these paths lead to situations that are injurious to the investor’s long-term financial health.
In this post, we try to simplify the choices in front of the investor by ranking the top 10 funds based these risk metrics: sharpe ratio, bear-beta, information ratio, draw-down depth and draw-down length between Jan-2010 and May-2015.
Sharpe Ratio
| Fund | SHARPE | IRR |
|---|---|---|
|
0.35
|
2.12
|
|
|
0.10
|
24.25
|
|
|
0.09
|
17.14
|
|
|
0.08
|
3.87
|
|
|
0.08
|
2.14
|
|
|
0.08
|
3.67
|
|
|
0.07
|
5.79
|
|
|
0.07
|
17.29
|
|
|
0.07
|
5.57
|
|
|
0.07
|
8.11
|
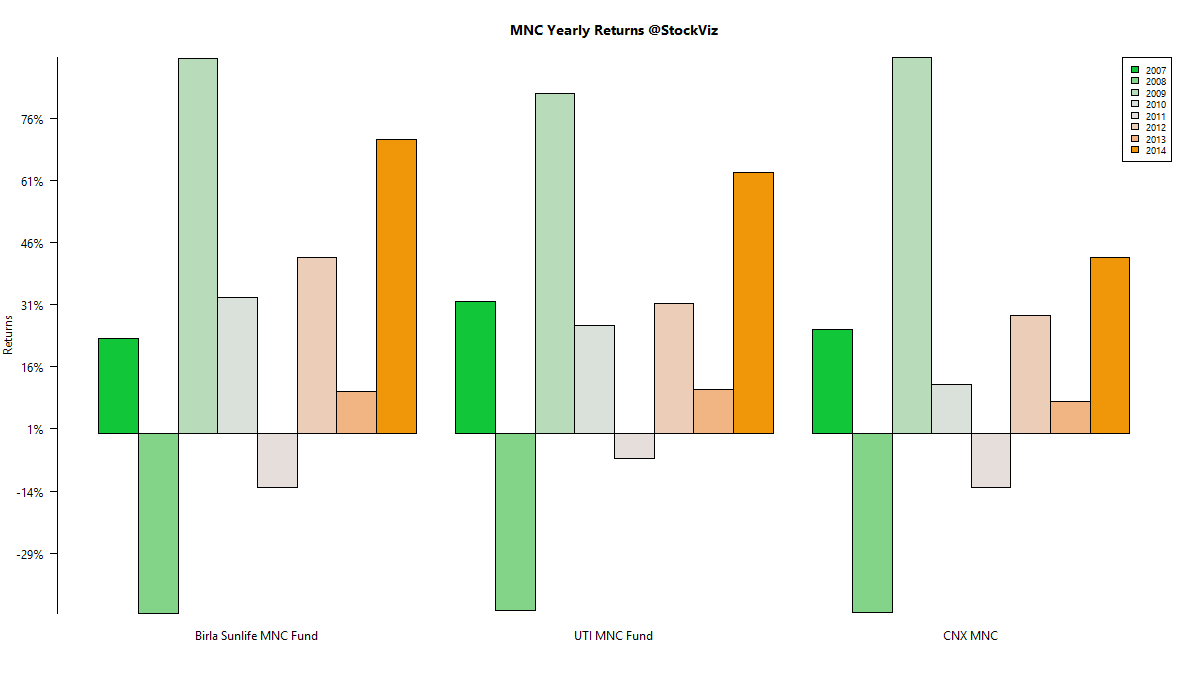
Glad to see the two MNC funds that we have been recommending our clients make the top end of this list.
But also note the single digit IRR funds.
Bear-Beta
| Fund | BETA BEAR | IRR |
|---|---|---|
|
-0.03
|
2.12
|
|
|
0.05
|
4.81
|
|
|
0.08
|
1.56
|
|
|
0.20
|
2.14
|
|
|
0.25
|
3.87
|
|
|
0.27
|
2.71
|
|
|
0.30
|
3.67
|
|
|
0.33
|
2.81
|
|
|
0.37
|
2.86
|
|
|
0.41
|
2.37
|
Given the single digit IRRs that test will for this metric, investors can ignore the bear-beta.
Information Ratio
| Fund | IR | IRR |
|---|---|---|
|
2.05
|
15.96
|
|
|
1.95
|
13.96
|
|
|
1.84
|
16.84
|
|
|
1.83
|
17.31
|
|
|
1.73
|
13.27
|
|
|
1.71
|
15.23
|
|
|
1.69
|
12.55
|
|
|
1.57
|
24.25
|
|
|
1.55
|
13.35
|
|
|
1.53
|
17.29
|
This is probably a better metric than the Sharpe ratio to rank funds.
Nice to see that both the Value Discovery fund and an MNC fund make this list.
Draw-down Depth
| Fund | DRAW DEPTH | IRR |
|---|---|---|
|
-0.35
|
2.12
|
|
|
-7.46
|
3.87
|
|
|
-9.69
|
2.14
|
|
|
-10.87
|
3.67
|
|
|
-11.57
|
2.81
|
|
|
-12.05
|
2.71
|
|
|
-12.06
|
2.86
|
|
|
-13.00
|
5.57
|
|
|
-13.26
|
7.30
|
|
|
-13.81
|
2.37
|
For example, the Blended Plan at the top of the list only lost 0.35% from its peak valuation between 2010 and 2015.
Portfolios with a lot of short-term bonds test well for this metric. But note the pathetic IRRs – no pain = no gain!
Draw-down Length
| Fund | DRAW LENGTH | IRR |
|---|---|---|
|
110.00
|
2.86
|
|
|
126.00
|
8.11
|
|
|
126.00
|
7.30
|
|
|
128.00
|
5.57
|
|
|
140.00
|
17.14
|
|
|
141.00
|
24.25
|
|
|
158.00
|
3.67
|
|
|
190.00
|
4.81
|
|
|
194.00
|
1.71
|
|
|
207.00
|
1.44
|
Shorter bounce-backs typically indicate high-quality portfolios.
Nice to see both the MNC funds make this list.
Past Performance
| Fund | BETA | IRR |
|---|---|---|
|
0.55
|
24.25
|
|
|
0.78
|
17.31
|
|
|
0.69
|
17.29
|
|
|
0.54
|
17.14
|
|
|
0.73
|
16.84
|
|
|
0.76
|
15.96
|
|
|
0.76
|
15.23
|
|
|
0.80
|
13.96
|
|
|
0.74
|
13.35
|
|
|
0.78
|
13.27
|
Conclusion
We looked at broad spectrum of funds – including those with bond allocations – to ferret out a good set of funds that investors can consider. Depending on what is more important to the investor, the appropriate set of metrics can be weighted to fit individual risk appetites.
Mutual fund investors whom we advise will immediately recognize some of these funds as they are already part of their portfolios. Get in touch with us if you are looking to invest! Call us or Whatsapp us at +918026650232